
Clearly, sustained low inflation implies less uncertainty about the future, and lower risk premiums imply higher prices of stocks and other earning assets. We can see that in the inverse relationship exhibited by price/earnings ratios and the rate of inflation in the past. But how do we know when irrational exuberance has unduly escalated asset values, which then become subject to unexpected and prolonged contractions as they have in Japan over the past decade?
— Alan Greenspan, “The Challenge of Central Banking in a Democratic Society”, 1996-12-05
This now famous quote could easily be used to describe today’s stock market. The irony of the quote, however was the fact Alan Greenspan then proceeded to help create the fuel for the first “Forest Fire“.
Some institutions are taking notice. Goldman Sachs has issued a warning the past two weekends about the short-term outlook for stocks. Last weekend they issued a “sell” recommendation as they expect a sell-off in the next three months, saying:
“In our view, equities remain in their ‘fat and flat’ range and are now just near the upper end.”
They followed that report with another on Sunday, this time by Chief US Market Strategist David Kostin. The title of the report says it all, “There will be no medal winners this year in stocks because everything is too expensive.” Mr. Kostin included this chart detailing the current valuation levels:
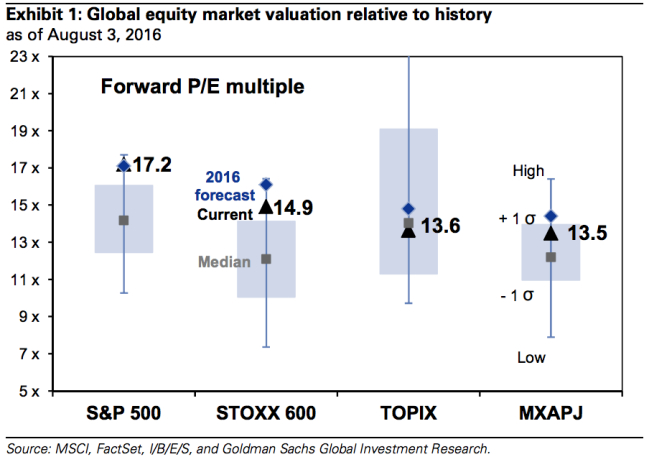
Note they are using “Forward” P/E levels, meaning EXPECTED earnings. We will have more on earnings later in the week, but using these estimates for valuations typically means artificially LOW valuation measures as companies rarely come anywhere close to hitting their estimated earnings 3, 6, or 12 months down the road.
Another big hitter, Doubleline’s Jeffrey Gundlach is telling investors to “sell everything”. He too cites valuation levels, but this time highlights the asset bubbles the Fed has created not only in stocks, but bonds and real estate assets as well.
Tuesday, August 9
After hitting new highs on Friday, stocks paused a bit on Monday. I continue to hear analysts talk about the attractiveness of stocks. “The P/E ratio is ‘only’ 17,” is the common statement they use, which is sometimes followed with a comparison to where it was in 1999. They fail to mention the “E” (earnings) is typically ‘operating’, ‘adjusted’, or ‘pro-forma’ earnings, all terms that mean ‘manager’s estimates that do not conform with accounting principles and exclude any negative expenses’.
They also are using FORWARD earnings estimates, meaning they are taking great confidence in the ability of analysts (and companies) to predict the future, something they have consistently failed. Not only have they failed, they have failed miserably. This chart shows how far off they have been in estimating corporate earnings.

A better way to look at valuations is to look at a broad range of metrics and compare them to the historical averages. This is why I like the monthly update from Advisor Perspectives. Looking at the valuations as of the end of July, we can see once again the market is nearly back to what many academics say is an objective way to measure an asset bubble — 2 standard deviations above the long-term average.

Wednesday, August 10
Stocks continued their lackluster consolidation around the new all-time highs. While most of the Western US seems to be back in school, the east coast is in the final months of summer vacation, which means volume is extremely light.
The highlight of the day for me was learning I passed Level III of the CFA Exam & have earned the right to use the Chartered Financial Analyst designation. To all of our readers that sent me words of encouragement along the way, I truly thank you. It was a difficult journey, but certainly rewarding. I hope to continue learning and refining my understanding of the market and passing that along to our readers, advisors, and clients.
Yesterday we looked at earnings estimates & their history after looking at the primary reason Goldman Sachs is recommending investors (traders?) sell stocks over the next 3 months — valuations. I mentioned the fact those wishing to argue in support of an ‘undervalued’ market were having to resort to forward (estimated) operating (management estimates that exclude ‘non-operating’ expenses) earnings.
Out of curiosity, I decided to update my spreadsheet of the S&P 500 estimates to dig a little deeper. S&P (the source for my spreadsheet) confirmed the ongoing shift of the “recovery” we showed in the chart yesterday.

Analysts keep missing their forecasts, but somehow keep ending up with a future earnings estimate around $120. It’s almost like they put $120-128 in their spreadsheet 8 quarters from now and then back-fill the other quarters to get there.
Taking a look at the annual growth in earnings also shows the constant optimism of analysts.

Here’s the problem and why I am more confident than ever we are in a bubble. Even if we assume the analysts estimates for growth are correct, using the average forward P/E going back to 1988 (so including the tech & financial bubbles), fair value on the S&P 500 would be 1750 using GAAP Earnings or 1999 using “operating” earnings. In order to justify above average P/E levels, we need to have above average growth. That simply isn’t the case, which means stock prices are significantly overvalued. Granted stocks can remain overvalued far longer than most people realize, but when they correct it is downright scary.
Thursday, August 11
Once again we saw a market that did not do much. Given all the uncertainty, this type of calm should be welcome. The S&P 500 has not closed +/- 1% since July 8. During that time we’ve only seen it close +/- 0.5% or more twice. The question remains whether this is the calm before a storm or a consolidation before a push higher as we move into fall.
Given the valuation levels in the market, I would argue for a looming storm that pushes stock prices significantly lower, but the market can remain irrational far longer than most people believe. One argument the bulls continue to make regarding the attractiveness of stocks is the comparison of yields on stocks versus bonds. According to these experts the 2.03% dividend yield on the S&P 500 compared to the 1.51% 10 Year Treasury Bond yield makes stocks attractive (the stock yield was 2.3% back in February, so does that mean they are less attractive now).
This type of comparison drives me crazy. Stocks & bonds are completely different investments with completely different characteristics and roles in the portfolio. First off, a dividend is not a contract, but simply a planned payment that could evaporate in a heartbeat. For example, the S&P 500 dividend peaked at $28.80 per share in September 2008. It did not bottom until April 2010 at $21.90 per share (a 24% cut in the dividend payment). Bonds, however, are contracts to pay a certain amount at a certain point in time. Missing a bond payment has devastating consequences to an issuer and is something management will do everything possible to avoid.
If we want a more fair comparison of stocks versus bonds, then we shouldn’t use the basically risk free US Treasury Bond yield, but rather a more risky bond. The AAA-rated corporate bond yield is 3.4%. The still “investment grade” bond yield for Baa-rated corporate bonds is 4.2%. It is highly unlikely any of these bonds will cut their coupon payment even in the depths of a recession, unlike stocks and their dividend payments.
Stocks to have upside while bonds held to maturity do not, so it is fair to include the “earnings yield” in the analysis. As an “investor”, owners of a stock have a claim on the earnings. Those earnings can either be re-invested into future growth of the company or paid out in dividends. We simply cannot add the earnings yield to the dividend yield since the dividends must come from earnings. Earnings yield is simply the inverse of the P/E ratio.
Using actual earnings (not pro-forma or ‘adjusted’ earnings since dividends must be paid from all earnings), the current earnings yield is 4.1%, which is below the Baa-rated corporate bonds. Given the limited upside of held-to-maturity bonds, a better comparison for stocks should be the high yield bond index yield. Those more risky bonds (which still have a historical default rate less than 5%) appear far more attractive than stocks at the current yield levels.

Despite this we continue to hear far too many people say “get out of bonds” because rates have to go higher. We’ve seen far too many of our clients leaving this year due to this belief (along with the “your fees are too high” argument we always hear during the late stages of a bull market). For the most part, investors in bonds should not be comparing their returns to the stock market. The risk characteristics are not even close to the same. Those that have fallen for this trap have missed out on one of the best starts to the year we’ve had since 2009.
We also are hearing this same thing regarding Treasury Bonds. While yields are frustratingly low, the US yield relative to the rest of the developed world is still quite attractive.

When comparing the risks and potential returns of stocks versus bonds I have a hard time understanding why anybody would prefer the 4% yield on stocks to the 6% we are currently earning on our Tactical Bond accounts while invested. What really tilts the scales, in my opinion, is the daily management of the account and the tight “stop” levels we have in place when the uptrend reverses.
Friday, August 12
Given this week’s topic it is fitting the stock market did something it had not done since December 31, 1999 — The Dow, S&P 500, & NASDAQ all closed at all-time highs on the same day. Based on the moves we are seeing clients and advisors making with their portfolios, where the only thing that matters is finding the highest (recent) returns at the lowest cost, the market certainly is partying like it is 1999. People seem to forget a.) I have a good memory, b.) I let the data dictate my analysis, & c.) I’ve been sitting in this seat since 1998 & have witnessed this behavior before.
The attitudes I’m seeing towards fees, returns, & risk is quite similar to what I saw in 1999/2000 & 2007/2008. I can see why clients & advisors can fall for this trap…..it’s human nature, but it doesn’t make it any less frustrating to watch people make what I know will end up being major mistakes with their portfolios.
Surprisingly, it appears many Wall Street firms have learned their lessons about chasing returns regardless of valuations. We mentioned Goldman Sachs’s bearish call on stocks earlier this week. This morning Bank America Merrill Lynch issued a report titled, “The Final Melt-up“. They are concerned that after pulling money out of most risk assets for most of the year, investors are pouring money into them now that markets are back to all-time highs.
All week we’ve been discussing valuations and where they sit relative to historic levels. We’ve also looked at the denominator from the bulls’ favorite valuation metric, the P/E ratio and some of the “adjustments” being done that make stocks look more attractive than they already are. My favorite valuation measurement is the so-called Buffett Indicator, which measures the valuation of the stock market relative to the economy. There are no accounting tricks, or analysts estimates involved. I also like the concept behind it as it is based on fundamental economic principles — over the long-run the stock market cannot be worth more than the overall economy. In addition, the Buffett Indicator, along with Price/Sales has the highest “fit” (R-squared) when it comes to predicting returns.
We all know the theory, “buy low, sell high” yet for some reason investors forget this during irrationally exuberant periods like today. The data illustrates the advantage of waiting until prices are more attractive and also shows the abysmal returns generated when you buy at high valuation levels.
")
Regardless of the tricks used or the valuation measurement chosen, stocks are at valuations we’ve only experienced in past market bubbles (1929, 1999, & 2007). For those using a more passive strategy, the odds say the longer-term returns will be greatly disappointing.

Be sure to check out the “Current Allocations” tab at the top of the page for our latest allocations and updates on our positions.


