
The headlines this week were alarming. On Monday we saw "Worst drop in 12 years", "Trading halted", "Credit markets seizing up", "Oil prices crash", and many more were all over my smart devices. Thursday was even worse with the "worst loss since 1987" headlines. Hopefully readers of this blog were prepared for the big drop and were able to control the emotional response that often comes when we see such a big drop (or rise) in stock prices.

We are now seeing the President and Congress work on ideas to help stem the economic damage. The messaging, delivery, and speed the fiscal stimulus comes will be the key. I will remind everyone to not be sucked into enthusiasm about the various stimulus ideas that are floated. In other crises multiple attempts of stimulus were used and it took months to see if they were effective. Things will get better and I'm confident our leaders will figure out a way to do this, but we need to keep our emotional responses in check.
The most important thing to do is ignore the advice of the "EXPERTS". We will continue to see all kinds of predictions about what the impact will be on the economy. Just as I said at the beginning of the year when virtually every "expert" out there saw no issues on the horizon for 2020, any predictions about the future are worthless in my opinion. We'll let the data dictate our allocations, not our opinions. It's served us well for 28 years.
Rally Potential
Going back to the diagram I created last week, the rush of sellers into stocks was the direct result of the lows from last week not holding up. Essentially all the people who rushed in and bought the dip and were temporarily rewarded, suddenly found themselves not only giving up their gains, but now down on the trade. Buying the dip has worked so well for the last 12 years when it didn't, we saw a panic.
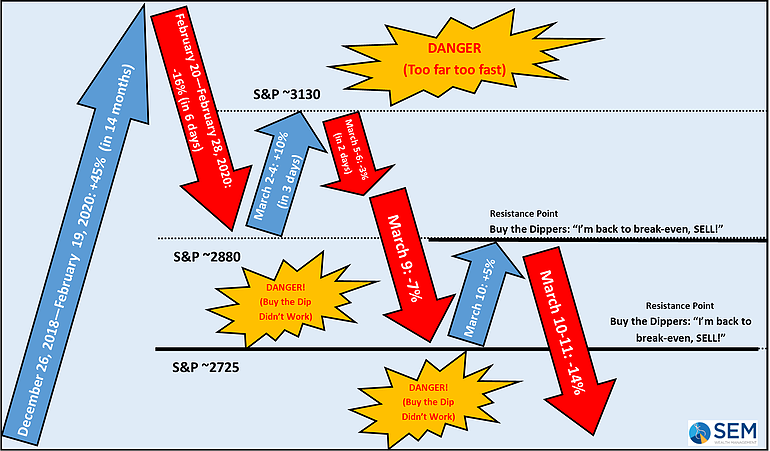
Now we have a potential problem for the market --- past levels of support (where a bunch of people bought) turns into resistance as people who wished they had sold now have another chance to sell. The market may attempt to rebound and very likely could get back above the 2725 level, but what we really need to see is settling down and consolidation of these losses. In other words, investors and speculators putting emotions aside and making more rational decisions.
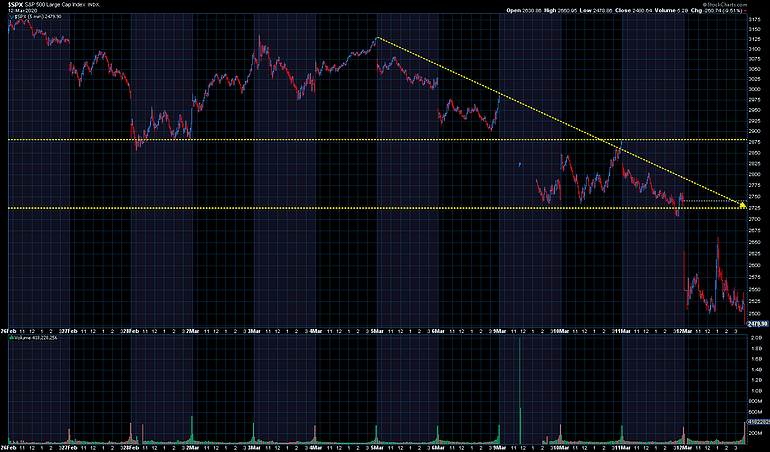
A 5 minute chart of the past 12 days shows the wild fluctuations. While our job is to watch every tick of the market on our clients' behalf, you don't have to. Turn off the alerts and turn off the news if you have to. Avoid checking the movement in the market. We've been through MUCH worse than the COVID-19 pandemic.
What is Fair Value?
For those of you that do not know, I started my investing career as a fundamental analyst and manager. I learned the hard way in 1997 that fundamentals do not always matter (when the NASDAQ lost 20% in a couple of weeks) that stocks can quickly adjust to a different value with a seemingly minor change in the economic environment.
Here is an update of the "fair value" chart. Remember every market participant is attempting to determine what is a good price for stocks. The ultimate price ends up being that day's vote. I added the method you can use in red boxes on the chart.
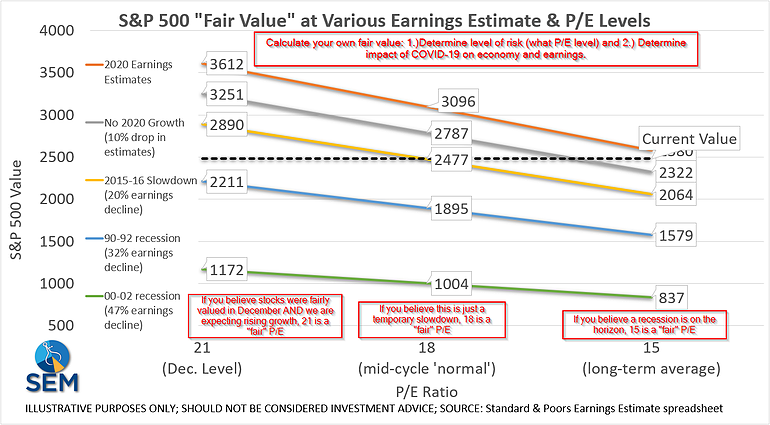
My subjective opinion (not anything we use at SEM) is 18 is a much more reasonable P/E ratio and earnings will probably end up being down 20% from current estimates That would put "fair value" around 2477 - 2787, which is right where the market closed on Thursday. A minor case can be made that 21 is indeed a reasonable P/E ratio given how low interest rates are, but I could also make a case that the panic around COVID-19 will throw us into a recession, which means a reasonable P/E is closer to 15 and we could see a 32% decline in earnings. That puts "fair value" on the S&P down around 1579, or an additional decline of 36% from here. This is the struggle of every manager and investor out there.
Our models at SEM attempt to take the things I learned from my early career about how stocks are priced and utilize quantitative methods to take the guesswork out of the allocation decisions. Our Dynamic Models, which have been stars the past few years are well positioned for whatever adjustments to earnings and P/E ratios investors ultimately decide are necessary. Our Tactical Models are also well positioned for this environment. They are sitting in lower risk assets waiting for things to settle down so they can take advantage of the lower prices.
I personally wouldn't want to guess at where "fair value" ultimately lands. There are just too many things happening that NOBODY can predict right now.
What about your employer plans?
I've fielded quite a few calls and emails this week about questions on retirement plan allocations that SEM doesn't manage. The biggest struggle y'all have with those plans is you will see options in there that are potentially up 5-10% in 2020. The stock-heavy options are likely down 25% or more for the year.
It is tempting to make the move to the better performing options, but those options are all likely full of Treasury bonds. A few weeks ago I posted a chart showing how much a 10-year Treasury bond would move for various changes in interest rates. The chart is updated below.
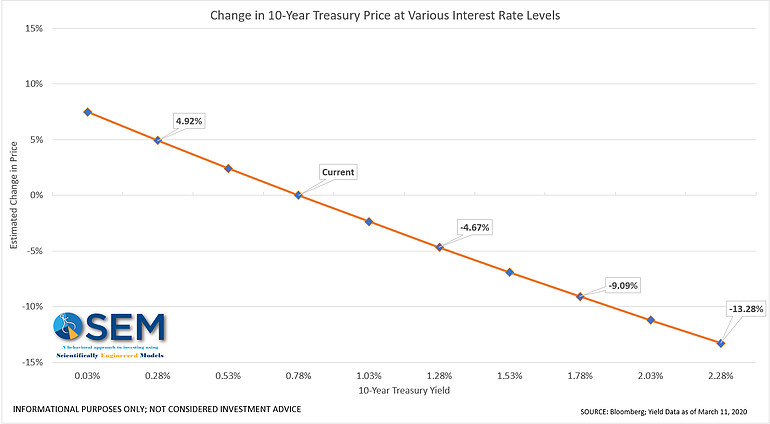
While you could potentially make a little more money as interest rates moved towards the 0% line, you also are taking on significant risks.
My advice for those plans without knowing your situation is this -- if you're over 59 1/2 and have the ability to roll out some of the money to be managed by SEM, let us manage the lower risk money and you keep maxing out your contributions every paycheck in the higher risk options.
If you're younger than 59 1/2 and will be working for at least 10 years, keep maxing out your contributions every paycheck in the higher risk options.
For those in between or with more complicated situations, please consult with your SEM financial advisor.
Happy Anniversary

Coincidentally, Monday was the 11-year anniversary of the stock market bottom following the financial crisis. The S&P 500 closed at 676 that day. Since February 20, the S&P 500 has lost over 900 points. IGNORE THE 'BIGGEST DROP EVER' HEADLINES! They are talking points, not percentages.
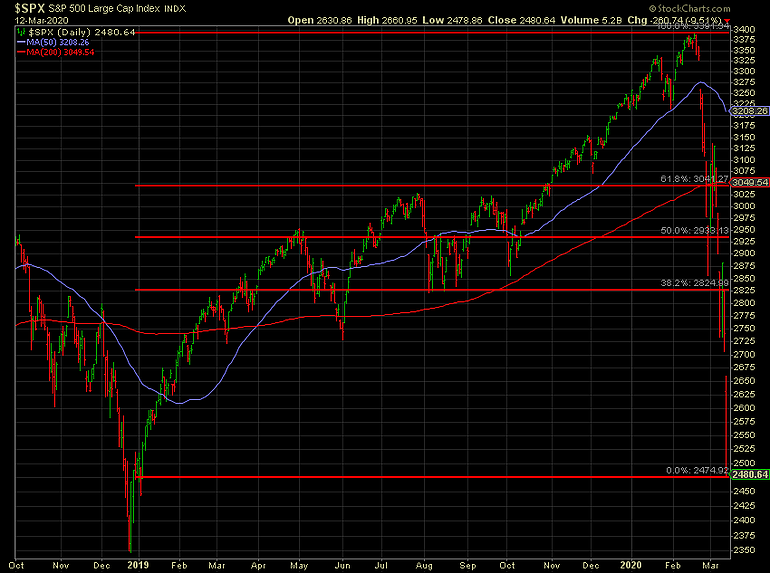
That said, since that day 11 years ago, stocks have gone up at a 14% annualized rate. The long-term average is 8-9%/year. Whenever stocks have long periods that far above the average they have VERY BIG, SCARY losses that take them BELOW THE TREND.
We are just now back to the trend. If this crisis isn't solved very soon, we could easily see the economy go into a recession, companies go bankrupt, and "investment grade" bonds default on their payments. It's not too late to adjust your portfolio to the right level of risk for your financial plan, cash flow strategy, and investment personality.
NOTE: This article was originally posted the morning of March 10. It contains updated charts through the close on March 11.


