
Last week, I mentioned being cautious about reading into market moves over the summer. It doesn't mean we can't completely ignore what is happening. Losses are losses and gains are gains. I highlighted 3 Themes that are worth watching. This week, the market is conflicted with two of the themes — Treasury bonds are pricing in a slowdown and the market is relying on increasing earnings. If the bond market is right, stocks are in trouble.
The reason they are in trouble is stocks are pricing in near perfection — above average growth rates for the next 3-5 years with no inflation (which assumes an accommodative Fed.) Pretty much every valuation multiple I follow is either at an all-time high or just below the values we saw at the end of the tech bubble.
The market is currently expecting earnings to grow by 56% in 2021 and another 13% in 2022. Maybe they are right, but even if they hit that number AND stocks are valued at a P/E ratio of 21 in a year and a half, the potential upside is just 3% from here.
In order to continue this exponential growth rate either earnings have to be stronger than currently expected or investors have to be willing to pay more for earnings than they did in 1999!
The reason we follow our behavioral approach is based on the fact market movements, including valuation and earnings estimates, are all based on human emotions. If everyone feels good about the future we see both earnings estimates and valuation multiples increase. This causes stocks to move higher and more and more people to feel great about the future, which causes more and more money to flow into the market.
It works even faster on the downside. If people become more pessimistic about growth we see both earnings estimates and valuation multiples decrease, which causes stocks to drop. As they drop further, those late to the party begin to panic as their gains quickly turn into losses.
I'm not saying the sell-off has started, but over the last week we've gotten a reality check. The COVID delta variant is a growing concern to global growth rates and even to some regions of the US. The Fed has begun discussing how to taper their purchases (and ended their support of the corporate bond market a little over a month ago). Congressional stimulus is still flowing, but at a much slower rate with further prospects of mass spending running into all kinds of obstacles.
This week I'd encourage you to ignore the reasons behind the moves in the market and focus more on reality. I often show these two charts to put the stock market in perspective.
When we look at the chart going back to 2009, with hindsight we see every dip should have been bought. The market seemingly would not stay down.
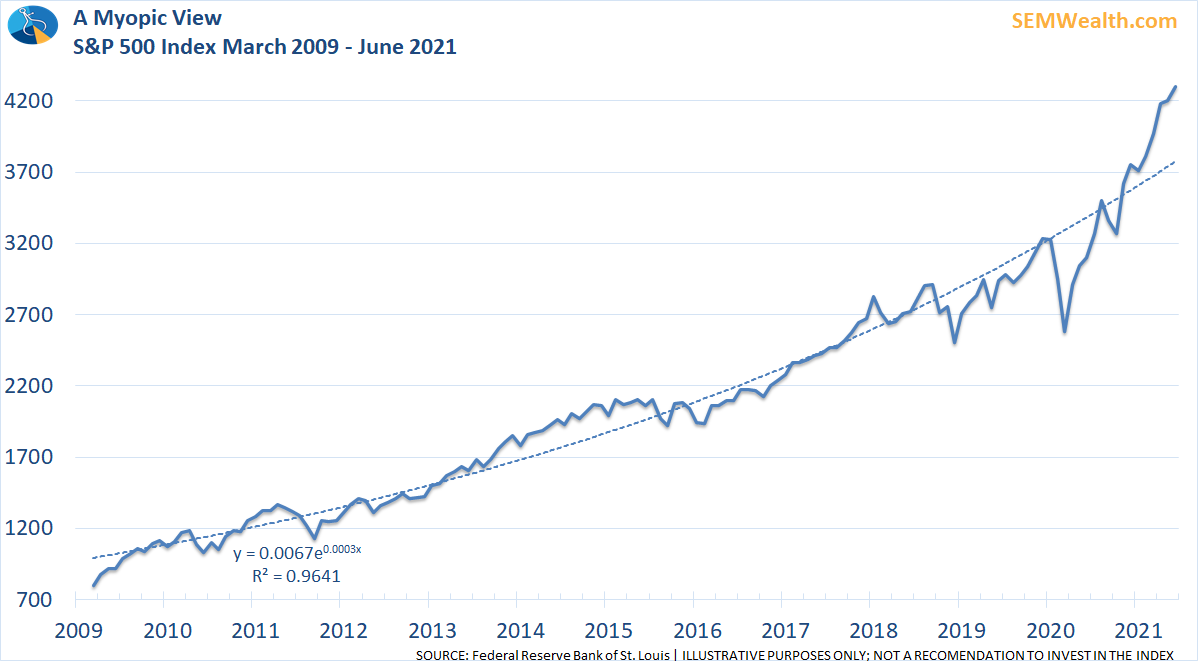
The S&P 500 has compounded at an impressive 15.3% annualized rate since 2009. Ask yourself, over the last 12 years, what economic developments have occurred to justify this move? I've asked this to a wide range of people the last 3 years and in most cases have been met with silence. I struggle to come up with any positive economic developments. In reality, this run has been fueled by a Federal Reserve who has twice poured unprecedented stimulus into the financial market and Congress who has run perpetual deficits even during years of above average economic growth.
This game cannot go on forever. Every company cannot be a winner. The stock market cannot perpetually grow faster than the overall economy. Debt cannot be used to fund current growth without hurting future growth. Reality (and math) will catch-up to the market. We've seen this before.
When you step back and look at the past 30 years you can see past periods where the market seemingly never went down. You also had the Fed and Congress attempting to prop things up and spend like crazy to prevent any economic slowdowns. At least back in the 90s we truly did have innovations and developments that theoretically could have changed our economic growth rate. Unfortunately, we've seen our growth rate slow from a long-term average of nearly 4% going into the decade to the current long-term average of 3.1%. (This is due mostly to our dual deficits, trade and budget.)
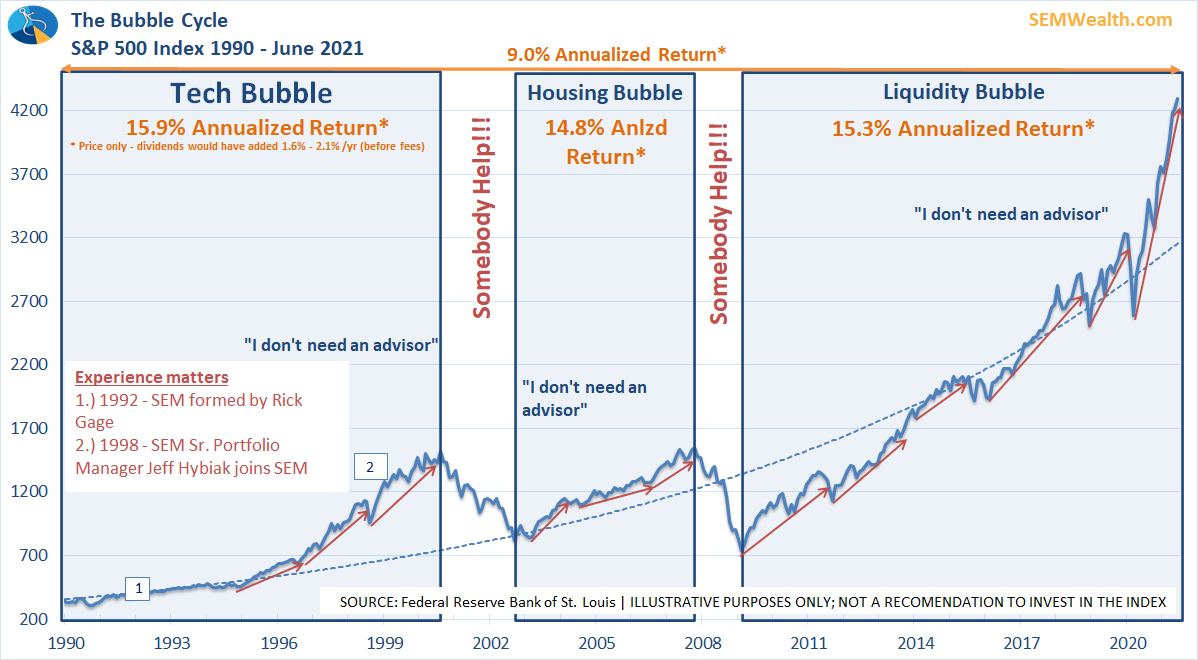
Going back to 1990, the long-term growth rate is 9%. We've seen the market go up 15% per year the last 12 years. Which is more likely – a return to 9% growth or continued 15% growth?
If you believe in the 15% growth story, what is the catalyst? What will happen going forward to allow this to continue?
If you believe the market will revert back to the mean, are you ready for the 35 to 50% drop that could last 18-36 months with 3-7 years of time to recover? That is what a normal bear market looks like. It's when most people make mistakes that impact their financial future.
One of the things you will notice on the chart above is how long we've been doing this. Experience matters. The beauty of working with SEM is you don't have to be right about what the next 3 or 5 or 10 years will look like for the market. While we have our opinions, we let the data dictate how we invest. More importantly, we have a very wide range of investment models designed for various portions of a client's investment portfolio.
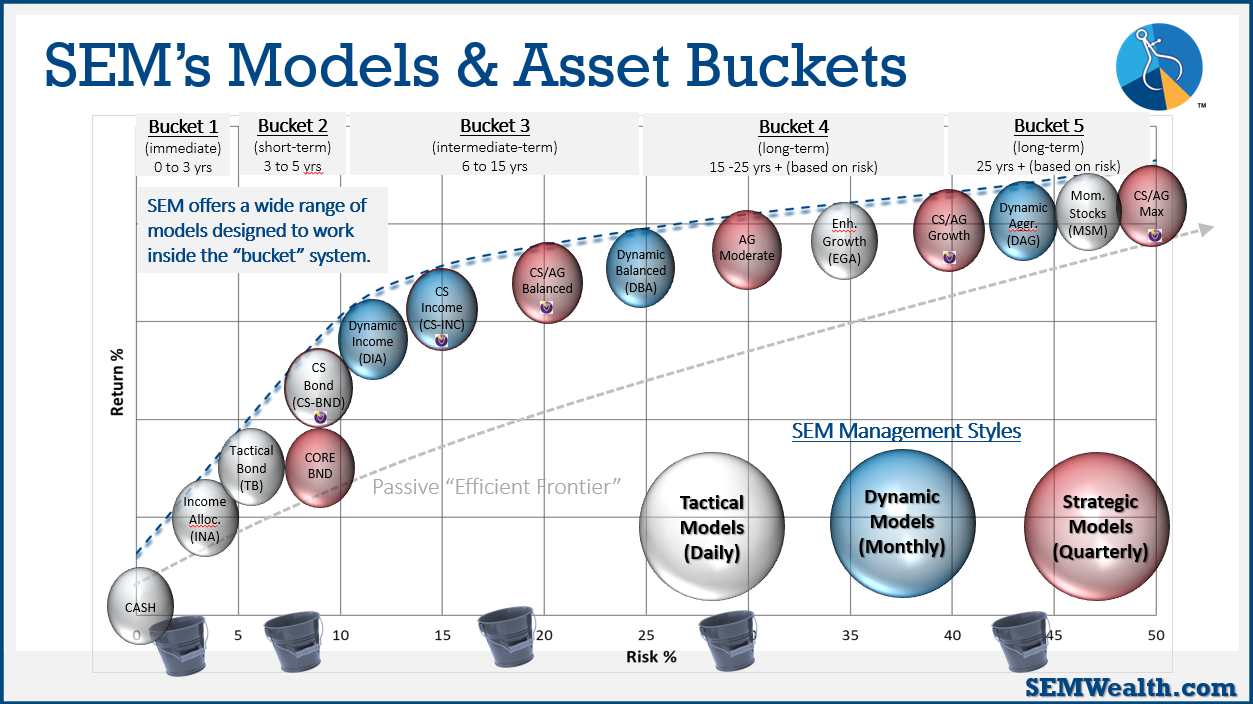
If the market keeps marching at a 15% annualized rate, those models off to the right should participate. If we go into a sharp correction, those models off to the left should significantly reduce the overall risk in the portfolio. Every client and situation is different. Chances are we have a solution for you.


