
I often tell people the thing that causes the NEXT market correction is rarely something any of us predicted. There are usually outside forces that can impact the markets. Often it is the REACTION to the EXPECTED event that causes collateral damage. It's far too early to look into the long-term impacts of Russia's invasion of Ukraine, but my 25 years of experience tells me there will be impacts we haven't yet thought about. At this point, the best thing we can do is pray for a quick end.
In the whole scheme of things, we are sitting at the same point as last week. I found myself much more pessimistic over the weekend about this conflict ending quickly without too much collateral damage. I grew more and more upset and angry as the week went on that something like this is still happening in our world. From an investment management standpoint this makes our quantitative approach that much more valuable as my emotions and opinions about the conflict do not factor into any decisions we make. With that, this week's talking points are essentially the same as last week's. Below the talking points are some details on the latest economic data points, how they impacted our models, and most importantly how our models are positioned as we start the week.
Weekly Talking Points
- Nobody knows what will happen or what the impact will be on the economy, the markets, and the world. Avoid taking advice from anybody who says otherwise.
- The worst-case scenario is this spirals out of control. Russia has proven they cannot be trusted. We have already seen China directly supporting Russia. They have their own territorial desires. I'm no doomsayer, but the worst-case scenario is very ugly. Because of this I would remain cautious in taking on large amounts of risk unless your portfolio didn't have enough risk exposure going into the year. If the economic sanctions put too much strain on Putin we could see an even more irrational plan emerge. A study of history tells us a country feeling economic pressure will act irrationally.
- The best-case scenario is this goes away quickly. That would put us back to where we were at to start the year. Stocks are overvalued, inflation is running rampant, the Fed is going to be forced to hike rates and pull back stimulus, Congress won't add any more stimulus this year, and the economy will be left standing on its own (see discussion below). Because of this I would remain cautious in taking on large amounts of risk unless your portfolio didn't have enough risk exposure going into the year.
- MANY people's portfolios were significantly overweight stocks going into the year. This was either because they have not rebalanced back to their target asset allocation or worse, chose to jump into stocks late in 2021 simply because they wanted higher returns. Any bounce should be used as an opportunity to reduce risk in your portfolio. Even the best-case scenario is not too attractive for stocks over the shorter-term.
- SEM's lowest risk allocations have very little exposure at this time. They started reducing exposure in January and with the AmeriGuard/Cornerstone trend sell signal two weeks ago along with the second sell signal today (more below), the downside in these portfolios is reduced significantly. The clients in these portfolios are usually the most risk-averse clients we have, so we understand they may be concerned about what is happening in the Ukraine. Our message to anybody in these lower risk allocations is simple – we already took action and are now in the comfortable position of being able to add risk at much lower levels whenever things stabilize.
The primary message is this – unless your financial plan or cash flow strategy has changed in the past 10 weeks you shouldn't be looking to change your allocation UNLESS you were in the group who ended up with too much stock exposure (because you haven't rebalanced your portfolio in a few years and/or wanted to generate higher returns.)
Markets move in cycles. When you are in the middle of the cycle it can seem a lot worse than when it's over. Stay calm. Stick to your plan. If you want a review of your portfolio, take our risk questionnaire.
Even though it's tough given what is happening in Ukraine, we do need to focus on what's happening in our markets and economy. Here's the latest data points and what they mean for our portfolios.
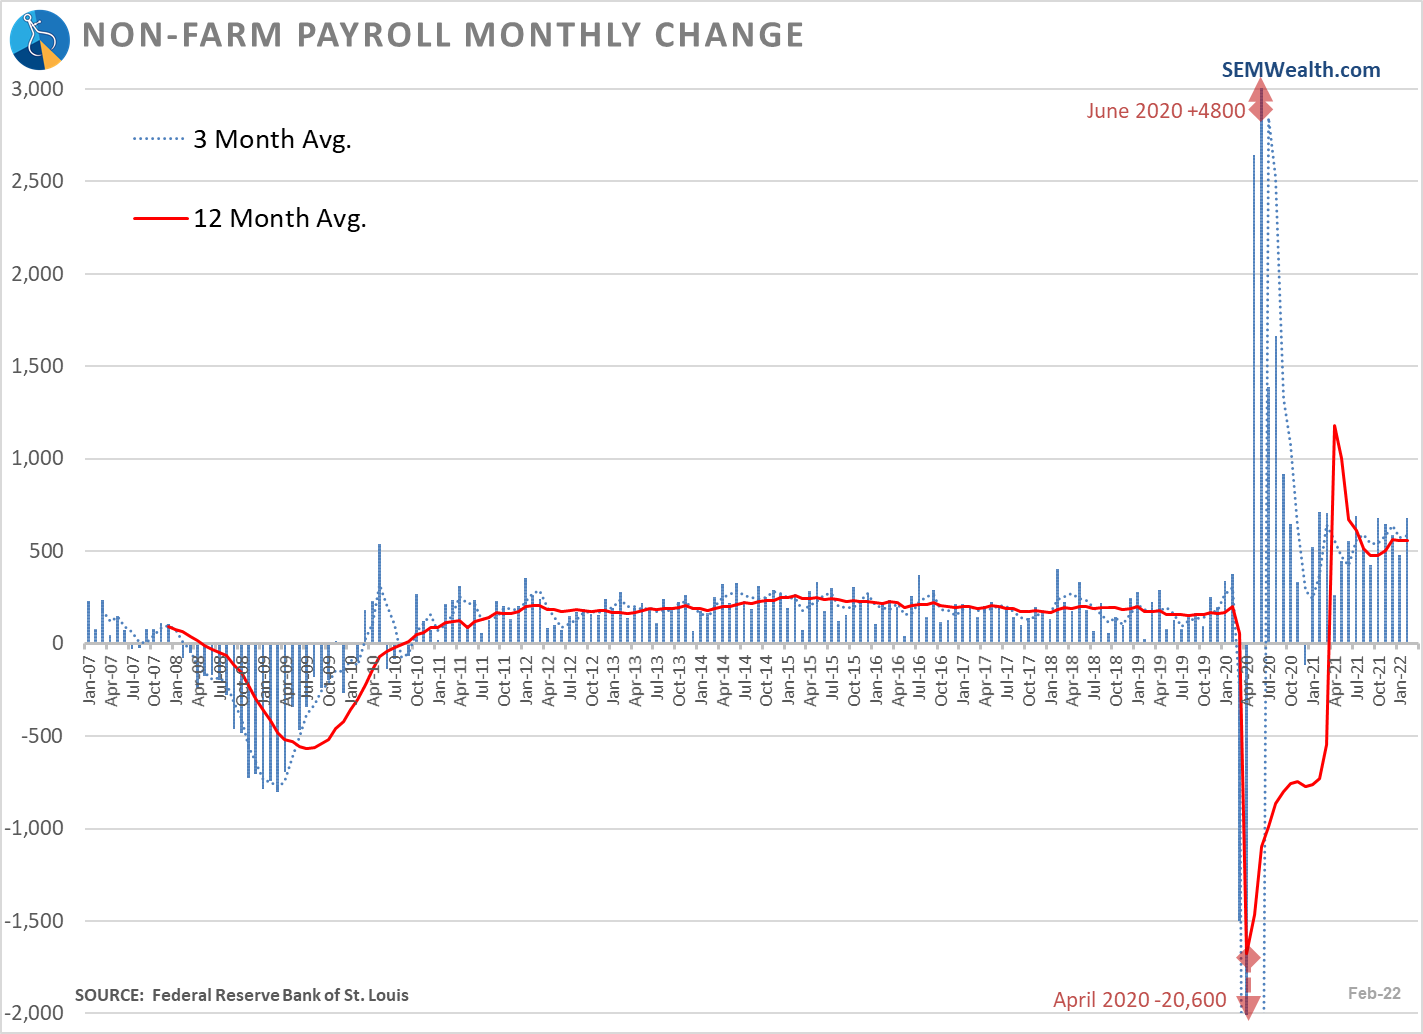
Strong Payroll Numbers Continue
Job "creation" has continued at a healthy pace.
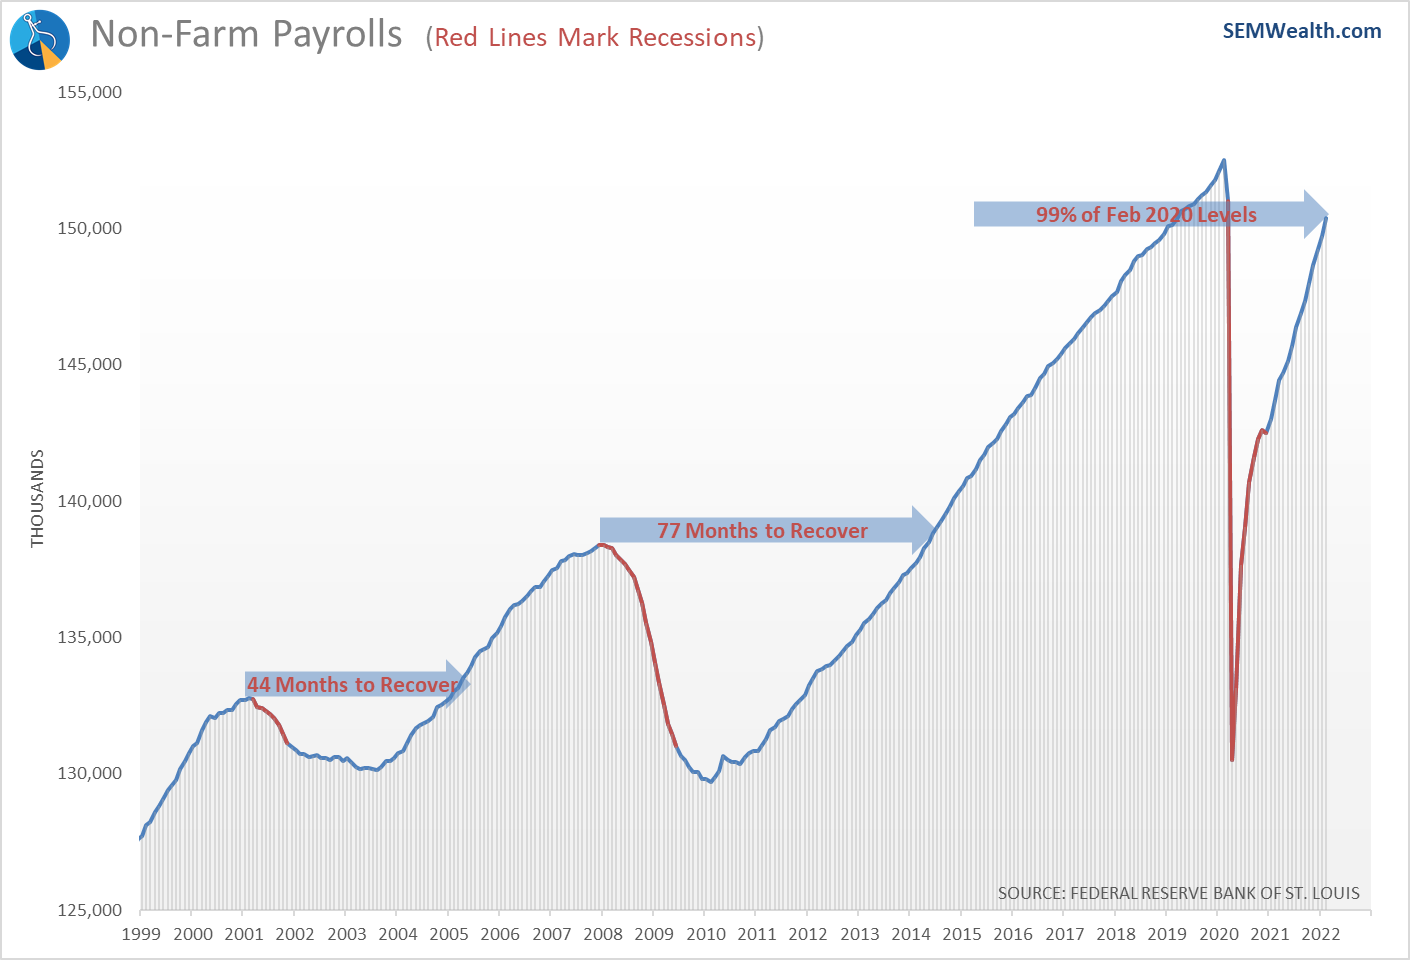
We've nearly recovered all of the jobs lost during the pandemic. This recovery has been much more rapid than the last two recessions.
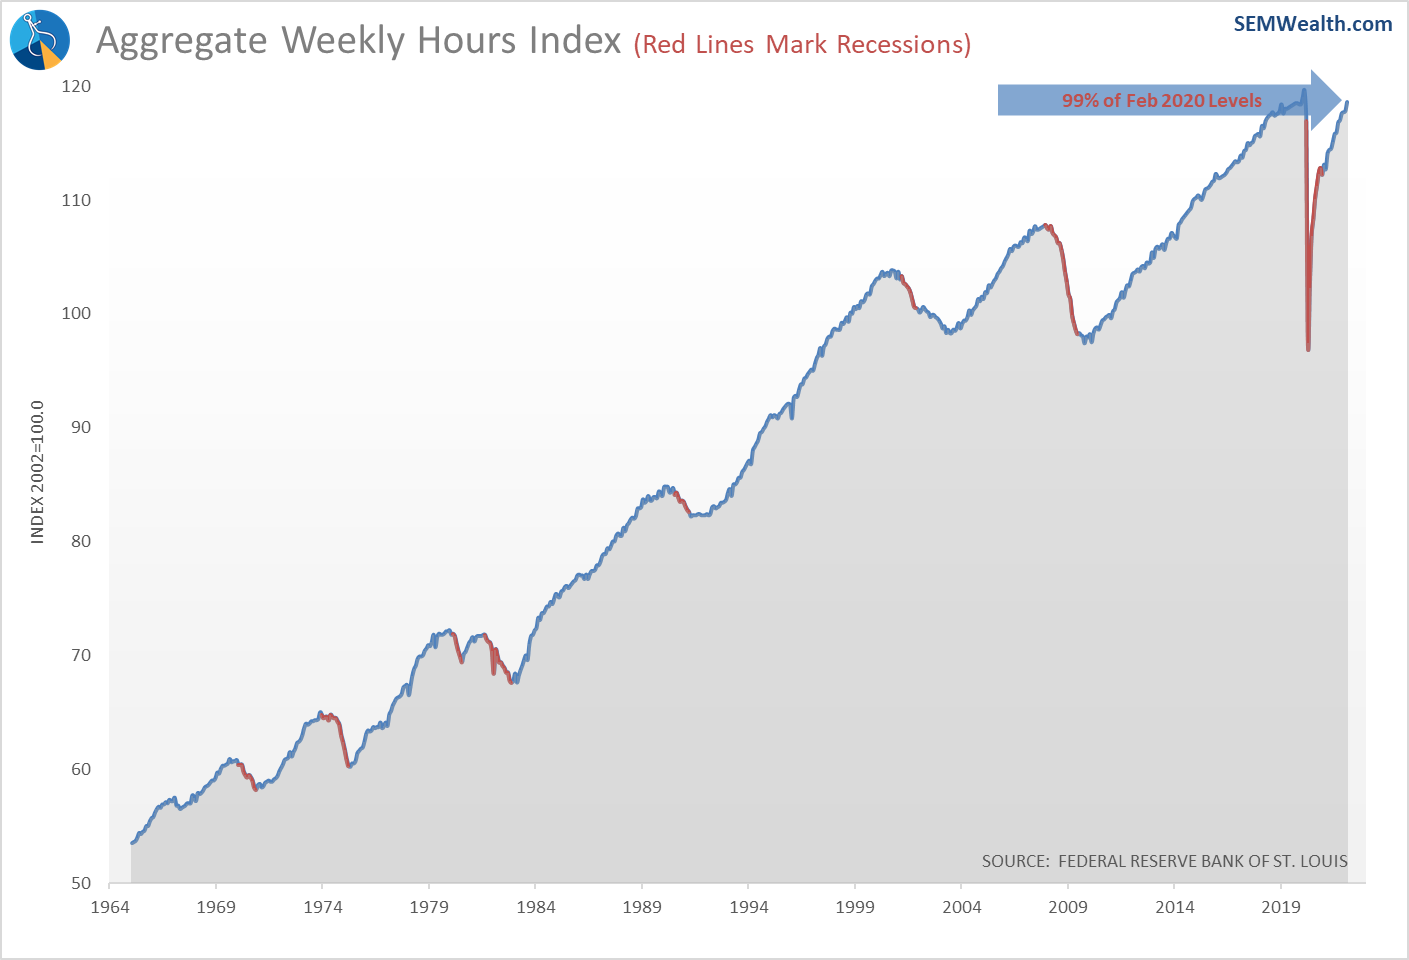
The number of hours worked has also nearly recovered the losses during the pandemic. This is a positive sign.
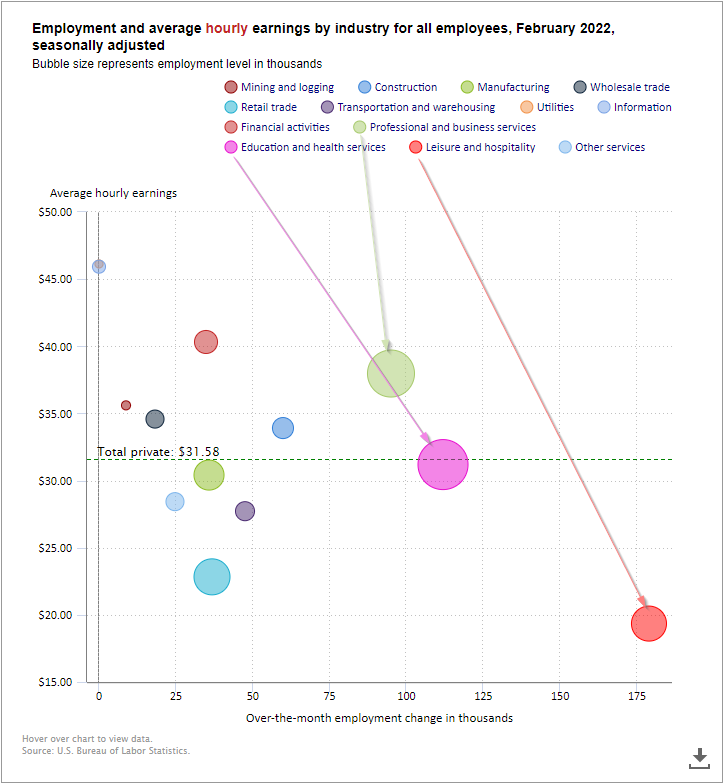
As has often been the case throughout the recovery (and during the last expansion), the highest number of jobs came from the lowest paying sector – leisure and hospitality. Education & health services, and professional and business services did post some nice gains as well.
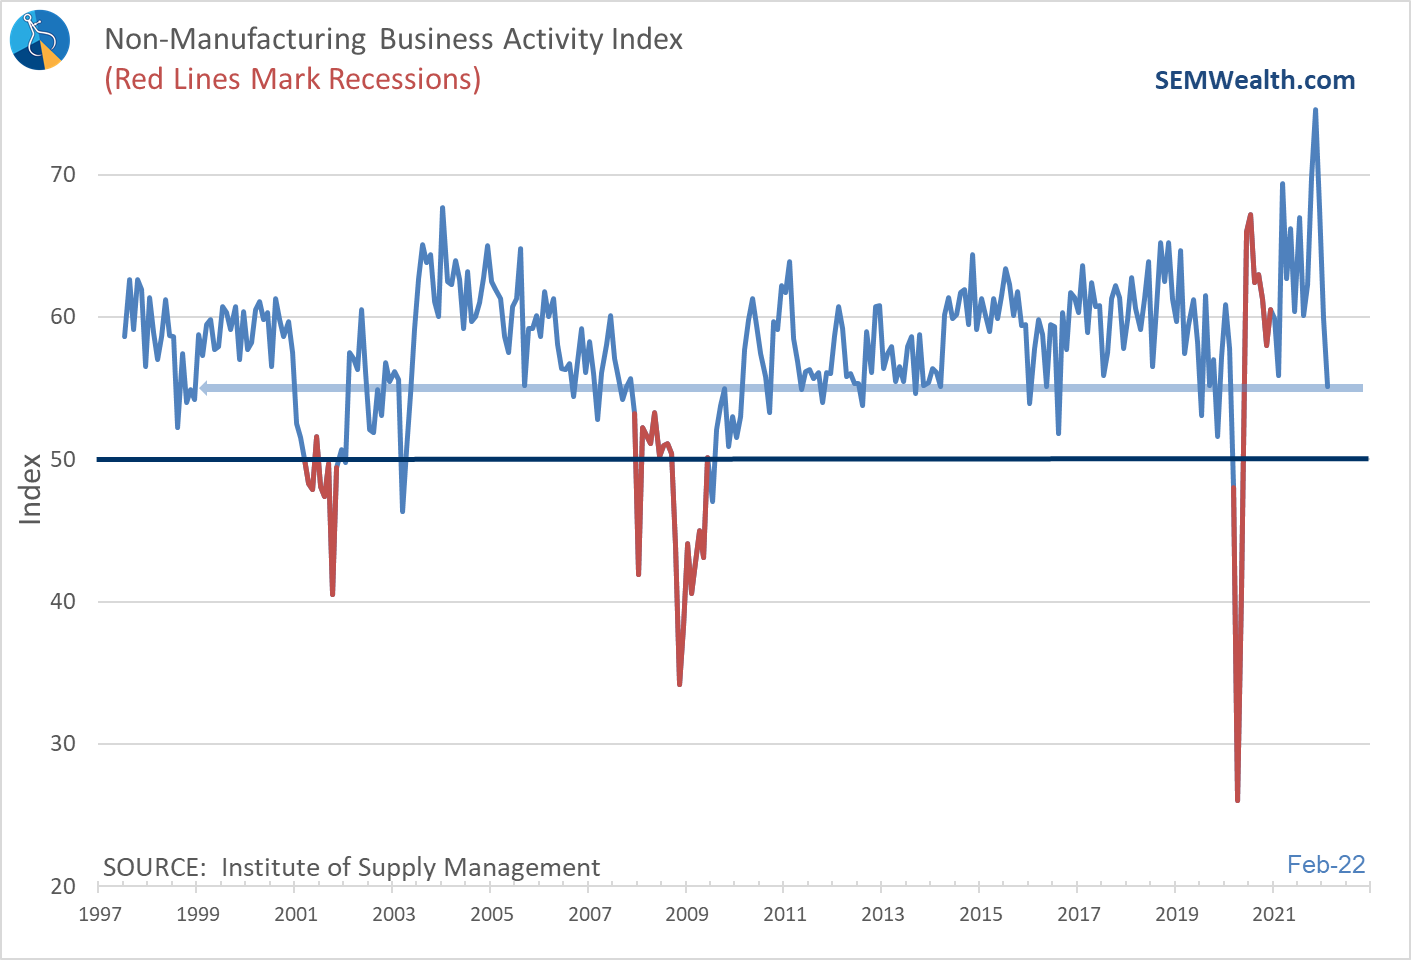
Service Sector is Slowing
The problem with these service type jobs is they are "easy-come-easy-go". This brings me to my next point. Over the last 30 years our economy has been driven by services (rather than manufacturing). This segment was obviously hit hardest during the pandemic but came roaring back as the economy reopened. It has been slowing recently and last month posted the lowest reading since the recession ended. This is something worth watching.
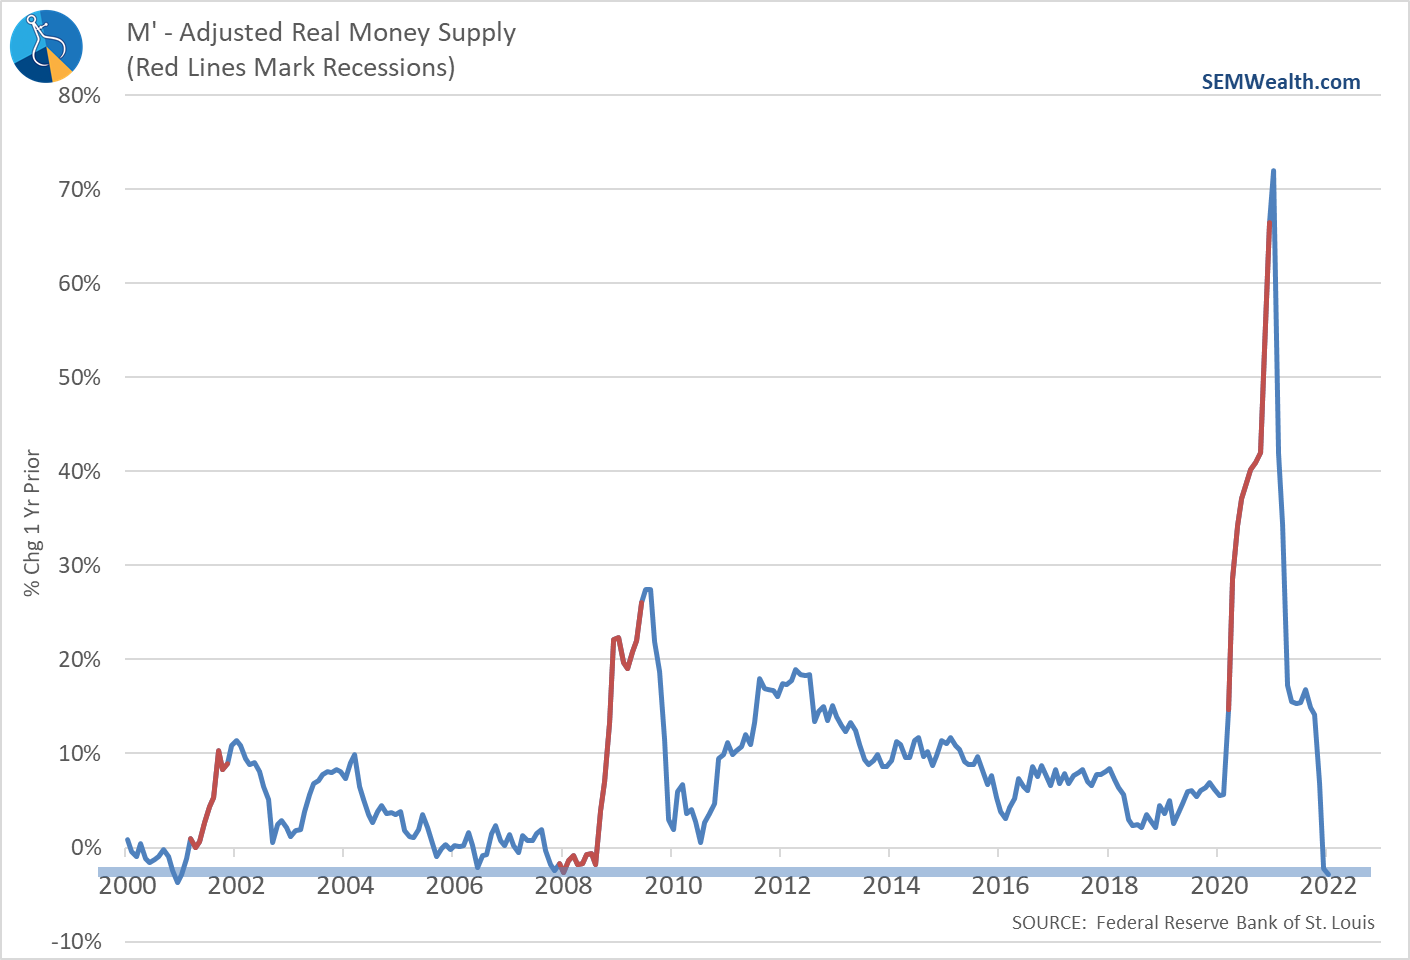
What about the Fed?
The real question is what this means for the Fed. One interesting data point – even though the Fed has yet to raise interest rates and continues to create new money via their Quantitative Easing program, the growth in money supply has turned negative. This is the first time since 2007-2008 we witnessed this and is a sign of economic stress.
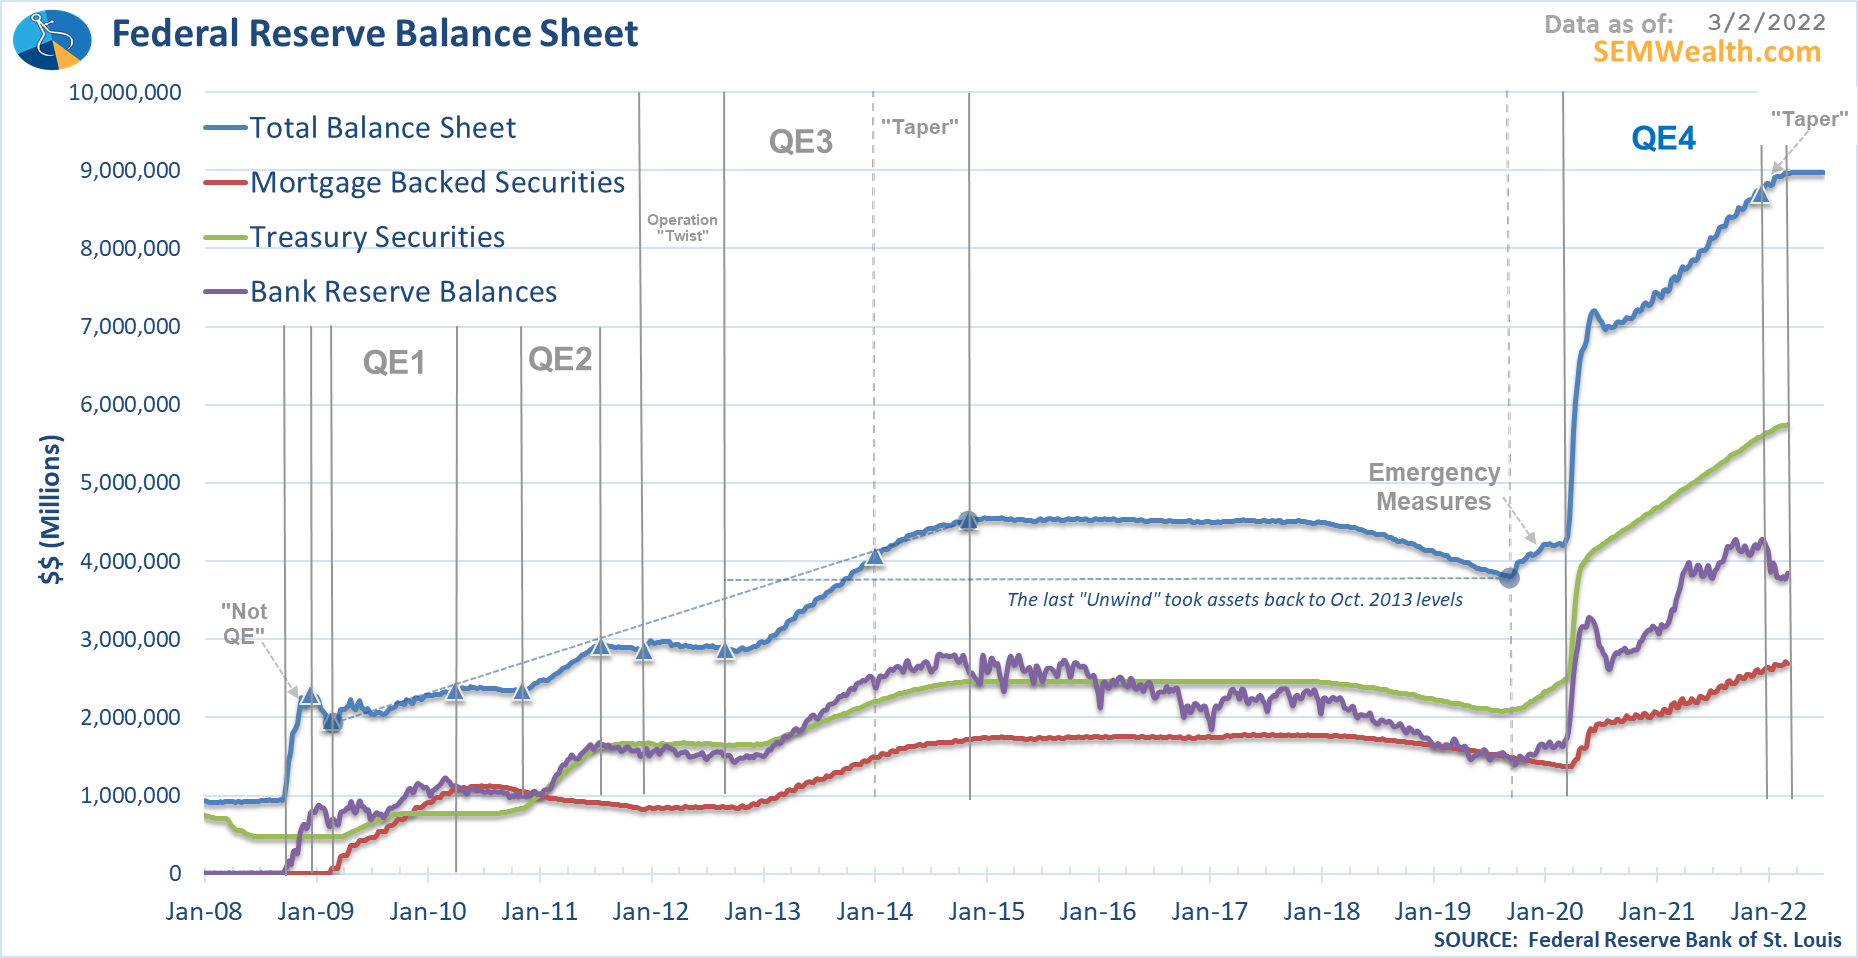
Looking at the Fed's balance sheet, we can see the drop in reserve balances since taper started (the purple line). It will be interesting to watch what happens when the Fed actually starts pulling back their unprecedented stimulus.
What is 'normal' growth?
From a bigger picture perspective, I think this chart is interesting. It shows GDP going back to the beginning of 2016. This includes the "Trump Tax Cuts" as well as the $5 Trillion+ of stimulus in 2020 and 2021. With all of that we are simply back on trend; a trend which was running 1% below the long-term average.
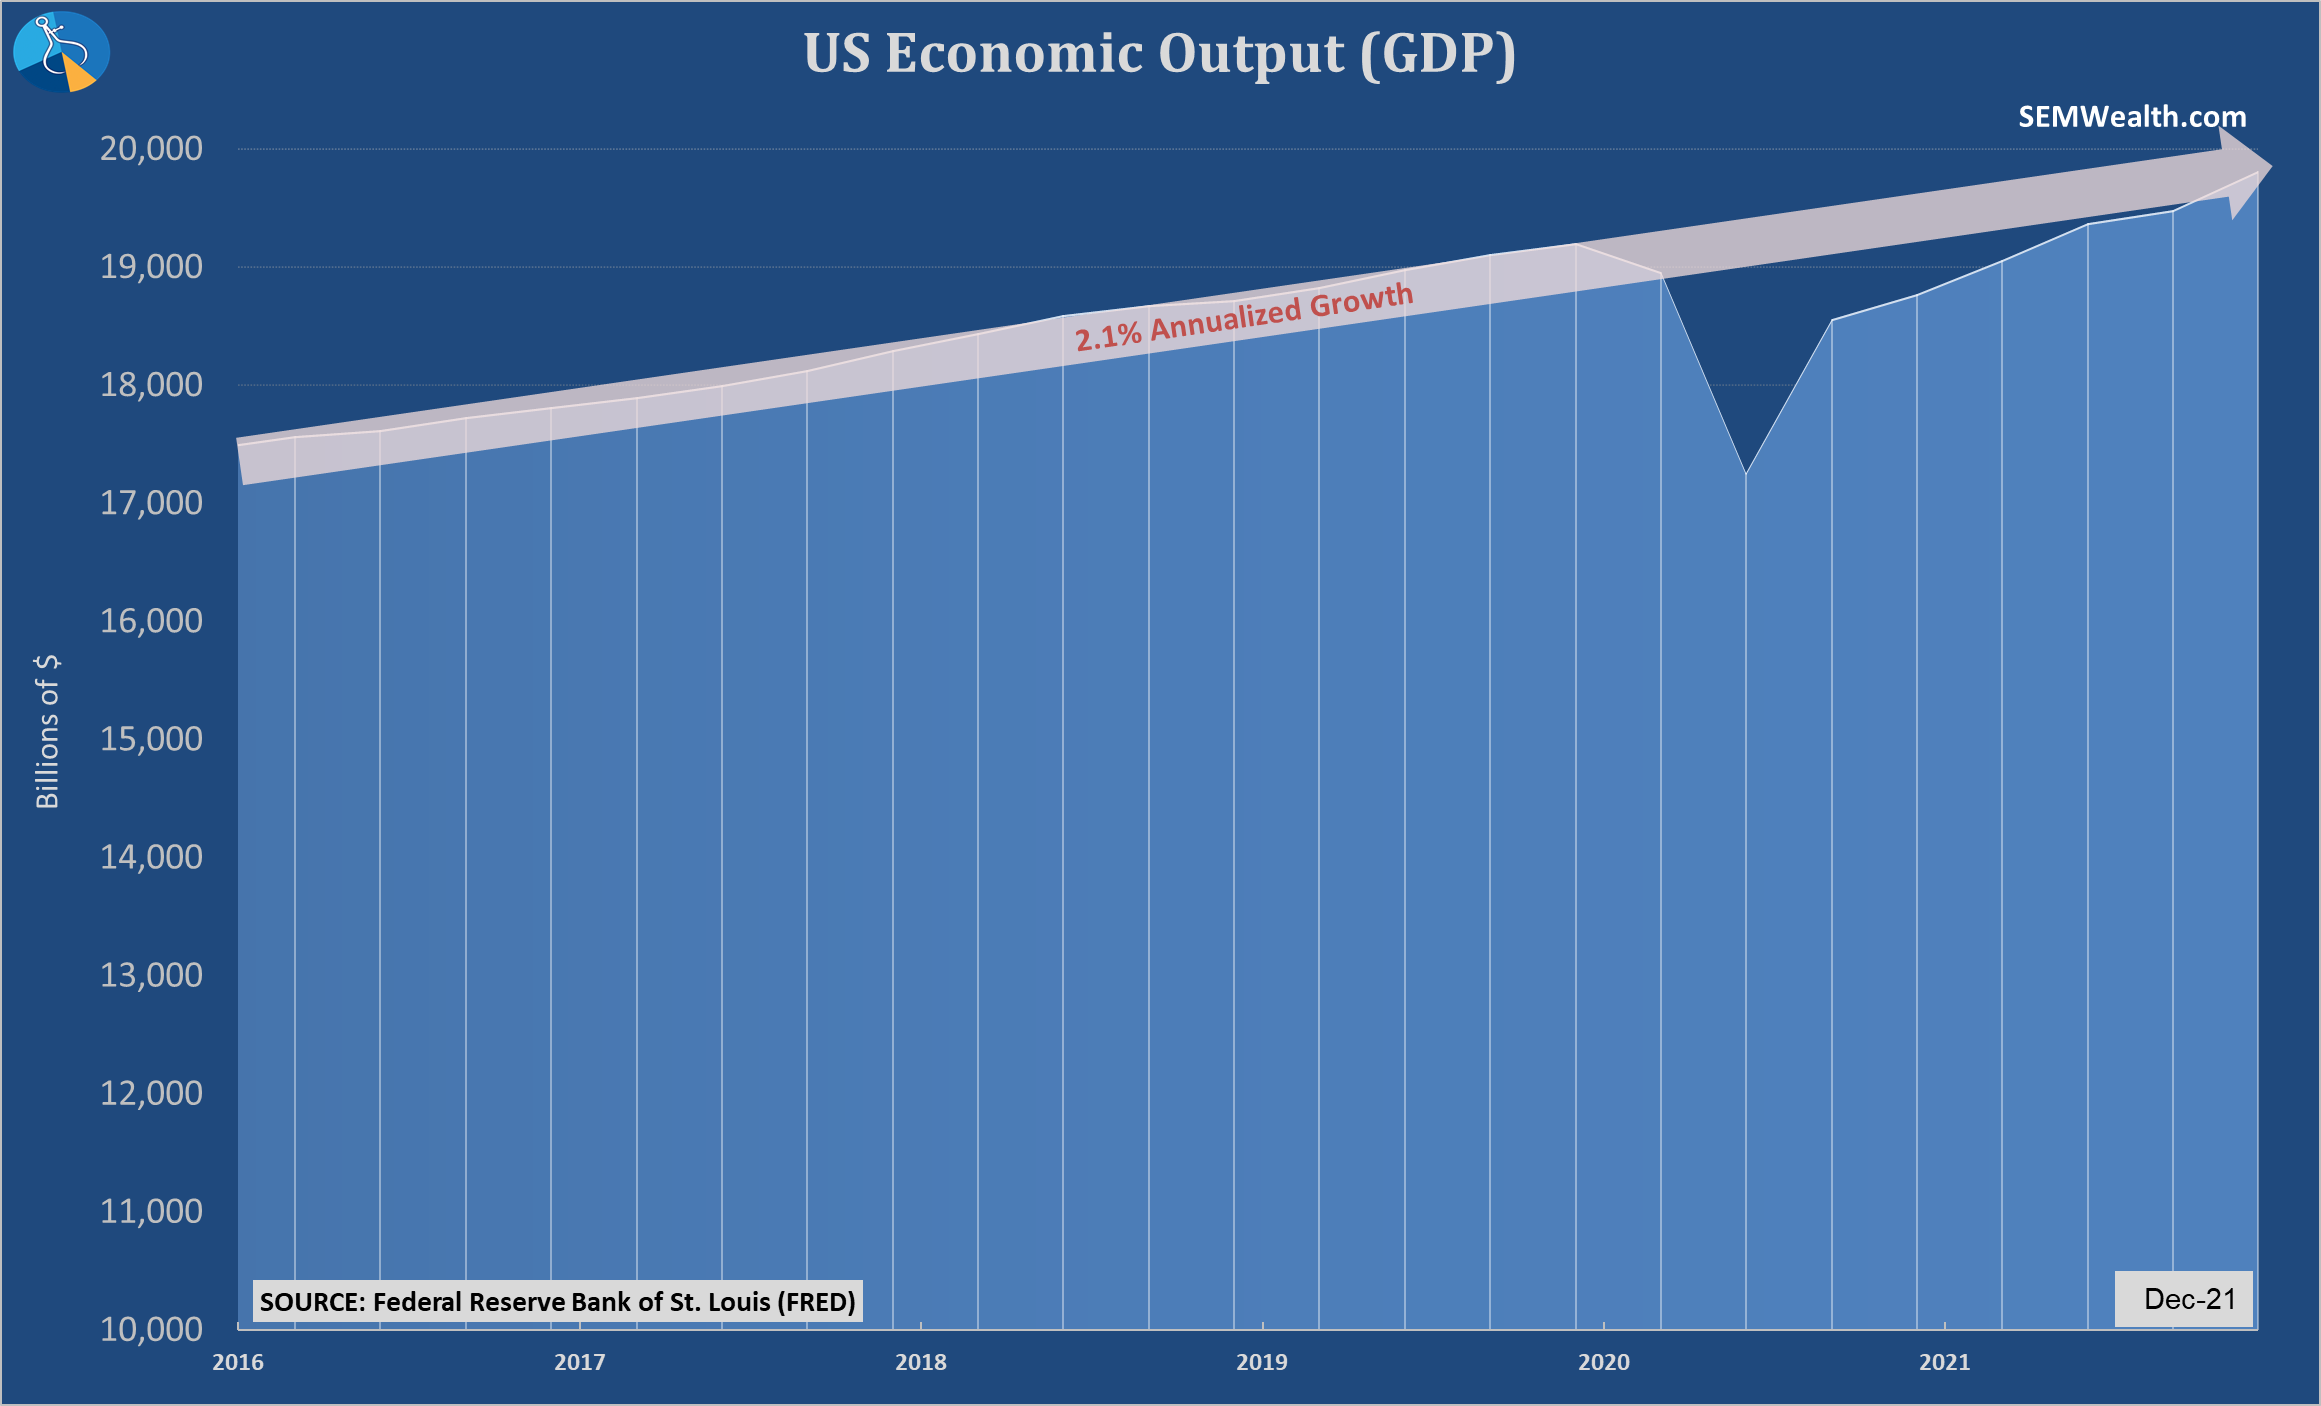
Right now, everyone is hyper-focused on inflation, but my opinion remains this is very short-sighted as there are STRUCTURAL things which need to be addressed that caused us to run below-trend for this entire century. It's too early to tell, but some of those STRUCTURAL things have been accelerated, such as the shift of the Boomer generation from working (producing) to retirement (consuming). Whenever an economy has a surge in retirees, they end up fighting DEFLATION, not inflation (see Japan and Europe).
My subjective guess is by the end of the year we are far more likely to see inflation numbers back below 2% with the economy either already in recession or heading that way. All the pent-up spending on travel and leisure will have been alleviated. We won't see any more stimulus from Congress. The Fed will have been raising rates and reigning in their balance sheet. In other words, the economy will be left to stand on its own.
Data, not opinions
Of course, my opinion doesn't matter. What matters is what our trading systems are saying. Our economic model continues to receive different crosscurrents, so it remains in a "neutral" position. This is always the most difficult and most volatile point of the economic cycle. This is because the large institutions are trying to make sense of conflicting data points and often cause big swings in market prices as they shift their asset allocation based on their opinions.
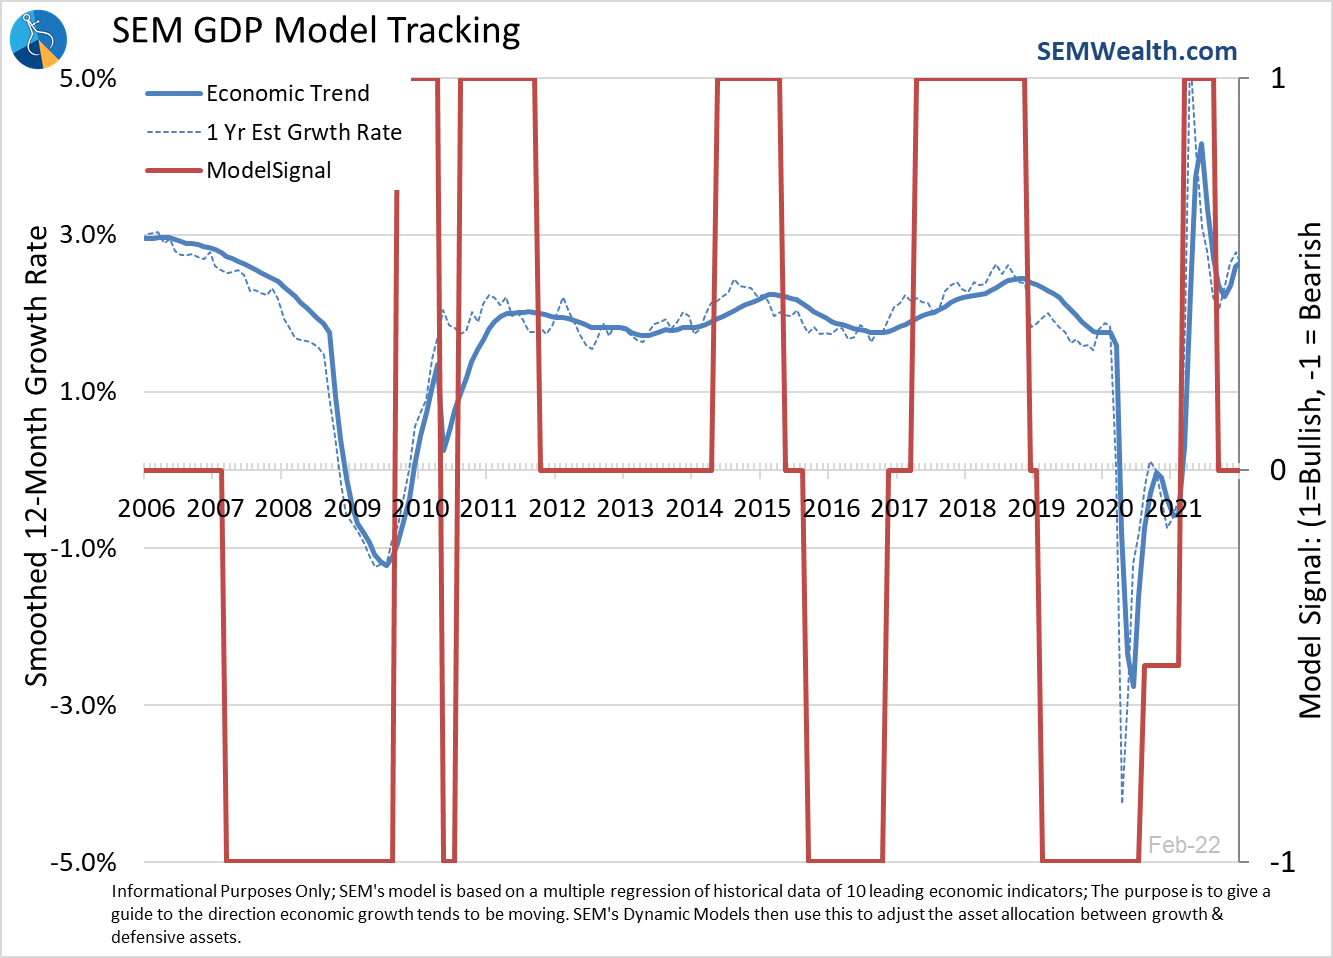
Our Dynamic Models have been in this "neutral" state since the beginning of October. This meant reducing our exposure to dividend stocks by half on the income side and cutting our small cap stock exposure by half on the aggressive side. We haven't experienced any real benefit (yet) from this signal. The S&P 500 was at 4320 on the day we reduced exposure. It then rallied all the way up to 4800 by the start of January, and then fell to 4280 on the close of February 24. The purpose of the economic model is to give us a guide of where the economy is likely heading. Right now, it is a big shoulder shrug.
Another Important Week for Stocks (and Bonds)
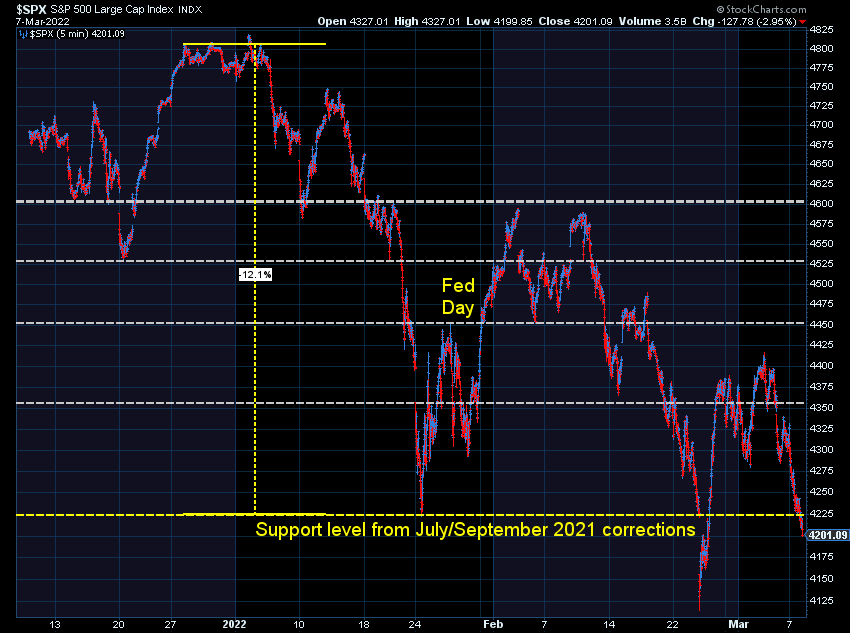
The S&P 500 continues to trade in a large range. This 5-minute chart illustrates the swings we've been going through since January. It's important to not take any move seriously. Both corrections and bottoms are a PROCESS not an event. This means we will see many false moves before it is all over. Our indicators are clearly saying this is more likely to be a severe correction rather than a short, tradable sell-off. They can be wrong, but it is worth noting. If they are correct, every rally should be used for investors who have too much risk to lighten up on their stock exposure. From a technical perspective, we could see rally attempts around 4240 to 4275. Below that, the lows from Thursday the 24th around 4125 will be critical as there isn't much "support" underneath that level.
On the bond side, the moves the last three days of last week were jaw-dropping. I don't remember seeing bond yields move that much in 3 consecutive days on essentially no news. There is clearly some large institutions moving big amounts of money around. When Treasury bonds move as much or more than stocks, it is usually best to not attempt to trade these vehicles, which is exactly what our trading systems are doing. Dynamic Income sold Treasuries last Wednesday and left the proceeds in cash. AmeriGuard/Cornerstone the prior week left the proceeds from the reduction of stock exposure in cash.
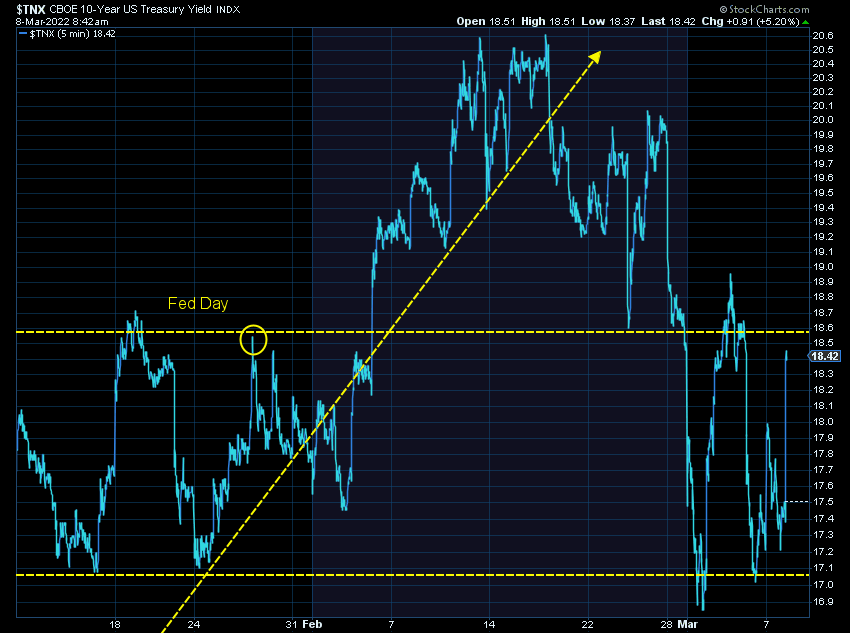
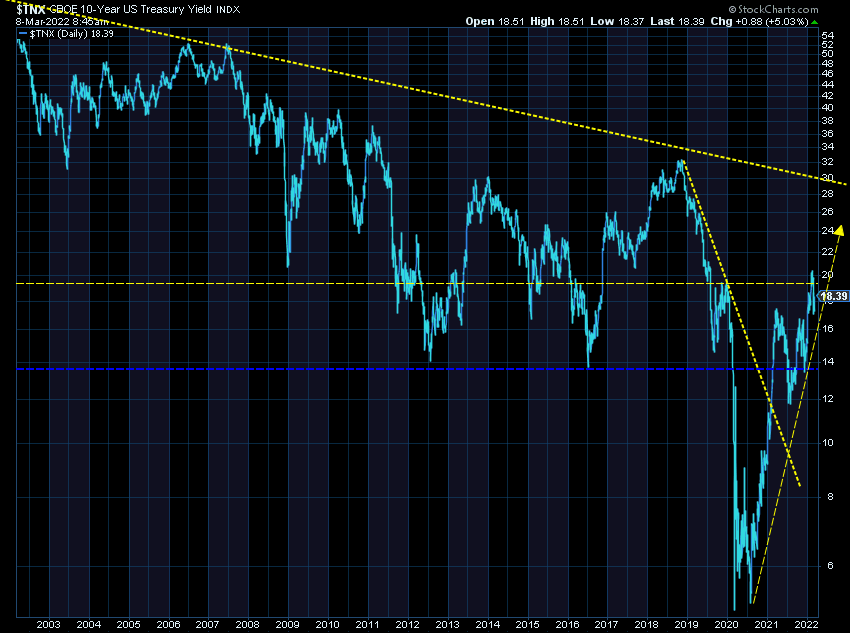
Technically the trend in yields is still up over the intermediate term and down over the very long-term, which adds even more confusion to those trying to figure out what the next move is in long-term bonds.
A Time-Tested Plan
SEM is paid to watch over the investments for our advisors and clients every day. There are plenty of times this may seem unnecessary, but during a crisis, the value of our data-driven approach becomes clear. We've been around for 30 years and see the same pattern play out over and over again. While the circumstances behind the corrections are always different, the way our systems and models react typically is the same.
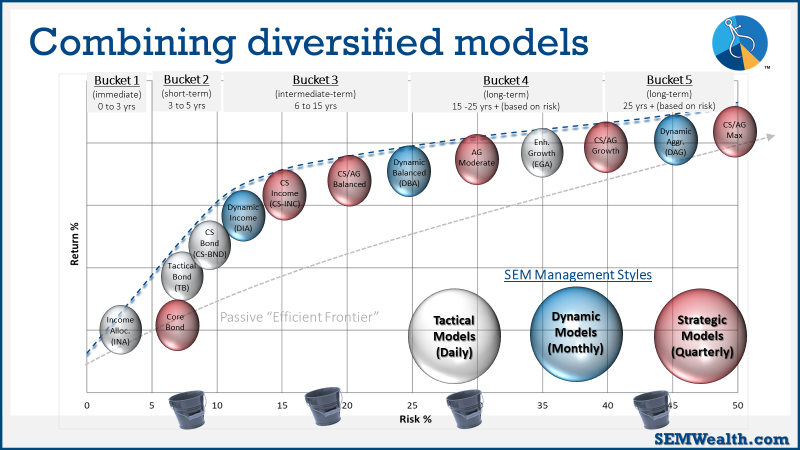
Remember, unlike any other investment manager out there, we offered a truly diversified approach. We have 3 distinct management styles which can be used to create customized investment portfolios. We typically recommend to all clients that they have investments in all 3 of the styles. We then will pull models from all three styles to meet the needs of the financial plan, cash flow strategy, investment objectives, and investment personality. Here is where each of those models fall on the return/risk spectrum.
Here is what we've done thus far:
- October 1: Economic model moves from "bullish" to "neutral". Dynamic Income Allocation (DIA) (and Cornerstone-Income) sells half of dividend stock exposure. Dynamic Aggressive Growth (DAG) sells half of small cap exposure. Bonds are added in place of these positions. As mentioned above, the model remains in "neutral", which is the most volatile part of the cycle.
- January 3: AmeriGuard & Cornerstone Balanced & Growth core positions eliminated small cap growth and added Large Cap Value.
- January 10: First sell signal in High Yield Bond system, reducing exposure by 1/4 in Tactical Bond (TB).
- January 19: Second sell signal in High Yield Bonds, reducing exposure in TB, Tax Advantaged Bond (TAB), and Income Allocator (INA).
- January 24: Third and fourth (final) sell signals in High Yield Bonds, reducing exposure in TB, INA, and Cornerstone-Bond (CS-BND). This puts TB & CS-BND in fully "risk-off" positions.
- January 31: INA sells last high yield bond position, placing this model fully in "risk-off" mode.
- February 22 (two days before Russia invaded Ukraine): First trend indicator triggers in AmeriGuard & Cornerstone Balanced & Growth models, cutting stock exposure to half of the target range (Balanced now at 50% stock, Growth at 85%).
- March 7: Second trend indicator triggers in AmeriGuard & Cornerstone Balanced & Growth models, cutting exposure to minimum of the target range (Balanced now at 30%, Growth at 70%).
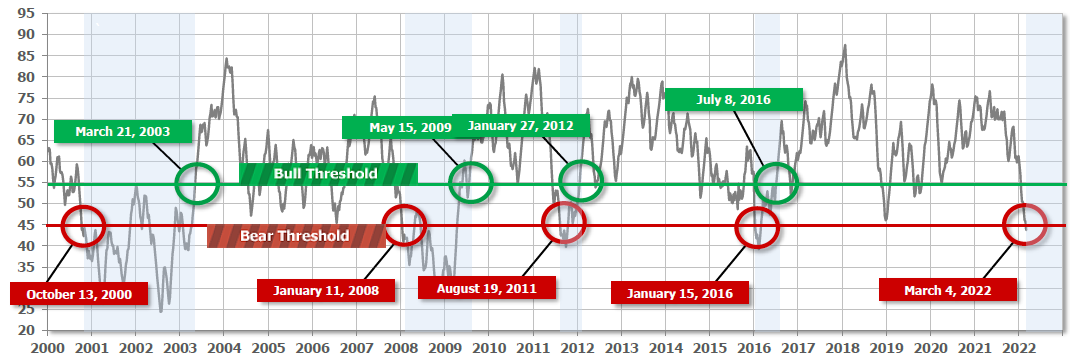
What is interesting about this last trigger is this model did not even trigger during the COVID sell-off in March 2020. The chart below shows the actual signals for this indicator. Not all signals are correct, but it has been a good "last line of defense" for our systems. Like the first trend indicator, it can quickly get back in if the market were to suddenly reverse. Historically, though this indicator is designed to not move to a sell unless there has been widespread technical damage done to the markets.
No guessing
The main point of all of this is we have a plan no matter what happens next. Going into the year we didn't imagine Russia would do what it is doing to Ukraine, but we knew how our systems would react. We don't know how it will end, what the collateral damage will be, or how the rest of the world will respond. That said, we have a plan to get back in should the risk in the markets suddenly disappear. If you cannot say that, whether you're an investor or an advisor, we need to talk. Hit me up via our "Contact" page.


