
A year ago the title of that week's musings was "What can go wrong?" In it I identified the 4 pillars of the amazing stock market rally: Federal Reserve Support, Congressional Spending, Improving Economy, and the decline of COVID. I followed that with a list of things that could go wrong: Valuations were/are at or above the peak tech bubble levels, the underlying economy was weak, & the use of debt to spend instead of invest would end up hurting growth.
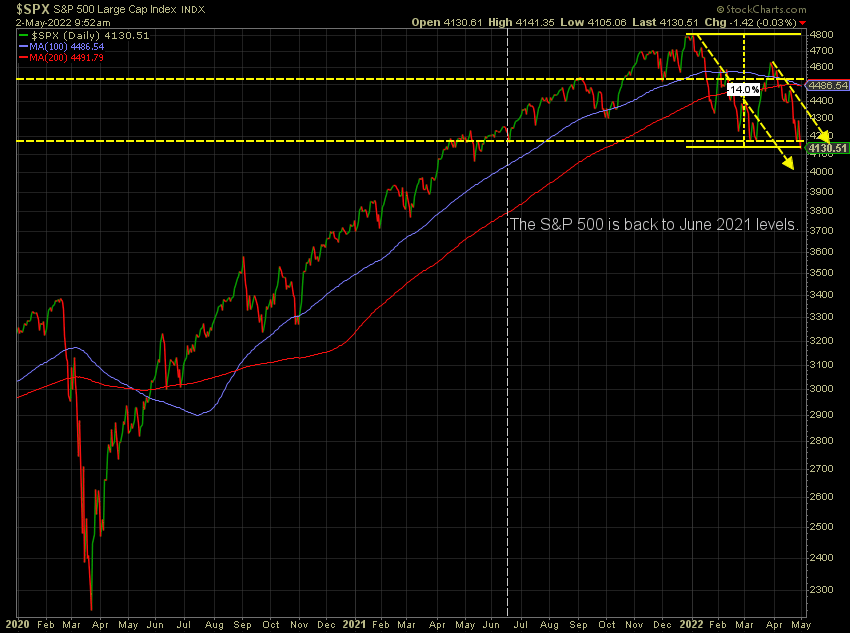
Other than the decline of COVID, all 4 of the pillars of the rally have been knocked down. You can even argue the surge in COVID cases in China also negates that pillar. When you combine that with high valuations, a weak underlying economy, and the ridiculous growth of debt to fight the pandemic, the 14% drop from the highs for the S&P 500 makes sense.
A year ago nearly everyone I talked to thought investing was fun and easy. I warned that the last time it was this fun and easy was late 1999.
This of course was not a surprise to followers of this blog. Last week I listed the theme from every week in 2022. In case you missed it, you can check it out here:
 Jeff Hybiak, CFA
Weekly Talking Points
- Inflation is likely nearing a peak, but the long-term impact on growth is likely to be a drag for the next 9-12 months. The real risk is a.) prolonged inflation and b.) how much growth slows over time.
- The economy is going to be forced to stand on its own (Fed is pulling back stimulus and no hope for stimulus checks from Congress), which increases the chance of a recession in late 2022/early 2023. On average the stock market loses 35-50% just before and during a recession. (The stock market is only down 14% so far.)
- In the short-term, euphoria could drive stocks higher. When markets go down this fast, it typically will have a big snapback rally. This should NOT be used as proof that all of the issues which caused the sell-0ff have been resolved. This should instead be used as an opportunity to reduce risk for investors with a time horizon of less than 10 years and/or those who jumped into stocks in 2021 simply to "make more money".
- Your investments should align with your financial plan, cash flow strategy, investment objectives, risk tolerance, and overall investment personality. If you are already in alignment with those items, SEM's models have already taken the steps to adjust to what could be a very difficult environment.
- Even with SEM's models, the expectation should be for lower returns until the still euphoric market prices adjust to the reality of lower growth ahead. Our goal during these times is to lose as little as possible within each model's mandate, so we can pounce when it is easier. Remember, when it feels the worst will be the point of maximum opportunity. Our data-driven models are designed to invest when it feels the worst and to act well before most investors are even aware a bottom has been put in.
Minus 6-8 weeks during the early days of the pandemic, investing has been very easy the last 10 years. With a sell-off so fast in 2020, it didn't leave much time for investors to adjust their asset allocations, especially in their employer retirement plans. A true bear market sees the market lose 35-50% of its value with the decline taking 18-24 months. The market then spends the next 5-7 years (on average) making up those losses to get back to where you started. That wears on you emotionally. An 8 week sell-off does not.
Bonds aren't helping
Probably the biggest surprise to many investors is the fact bonds are not providing the buffer they have been accustomed to. A "balanced" portfolio in 2020 saw their bond positions rally while stocks fell. This happened in all of the past bear markets this century.
This time around, bonds, as measured by the Aggregate Bond Index, are down 10% for the year. We've seen yields on 10-year bonds jump from 1.35% in December to nearly 3% today. Keep in mind, the Federal reserve has only raised rates 0.25% so far. The Fed sets short-term rates, the free market sets long-term rates.
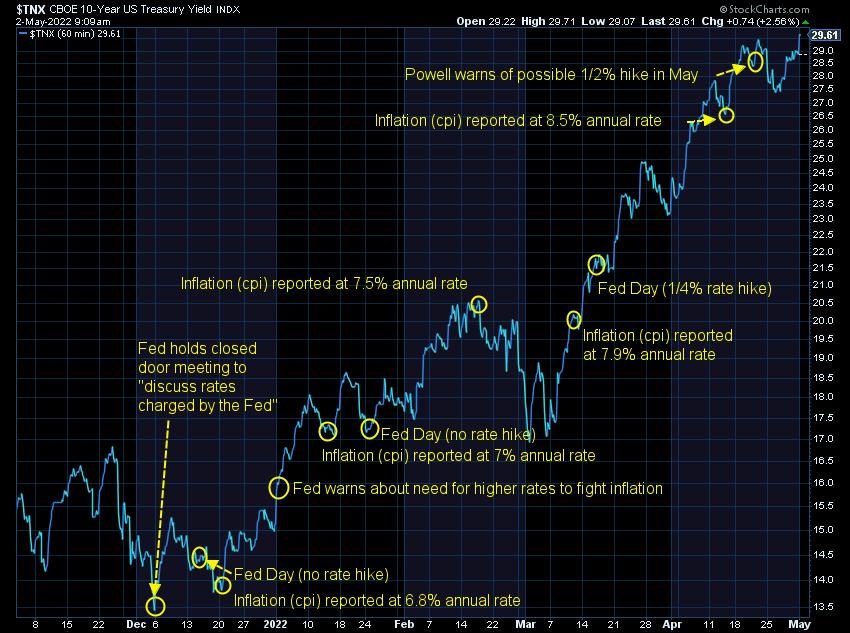
The free market has been saying inflation is a problem and rates needed to move higher. The move up started when the Fed held a "closed door" meeting back on December 6. Why in the world the Fed continues to wait to fight inflation is beyond me. They should have been hiking rates a year ago when the last stimulus checks started going out.
Long-term, we are reaching a critical level in rates. This chart shows the 40-year downtrend line in rates (or data agreement only allows me to show a 20-year chart.) We are getting precariously close to violating that trend line. We are also getting close to the 2019 peak in rates around 3.25%.
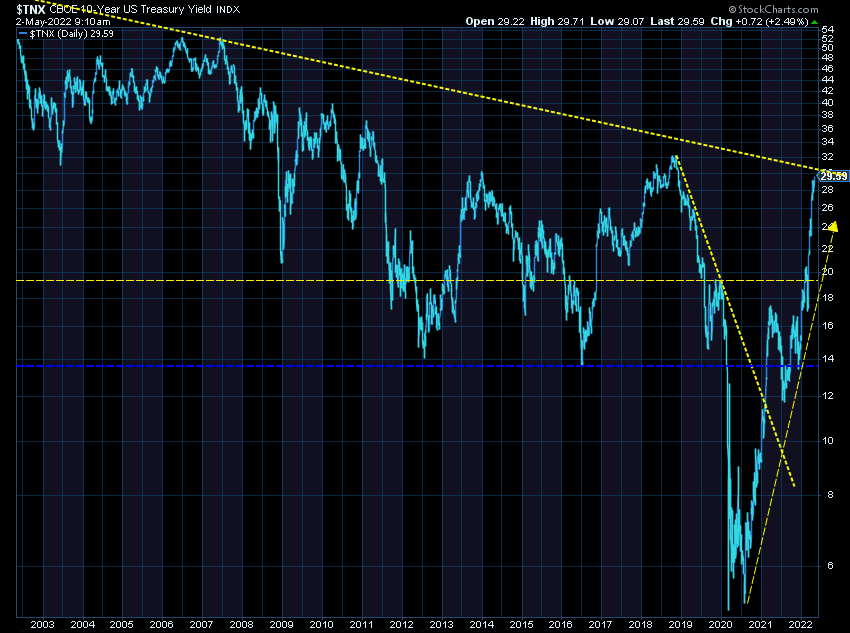
Subjectively, I believe once the free market sees the Fed finally getting serious about inflation, we will see long-term treasury yields fall (eventually). Thankfully, we don't invest based on my feelings, but instead follow the data.
SEM Bond Market Exposure/Plan
We've already taken significant actions to lower the risk for our models which utilize fixed income investments. Remember, the bond market is down 10% (so far) in 2022.
- Cornerstone Bond/Income Allocator/Tactical Bond/Tax Advantaged Bond/Mastermind Portfolio: Eliminated all high yield bonds the first week of February and have primarily been using shorter-term bonds and money market/cash positions. Most of the 3% loss in 2022 came the first 5 weeks of the year. We have seen smaller losses accumulate simply because every bond market category has been falling, even the lowest risk ones. As they have done historically, these models will wait patiently for better opportunities, which could be significant. The most important thing to understand is these models have already taken off the bulk of the risk in the bond market and will wait for the volatility to calm down.
- Cornerstone Income/Dynamic Income: With the "bearish" economic signal the beginning of April, we eliminated all dividend stocks. The remaining investments are in outside tactical fixed income managers (who have essentially done what SEM has done so far this year) and an "inverse" Treasury Bond position. This investment makes money when yields go up and will lose money when yields go down. It is a trend following system so can flip to a "long" Treasury Bond position. The tactical managers typically follow what SEM has done in the bullet point above. Out of all of our models, these two have the biggest opportunity to make money if the downtrend in yields continues, but that also means they are a higher risk investment than the tactical bond models in the first bullet point.
- AmeriGuard / Cornerstone Balanced & Growth: Last week the bond model inside of these systems, which holds the non-stock investments, issued a "sell" signal. This means instead of being invested in bonds, the money will remain in cash until one of the major bond categories reverses to an uptrend.
In summary: we are holding a lot of "cash" or equivalents and waiting for a more stable environment. This may come quickly or could be months down the road. For low risk investors, I continue to challenge you to find a better, more consistent fixed income manager out there. It isn't fun to bleed away 3-5% or to sit in "cash" for a long period of time, but the secret to our success over the past 30 years has been sitting out times when investing in bonds is hard and waiting for it to get easier.
Stocks: Overvalued or Buying Opportunity?
We've been conditioned the last 10 years to buy every dip. This has worked very well. I've always said, "buying the dip works, until it doesn't." We saw this in both 2008 & the 2000-2002 bear markets. When you're in a bear market, buying the first dip can be catastrophic to your long-term returns. The problem is, you don't know if you're in a bear market until well after the fact.
I mentioned a year ago how valuations had reached tech-bubble levels. The PE ratio is not a very good predictor of short-term returns, but it is the most commonly used and understood way to value stocks. The drop in prices has brought the PE down, but it is still well above the long-term average of 15. Even if you use the last 20 year average of 18, stocks are still overvalued.
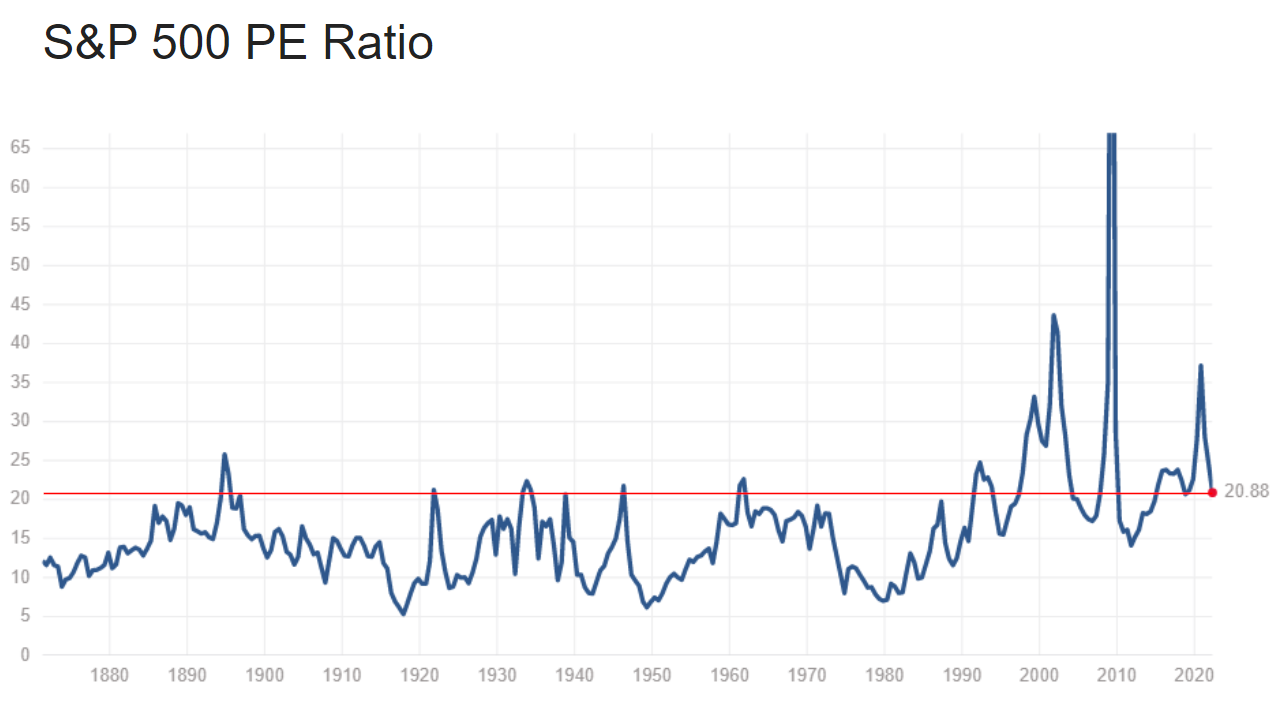
At current earnings estimates for 2022, a PE of 18 would put the S&P 500 at 4086, or just 1% lower from here. Using the 2009 low PE of 16, the S&P 500 would be at 3632 or 13% lower from here. (Note: in 2011 the PE actually went down to 13, which would be 2951 or 29% lower from here.)
Earnings estimates have not yet reflected any sort of economic slowdown. If estimates fall just 10%, a PE of 18 puts the S&P 500 at 3564 or 14% lower. A PE of 16 puts it at 3286 or 21% lower from here. Combine that with the 14% drop already and we'd be at the lower end of a normal bear market drop.
As you can see, the "correct" PE ratio is critical in determining whether or not stocks are undervalued. In addition, it trusts current earnings estimates are correct. If you are buying stocks here you believe a.) valuations will go back to above average levels and b.) the current economic slowdown is not going to impact earnings and c.) it's ok to fight the Fed.
Stocks at a Critical Level
This chart here notes some key events over the past 6 months. We are now threatening to see the markets below the post-Russian invasion levels of February 24.
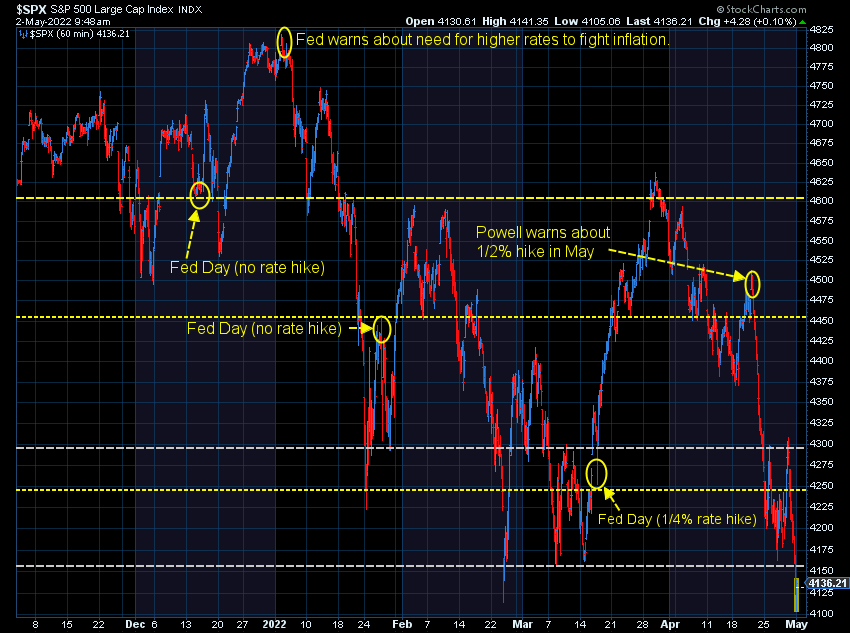
From a bigger picture perspective, unless you jumped into stocks last June, you are still sitting on gains. That's how crazy the market was from June to December in 2021. We had stimulus checks hitting mailboxes and the Federal Reserve sitting on their thumbs believing we wouldn't see any inflation.
This means if you have been uncomfortable with the amount of risk in your investment portfolio you haven't really given up too many of your gains. (Please consult your financial advisor or take our Risk Questionnaire.)
Should we sell in May?
I heard a lot of chatter last week about how we're entering a "seasonally unfavorable time". They were referencing the old Wall Street adage of "Sell in May and go away". Long-time readers know the primary problem with this advice is, May is historically a very good month.
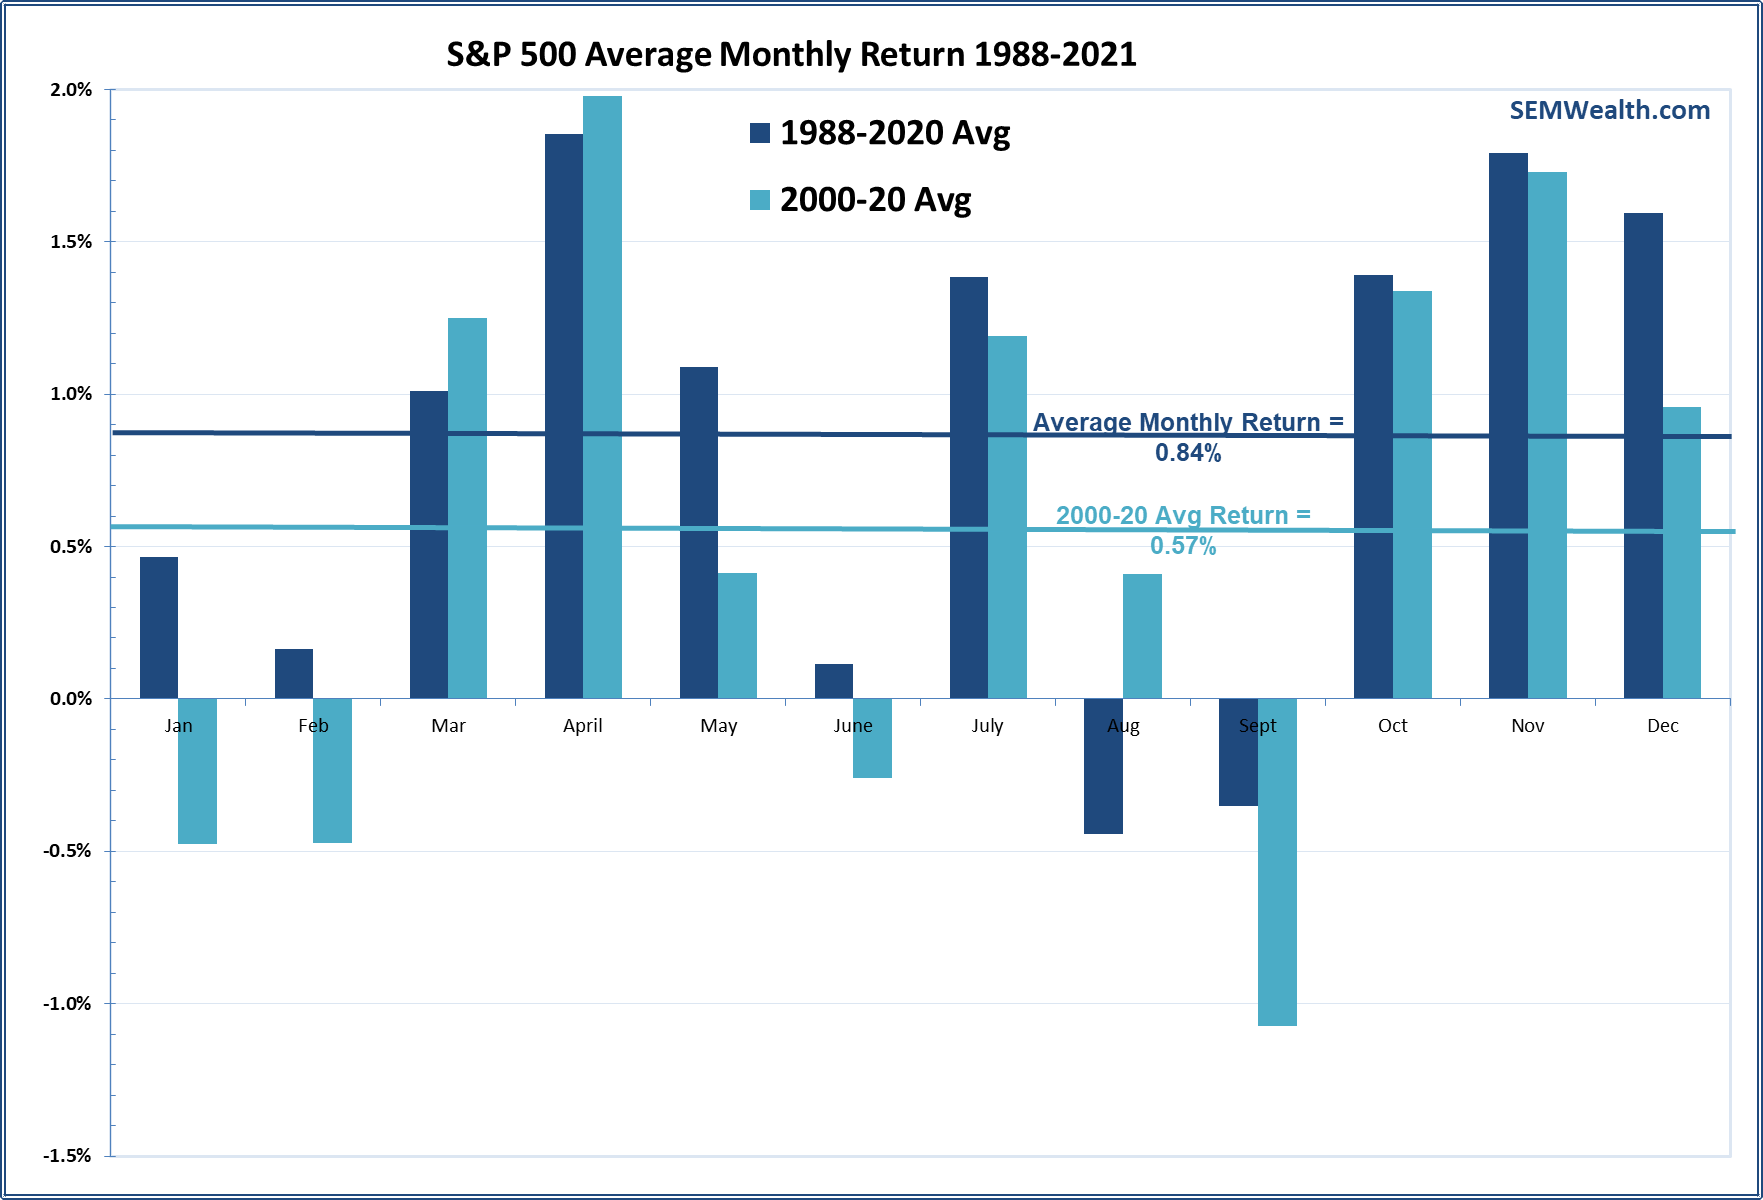
Of course, April has historically been the best month of the year and this April was the worst April on record for the S&P 500. In a normal market we would expect May to be strong, although a lot of those big returns occurred prior to the year 2000.
The reason for the "sell in May" advice is June, August, and September have historically been bad months for stocks. July is actually one of the better months, so take that advice with a huge grain of salt.
Don't fight the Fed
Back on January 10, I asked, "should we fight the Fed?"
Jeff Hybiak, CFA
My point was, Wall Street has no problem saying, "don't fight the Fed" when they are stimulating the economy, but don't follow that advice when they are tightening policy. They had just told us they were planning on possibly thinking about planning to start thinking about maybe finally starting to pull back stimulus. Given the huge impact they have had on the financial system, that was a warning that unless the market and economy was strong enough to stand on its own, we shouldn't fight the Fed on either side.
It is still very early in the Fed's tightening cycle. I may sound like a broken record, but I have no idea why they didn't immediately start tightening following the third round of stimulus. This personal income chart (taken from the Fed's own data) shows the impact the stimulus checks had on income.
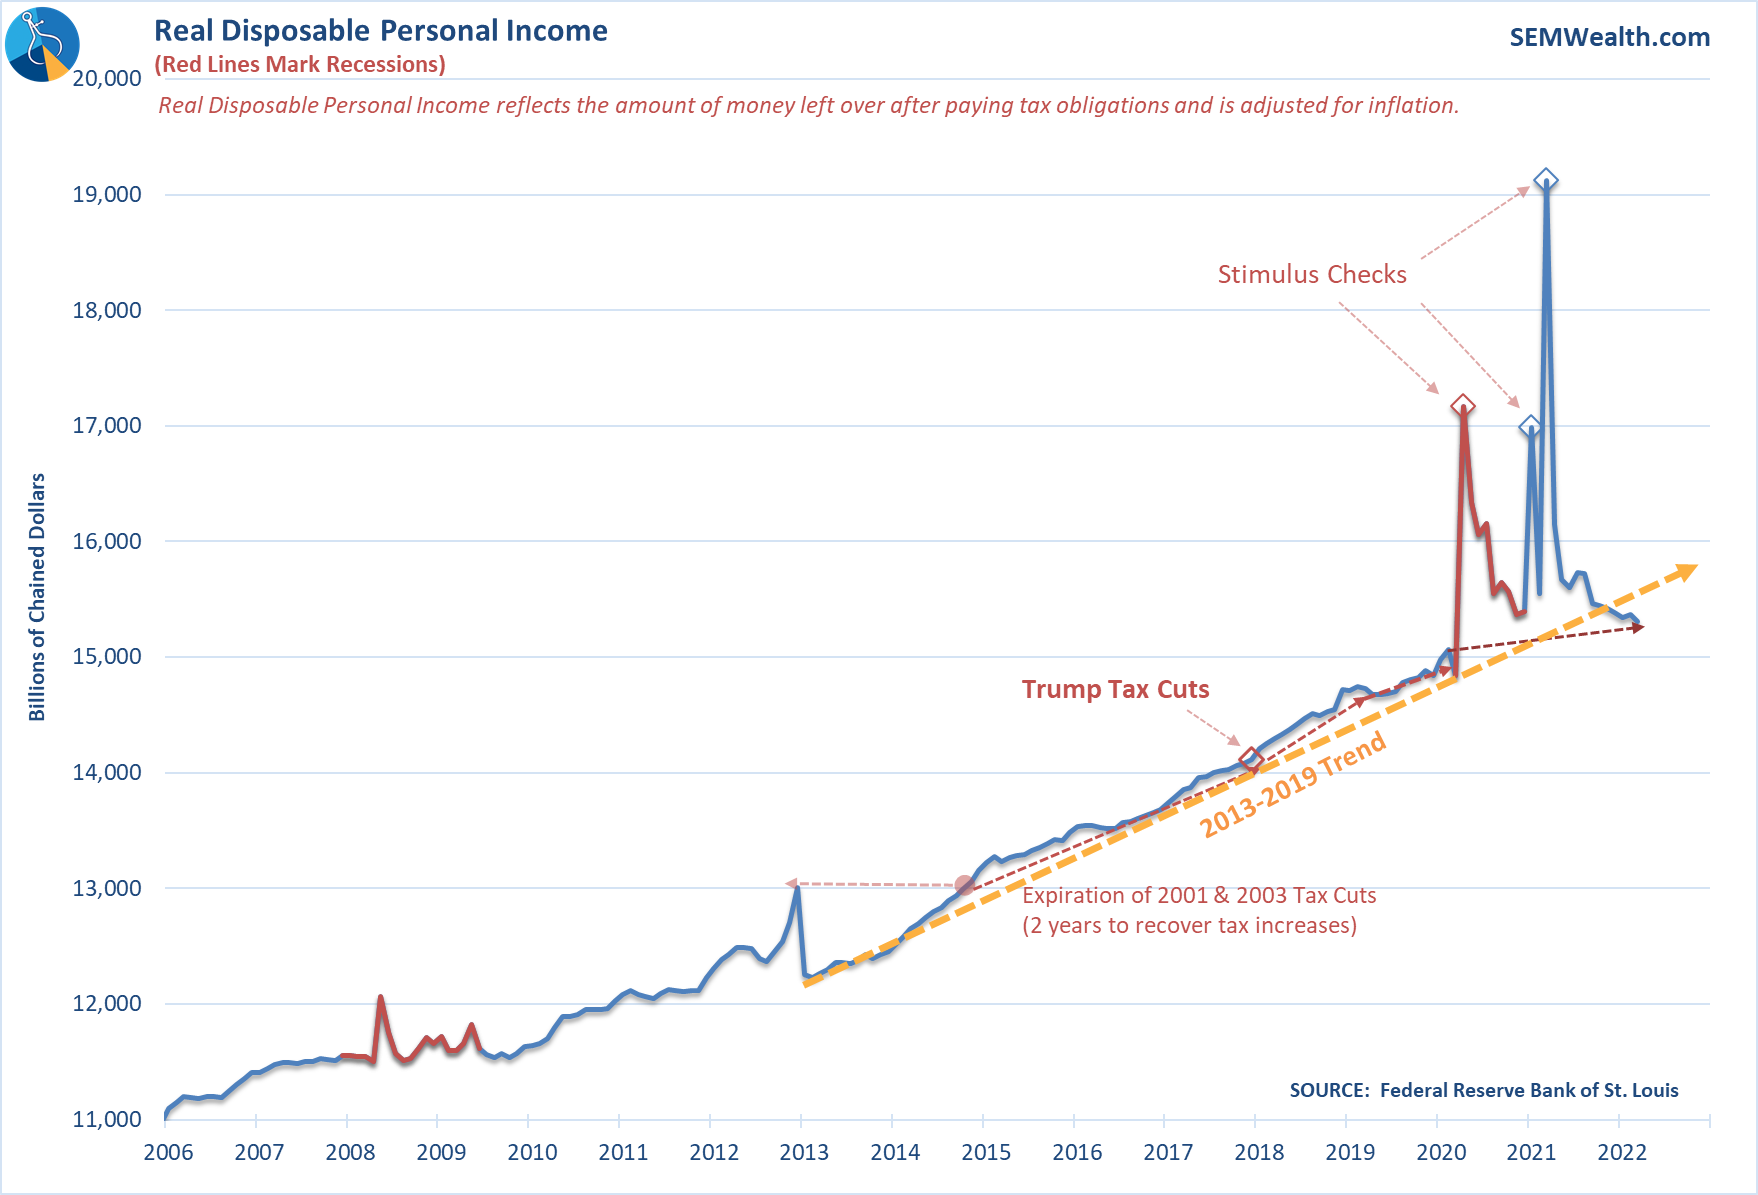
The problem now is those checks likely pushed the "normal" level of inflation higher which will make it more difficult to remove quickly. This will put a strain on households. The trend in personal income is actually below the 2013-2019 trend and is just slightly higher than where we were at before the pandemic. In other words, households have barely more money coming in than they did before the pandemic, but they are paying higher prices for pretty much everything.
Fighting the Fed now could have catastrophic results for investors already retired or retiring in the next 10 years, especially when you consider bonds may not provide a buffer on losses.
SEM's Stock Market Exposure/Plan
Like our bond market exposure, the bulk of our losses in our stock investments occurred in January and early February. For reference, the S&P 500 is down 13% for the year and the "total stock market" index is down 14%. Here is a summary of our "stock" market models:
- Dynamic Aggressive Growth: Entered the year in a "neutral/transition" mode based on our economic model. It switched to "bearish" in early April. This eliminated all small cap exposure and left us just 50% invested in stocks. The remainder is in some "alternative" investments and tactical fixed income managers. Dynamic Aggressive has generated just 3/4 of the market's losses so far this year, which is pretty impressive for an "aggressive" model. It will remain underweight stocks and especially small caps until the decline in economic growth reverses.
- Dynamic Asset Allocator: This "hedge fund-like" model uses the same signals as Dynamic Aggressive Growth, but will be long/short (make money on the upside in one asset and the downside on the other). Currently that means a long position in large cap stocks and a short position in small caps and emerging markets. It also is "short" Treasury bonds, which means it makes money when rates go higher. It has had only 30% of the market's losses this year.
- AmeriGuard & Cornerstone Balanced & Growth: These models reduced growth exposure to start the year and eliminated it fully the beginning of April The growth exposure hurt these models to start the year. The trend following systems which cut stock exposure in February and March (and again last week) didn't really help because the bond positions lost value. These are designed to be long-term investments and are currently down about the same as the overall market. Going forward, however, with the stock investments being in value stocks, no growth exposure, and cash instead of bond positions, we would expect these models to lose less than the stock market if this is truly the beginning of a bear market.
In summary: We have already taken action well before most people were aware there were problems. We also have a plan in place for both this turning into a full-fledged bear market or this being just another short-term correction.


