
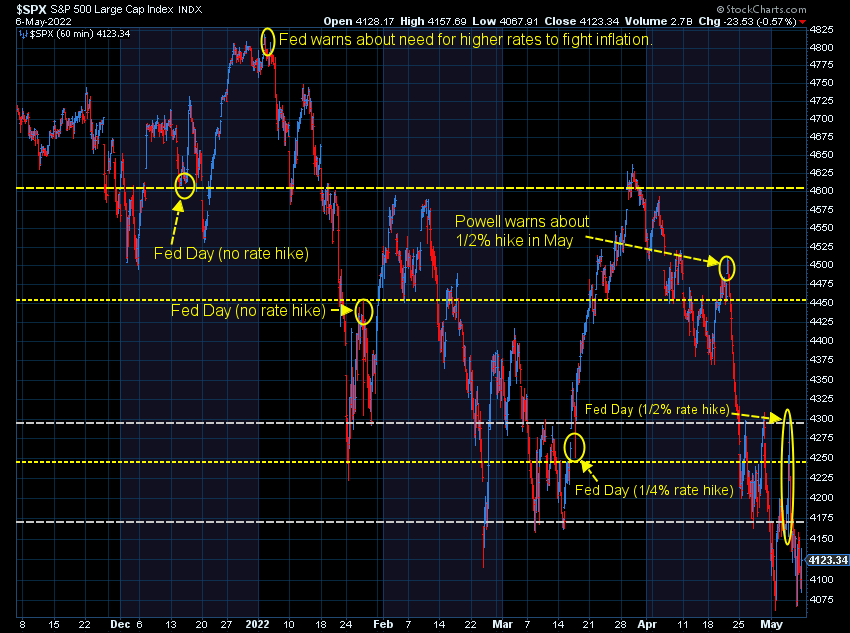
The stock market ended up flat for the week, but the week ended on a negative note. On Wednesday we saw a euphoric 3% rally after the Fed raised interest rates. On Thursday and Friday the market took away that rally and then some. The fluctuations in the market this year have led to all kinds of questions from advisors and clients.
There are times investing is easy and times it is not so easy. Right now there are no easy answers. Most of my answers begin with, "it depends........"
Weekly Talking Points
It depends on your time horizon......
- 3-6 months: the next direction is a coin flip. We certainly could see a huge rally that recovers half of the losses so far this year. That is actually normal following a large drop in prices. Conversely, given where we were in terms of valuations and returns that were double the long-term average the past 3 years, we could continue to see prices drop. Either way, the short-term direction could be volatile.
- 6-18 months: economic fundamentals and valuations mean the market is likely going to struggle, especially when you weigh the impacts of inflation. With so much stimulus from Congress that is working its way out of the system and with unprecedented manipulation of the financial markets by the Fed, nobody knows for sure what "fair value" is for stocks and interest rates. Going into COVID our economic model was indicating a slowdown, so unless the economy got BETTER during the last two years, the best case is we will have a slowing economy, which is rarely good for stock prices.
- 18-36 months: There will be some nice rallies that will suck people into believing the worst is over. The only way this will be true is if we've gotten to the other side of the "unwind" of stimulus. A typical bear market last 18-24 months with the market dropping 35-50%. This means over the next 18-36 months we will see the "bottom". Most of the time, when we are at or near the bottom few people will WANT to buy stocks. In all past bear markets we've been met with skepticism and anger when advisors and clients see us jumping back into riskier assets. As I always say, when it feels good to buy you probably are near the top. When it feels awful, you're probably near the bottom.
- 3-7 years: This will all depend on how the STRUCTURAL issues are resolved. We entered COVID with too much debt and not enough investment. We had a massive trade imbalance. We had a demographic imbalance (too many looming retirements and not enough workers or QUALITY jobs to replace them.) During recessions we often see a restructuring of our economy. If we have leadership willing to make the difficult choices, we could see a generational low in the markets that leads to very strong economic (and market growth) for a long, long time. If we continue to use short-term solutions, we will continue to see fits and starts in both economic growth and the markets.
- 7-15 years: We could see 2-4 bull markets over this time frame. Based on market history, the market SHOULD be higher 7-15 years from now, so if your time horizon is this long the only thing you need to do with that portion of your portfolio is to make sure you are in a well-diversified portfolio that aligns with your objectives and overall risk tolerance. Remember, the industries/companies that led us into the last expansion are rarely the ones which lead during the next expansion.
- 15+ years: Based on 150 years of stock market history, stocks should be higher than they are now 15 or more years from now. Keep pouring as much money as possible into a well-diversified portfolio. Max out all available retirement plans. Avoid looking at your account values – you have a long time before you actually need the money. Stick to your plan.
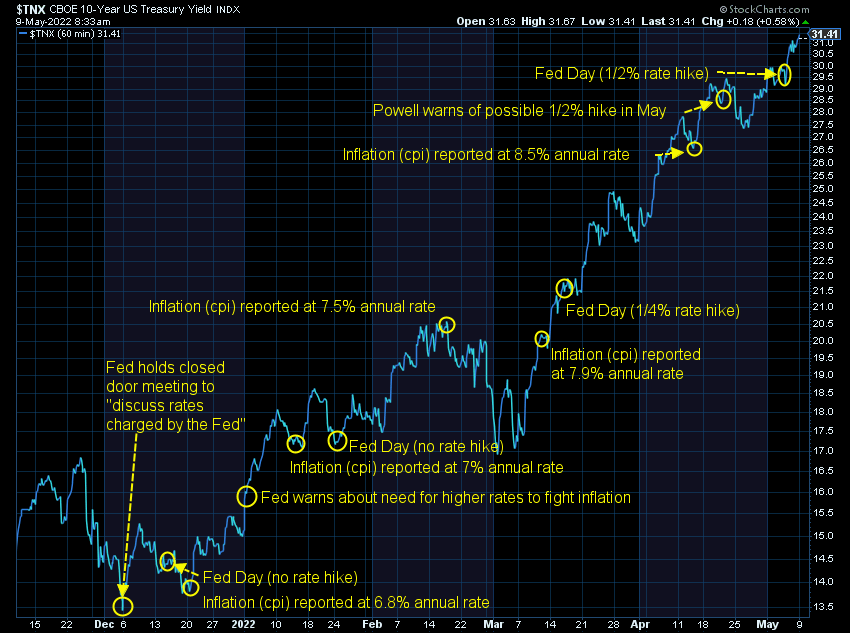
It depends on interest rates.....
The real difficulty for most investors is the fact bonds are hurting your returns this time around. Minus 1994 and 2-weeks in March 2020, government bonds have gone up when stocks went down over the past 30 years. This has given investors a false sense of security with their "diversified" portfolios.
I continue to watch this chart throughout the day for signs interest rates may finally roll over.
A bigger problem is we may be breaking the 40-year trend line in interest rates (or data agreement only allows us to show 20 years, but the dashed line goes back to the peak in rates in the mid-80s.
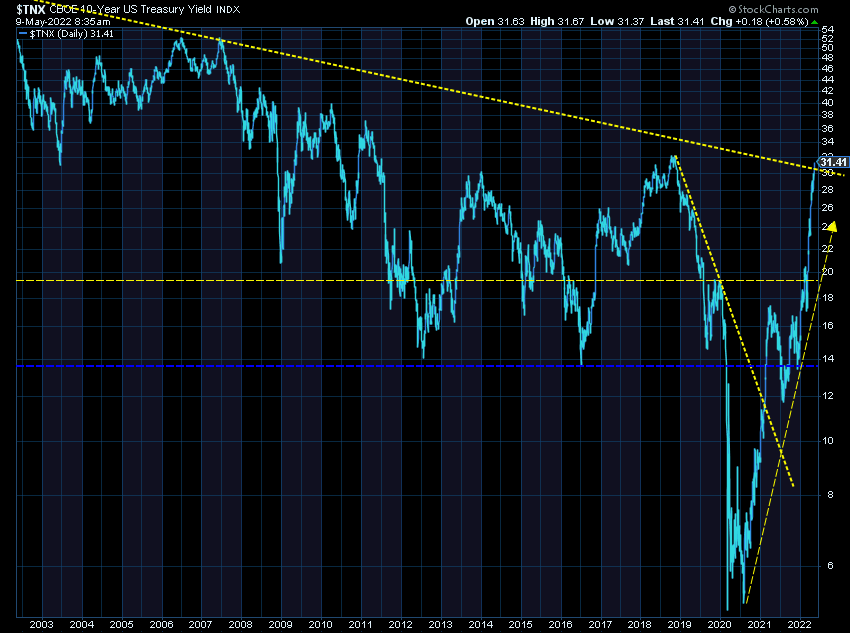
Eventually long-term Treasury rates will go down as the Fed hikes short-term rates. This could lead to a rally in Treasury bonds, but make a difficult environment for corporate bonds, especially high yield ones. A big problem could emerge due to the heavy reliance on "investment grade" bonds inside pension plans and annuity issuers.
I wrote about "investment grade junk" back in the spring of 2019. The Fed and Congress gave that portion of the market a temporary stay of execution, but if rates go up too high, we could be looking at major collateral damage in the financial markets.
It depends on emotions......
Investing was "fun" in 2021. Remember the "meme" stocks? Remember how pretty much every stock went up? Remember how "smart" we all felt? Investing hasn't been so fun lately and that could be a problem. Speculators can boost markets far longer than we think, but if they leave, we end up with little support as the market drops. So far, we haven't seen a panic, but if we break the lows from last Monday we could see more emotional selling.
For everyone who bought stocks over the past 12 months, they are now on the verge of losing money on those purchases. From a behavioral perspective this could lead to more selling. Below last Monday's closing price there isn't much "support". This means people buying stocks in the earlier part of 2021 would also now be in losing positions. This could lead to a rush of selling.
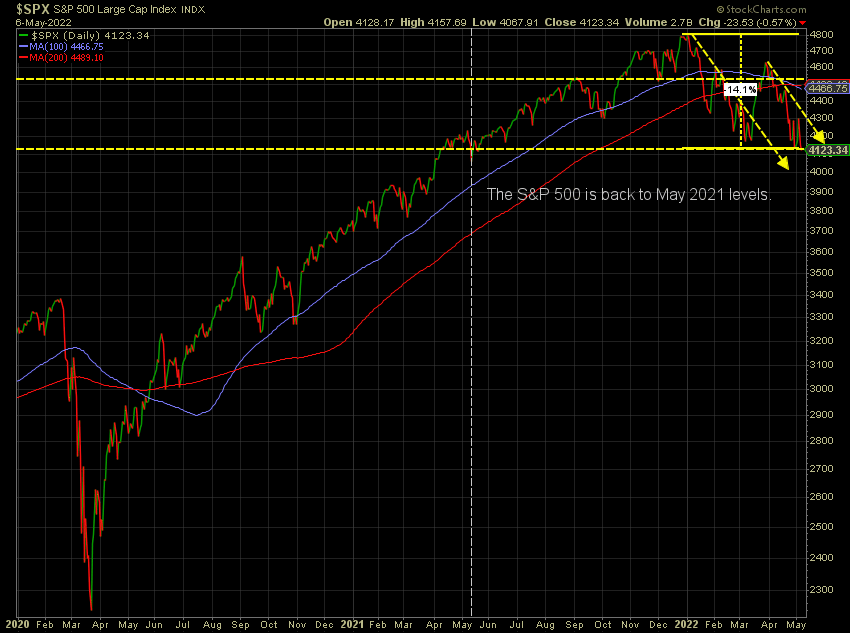
It's important to understand how averages work. Going all the way back to 1926, the S&P 500 has averaged around 10% growth per year. This has included periods where the 3, 5, or even 10-year average was 20% or more and 3, 5, and even 10-year periods were the average was negative. When we have returns significantly above average, we should expect returns to be significantly below average.
Going into the year, the 3-year average return was 26%, the 5-year return was 18%, and the 10-year return was 16%. To get back to the long-term average we need to see a drop of 35-50% (depending on the time horizon.) Coincidently, this puts us right in line with a normal bear market.
It depends on your time horizon....
We use this illustration with every new and prospective client to explain the role each of our investment models plays inside a portfolio.
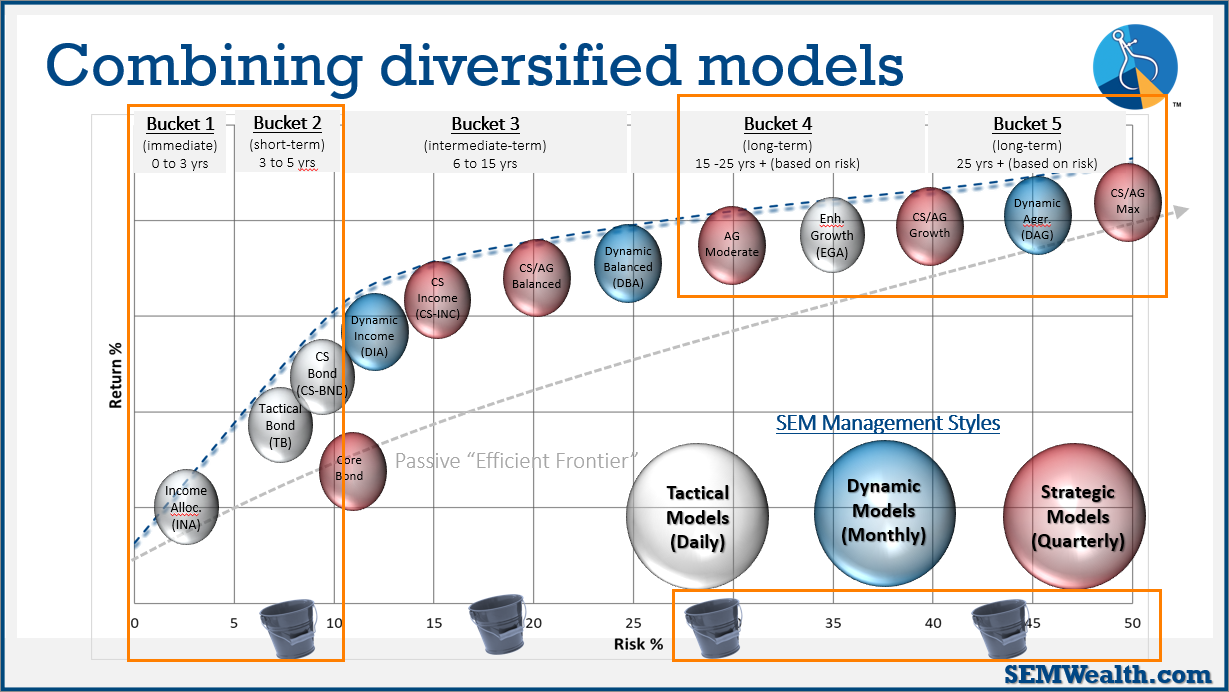
To make money, you have to take on some risk. We structure our models and the trading systems which comprise them based on various "buckets". Our lowest risk models play "defense first". This doesn't mean they won't lose some money. For Tactical Bond, Income Allocator, & Cornerstone-Bond, the bulk of the losses this year have been in the first 5 weeks of the year. They are down around 3-4%, well within what should be expected. All are sitting in very defensive positions currently waiting for better opportunities.
Our "bucket 4" & "bucket 5" models have endured losses similar to the markets, but this is by design. The role of those models is to participate in as much of the market as possible. They have taken some money off the table over the past few months, which will help stem the losses a bit if/when this turns into a true bear market. Only money with a 15 year or longer time horizon should be invested in these models.
Most of our clients have a blend of several models to cover the various "buckets" in their financial plan. At times like this it is important to keep the time horizon in mind when evaluating these investments. From our perspective, everything is working according to plan. We could be facing an environment most of us do not remember – interest rates going up even as stocks go down. Having an unemotional, data-driven process will be key in navigating this type of market.
More resources
In case you missed it, or just want a refresher of what we're looking at, make sure you check out these posts:
 Jeff Hybiak, CFA
 Jeff Hybiak, CFA
 Jeff Hybiak, CFA


