
While the weather in most of the country doesn't feel like it, fall is just around the corner. Other than the northeastern part of the country, most of the country has been back in school for at least two weeks, yet Labor Day still seems to mark the "end of summer" in terms of work schedules on Wall Street. There is an old adage that the "junior" portfolio managers are on the desks during the summer and when the "senior" portfolio managers return after Labor Day we often see them reverse some of the trades made over the summer.
At the beginning of August I commented on the very low volume behind the rally and worried that after Labor Day we could see a very large reversal. Now following a 9% drop from the highs, things could get much more interesting. Last Friday's jobs report was initially seen as a "goldilocks" scenario – growth wasn't too strong or too weak. The thought was maybe this would mean the Fed wouldn't have to do too much more to slow inflation (and the economy.) A few takes from Fed members in the later part of the morning threw cold water on that idea and the market again sold off.
While I think it is wrong, there are plenty of people who are starting to believe "good news is bad news" for stocks. We've been conditioned to believe the Fed controls everything, but data and experience tells us the Fed cannot stop a recession and thus a bear market.
It's already Tuesday, so I'll try to keep the "Monday Morning Musings" brief.
Quick Take on the Jobs Report
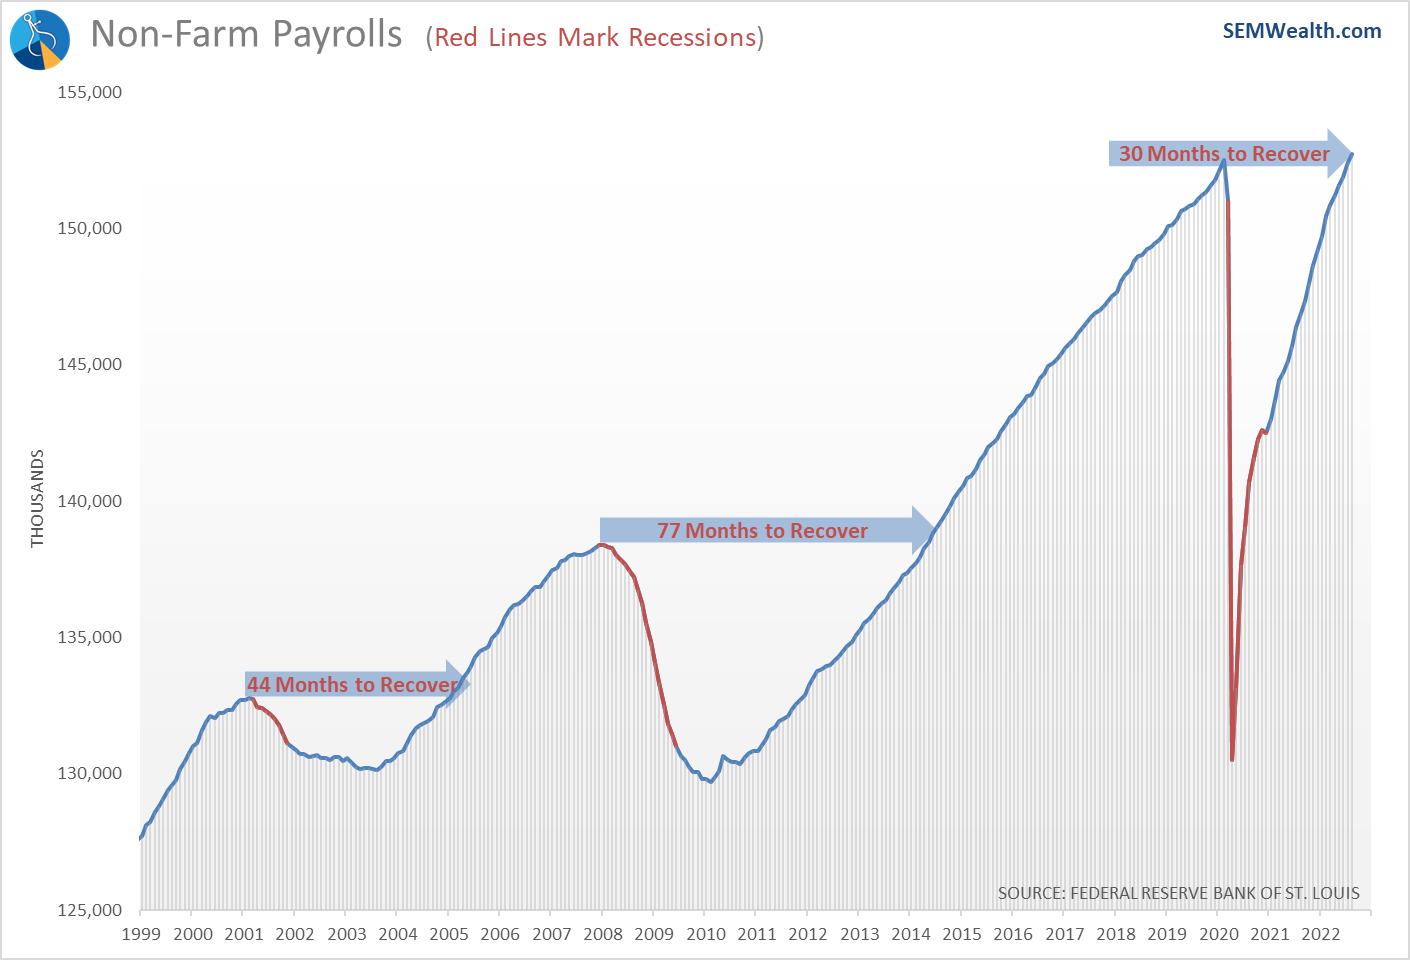
Regardless of whether the growth in the labor market is too much or not enough, at least in terms of the number of jobs this recovery has been the fastest this century.
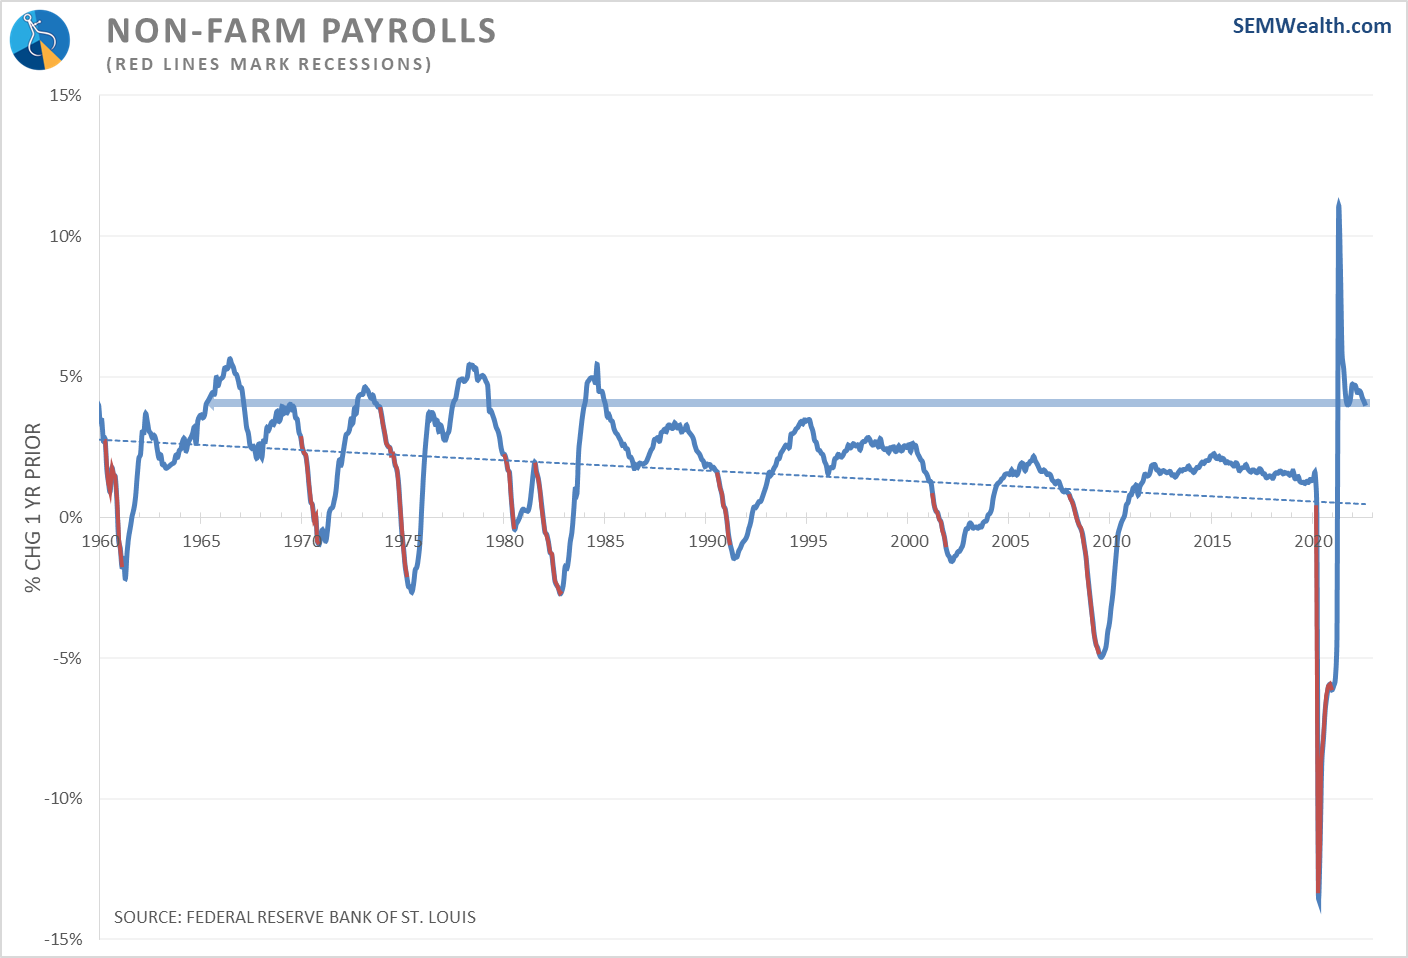
One interesting thing to note is the pace of job growth. It has been averaging 4% year-over-year for the entire year. This is the strongest pace since the mid-1980s.
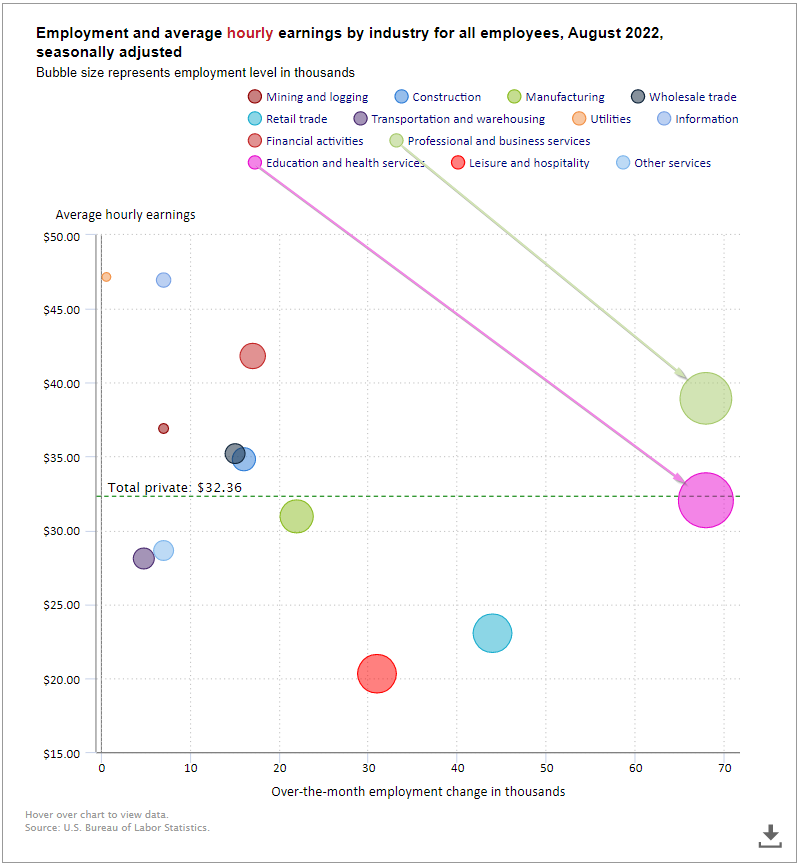
I was also happy to see the two largest sector increases came in higher paying industries – professional & business services and education & health services. I'm not sure how many of the education jobs were back-to-school related, but in the past leisure & hospitality along with retail trade have been the biggest job producers. Those pay significantly lower wages.
Not as bad as last month
Other pieces of economic data released last week showed the economy is not "too bad" (but also not "too good").
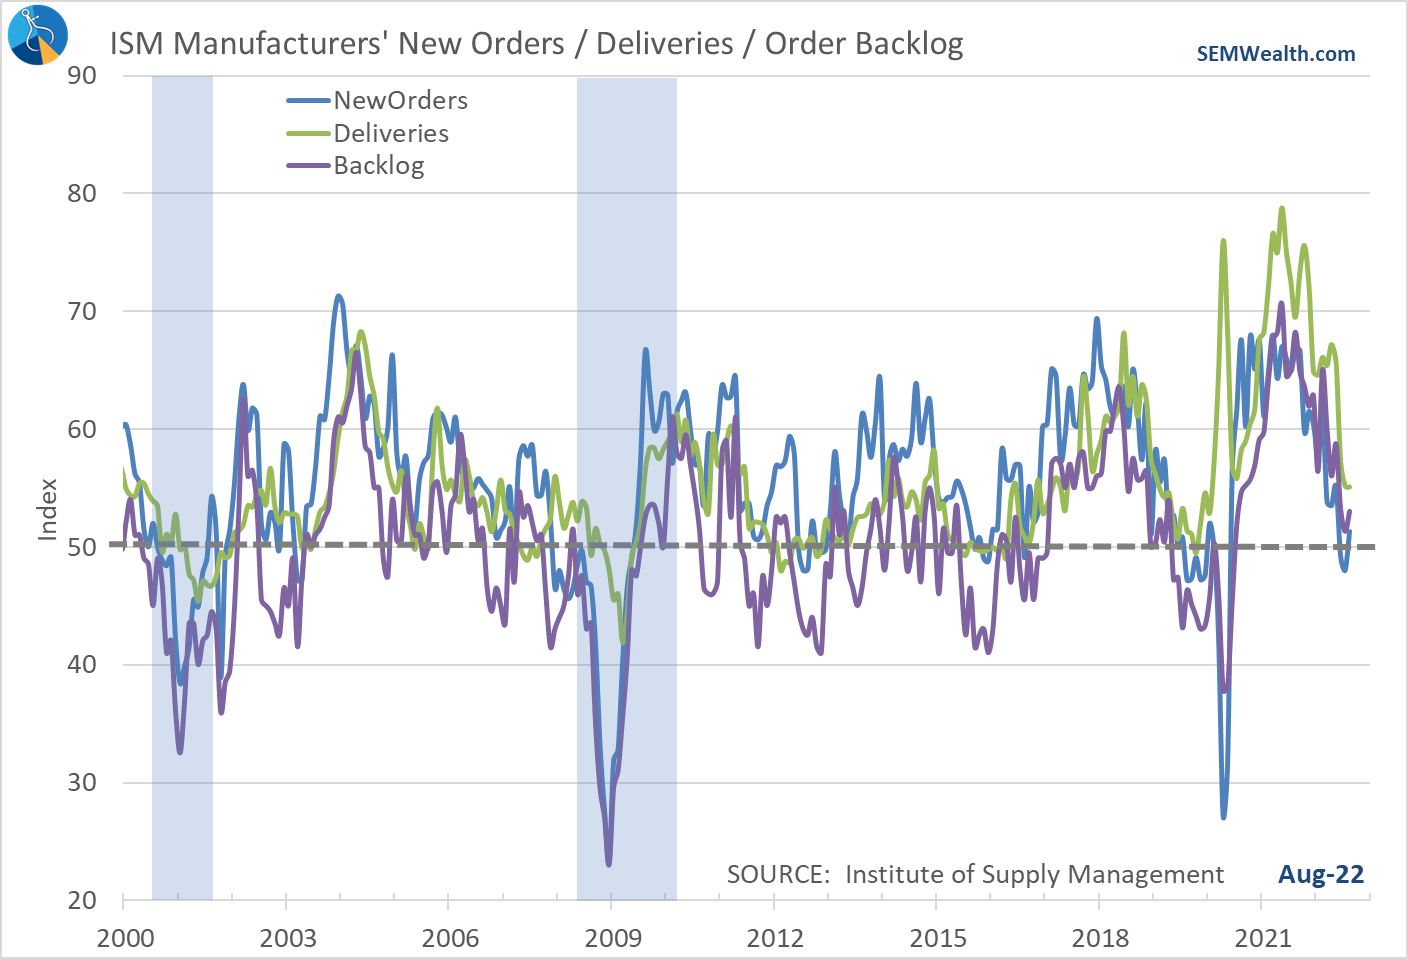
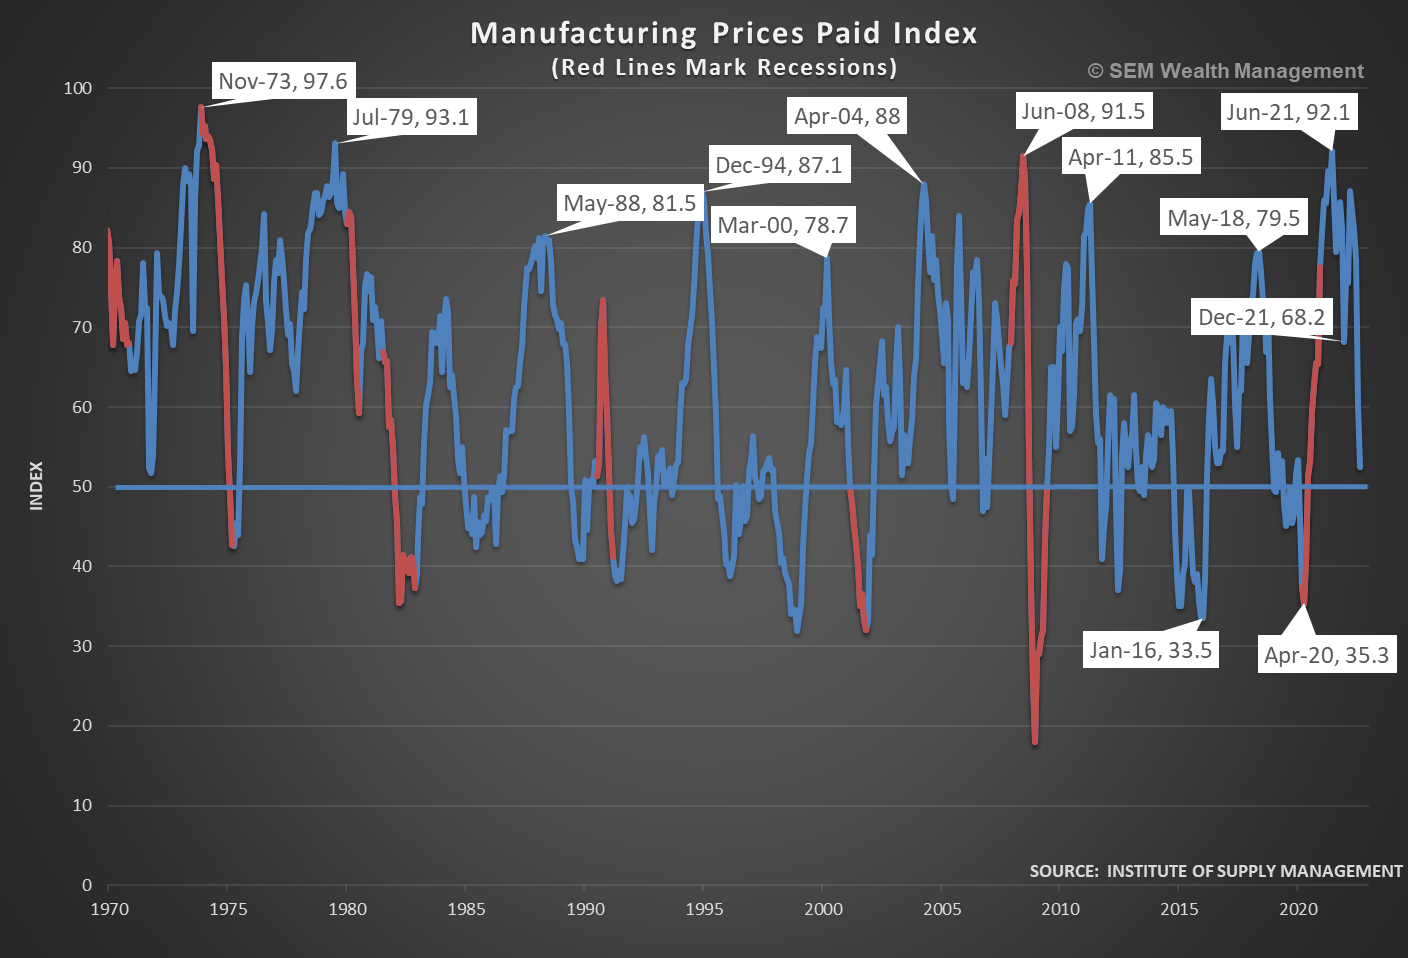
Manufacturing data seems to have stabilized last month after hitting recessionary levels the past couple of months.
Even better, manufacturing prices have plummeted the last few months.
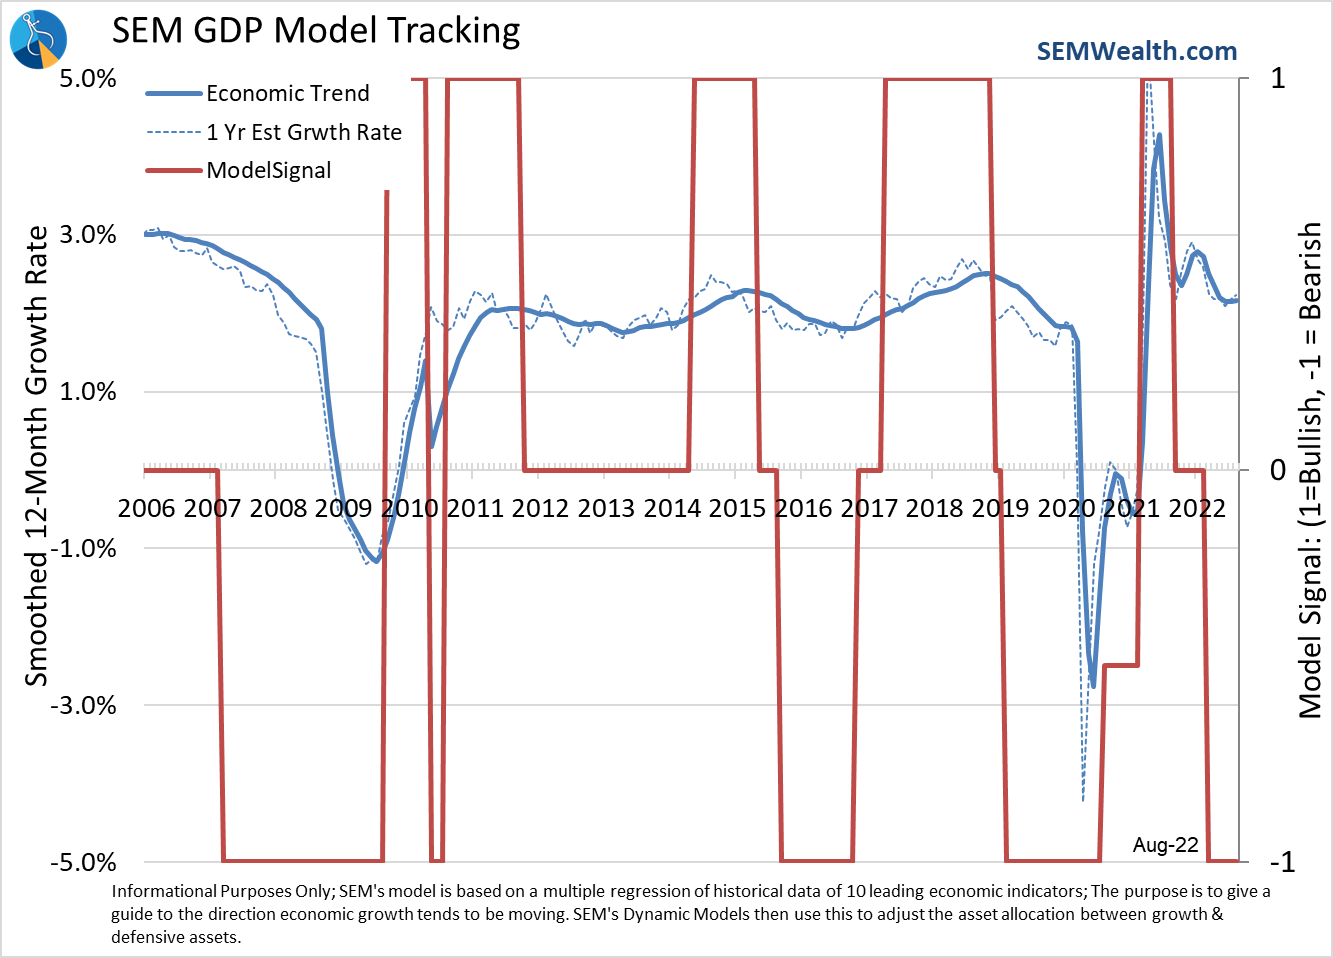
A possible "soft landing"?
Overall, our economic model has stabilized. It hasn't quite reverted back to neutral just yet, but it also isn't trending lower any more.
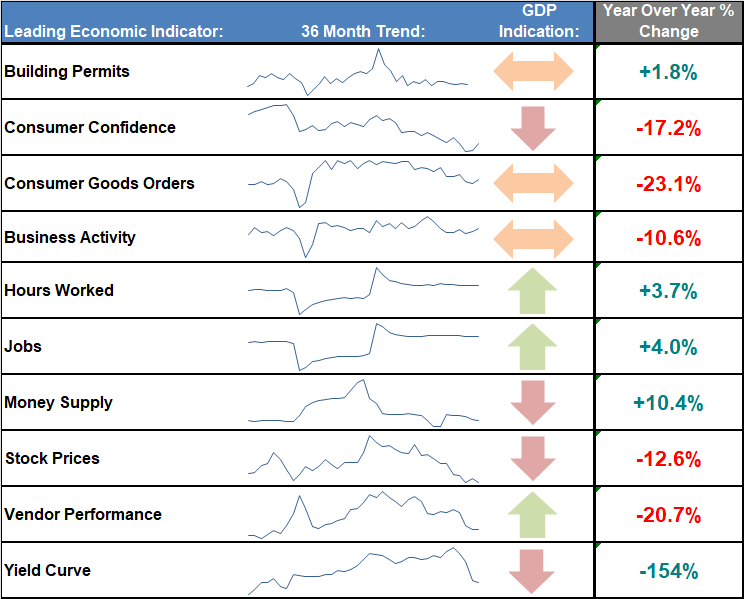
Looking at our leading economic indicators you can see the wide array of signals. This type of disparity likely will keep the model "bearish" for a bit longer.
We've yet to feel the impact of Fed tightening
What hasn't changed is the same thing I've talked about for the past month – inflation will remain stubbornly high and well above the Fed's "target" of 2%. This means we continue to face this reality:
1.) The Fed wants slower growth to curb inflation
2.) Stocks are priced for continued strong growth
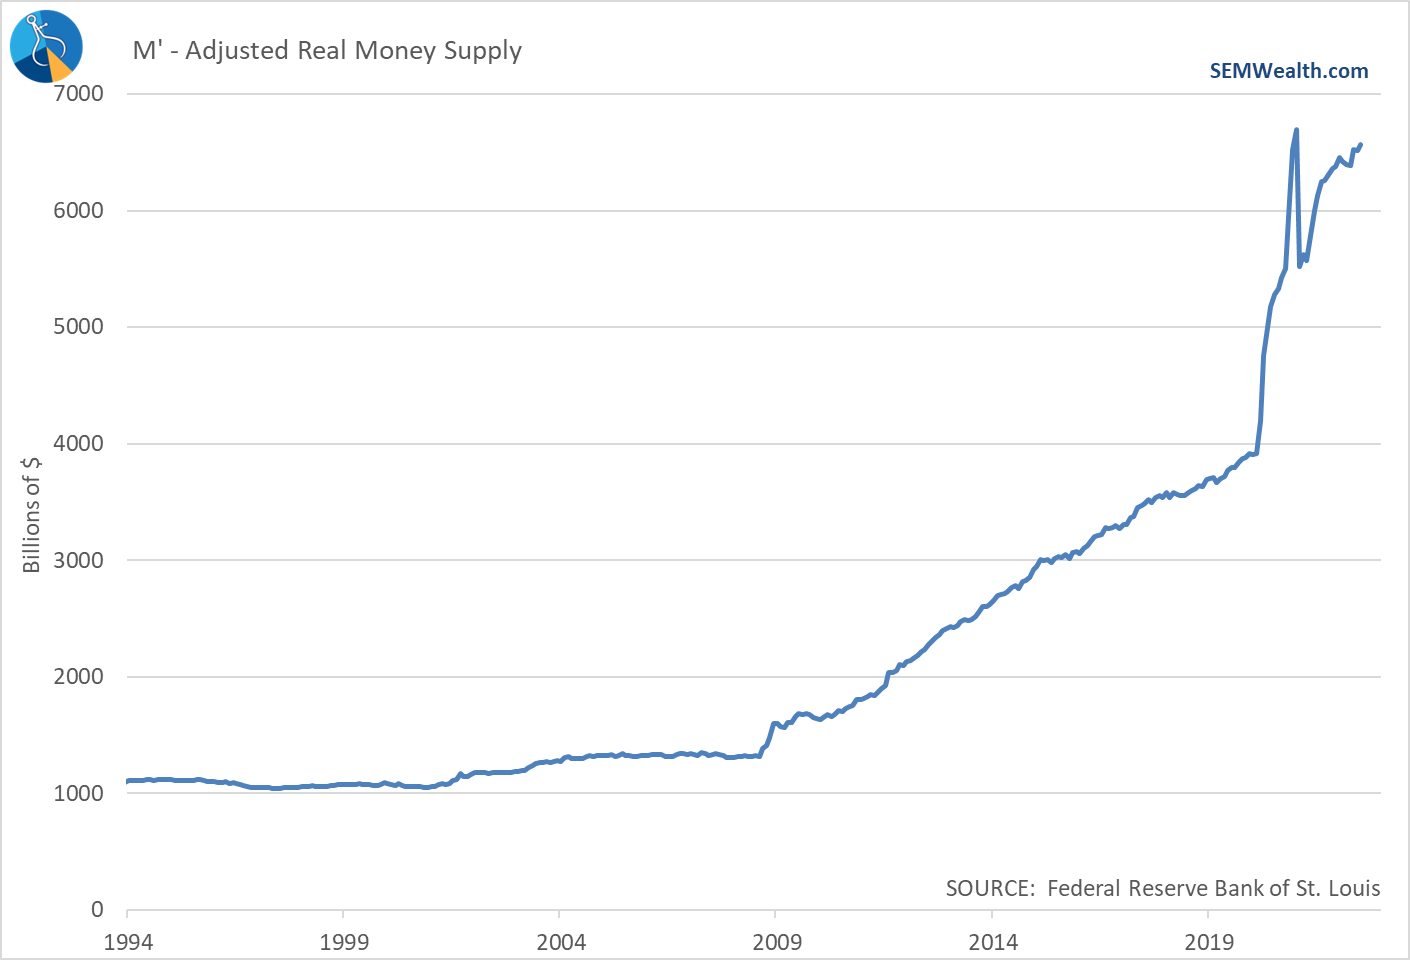
What is being missed is the economy has barely even felt the impact of Fed tightening. The money supply is actually still moving up, which is inflationary.
Looking at the Fed's Balance Sheet, they have barely even begun to pull back all the money created under Quantitative Easing.
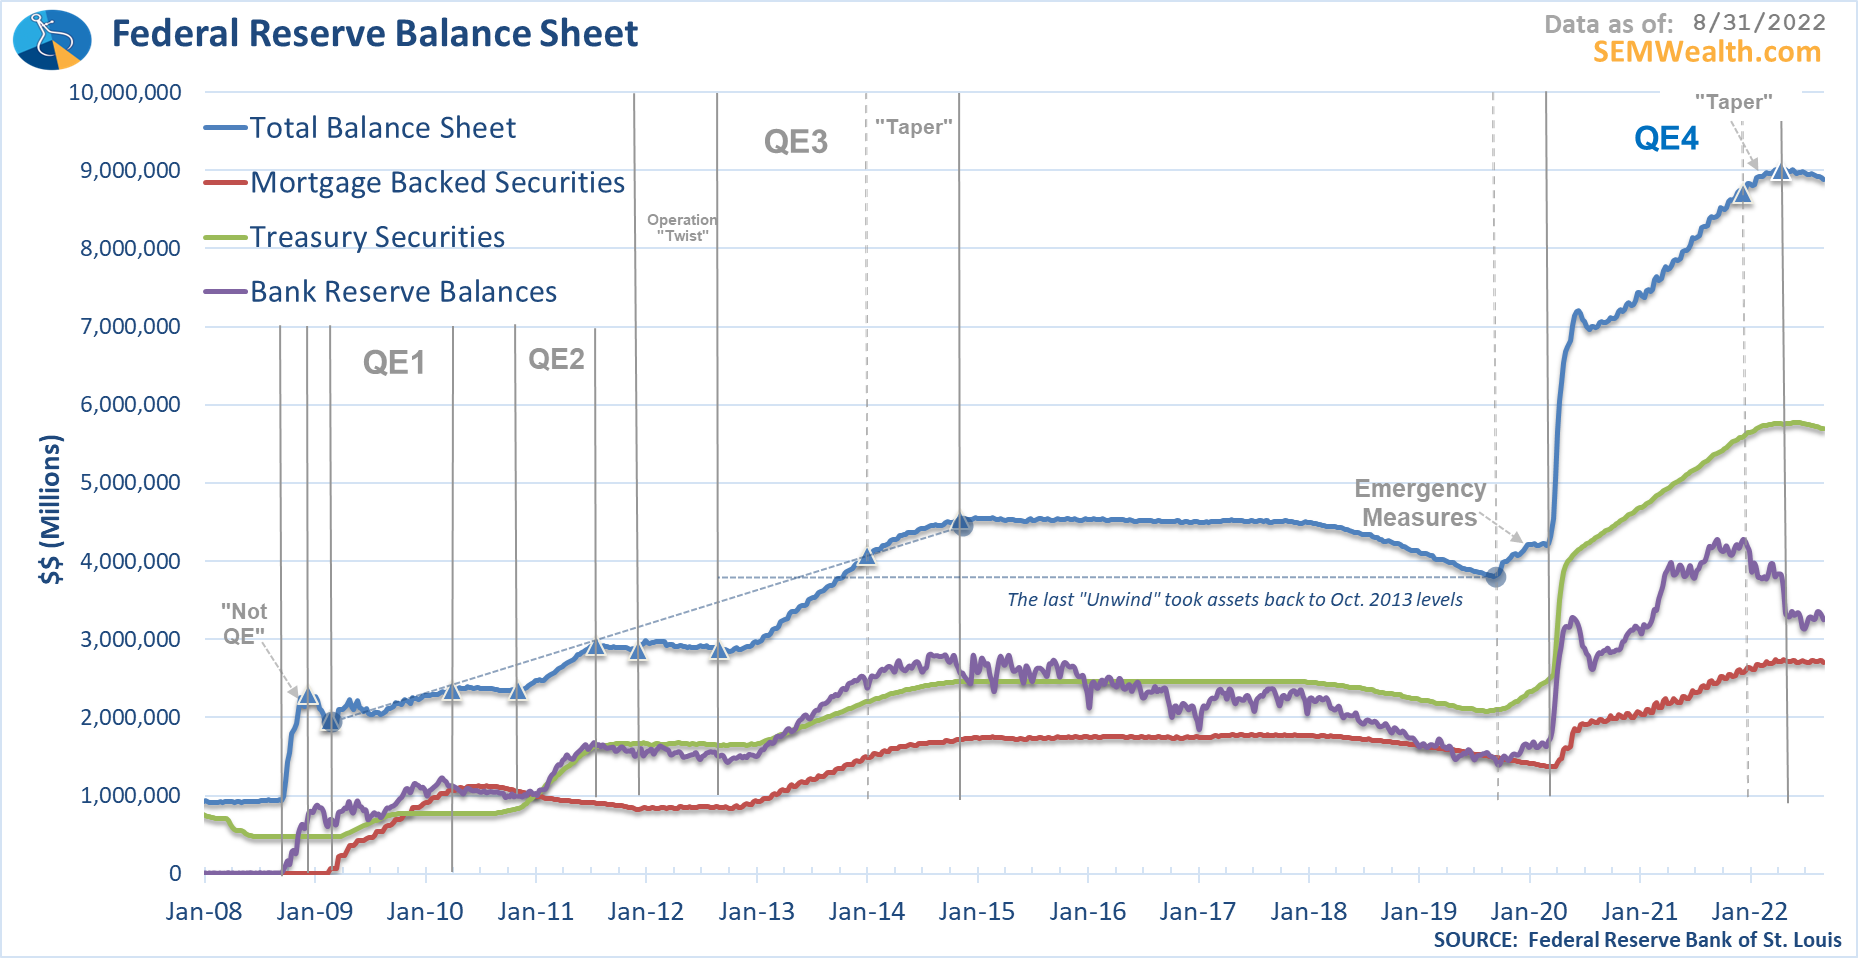
Most academic studies have found it takes 9-12 months for a change in Fed policy to filter all the way through the economy. This means we haven't even felt the impact of the FIRST Fed rate hike (of 1/4%) nor have we seen any impact from "Quantitative Tightening". We should expect much slower growth in the months ahead, despite this "good" news. (Side note: the free market has already tightened for the Fed via long-term interest rates. Remember, the Fed sets short-term rates to spur lending and keep money flowing, but the bond market determines long-term yields. More on that in the bond market discussion below.)
"Worst month of the year"
I've lost track how many times in the past week I've heard a commentator say "September is the worst month of the year." They are correct, but it doesn't guarantee September will be a bad month.
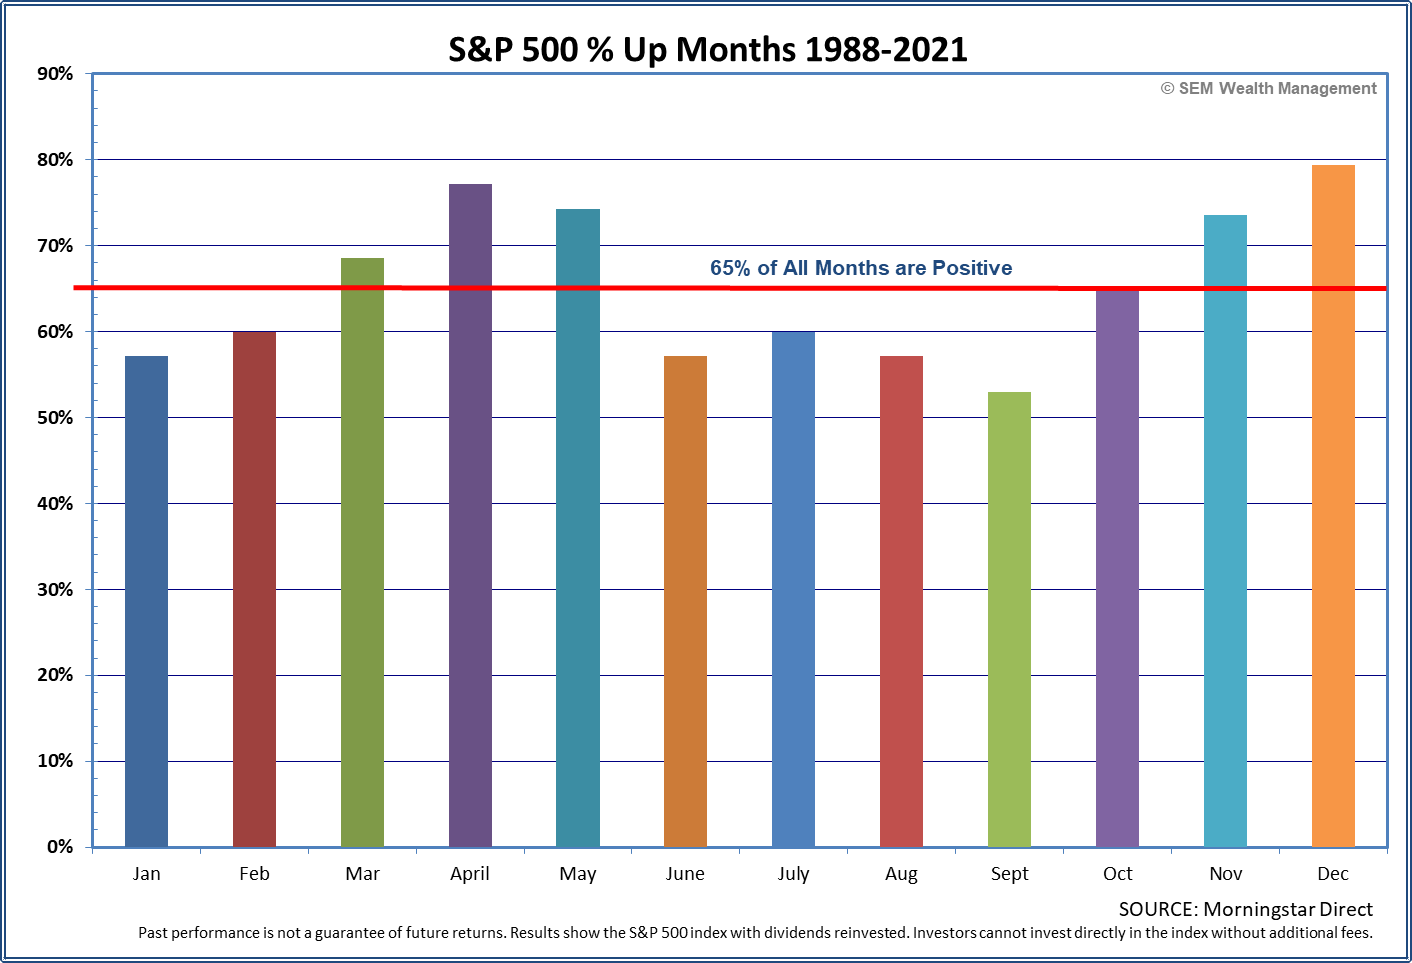
September returns since 1988 have been positive 52% of the time. Overall the stock market is up 65% of the time, so this seems "bad".
From a return perspective, the "average" return for September is indeed the worst, especially the last 21 years.
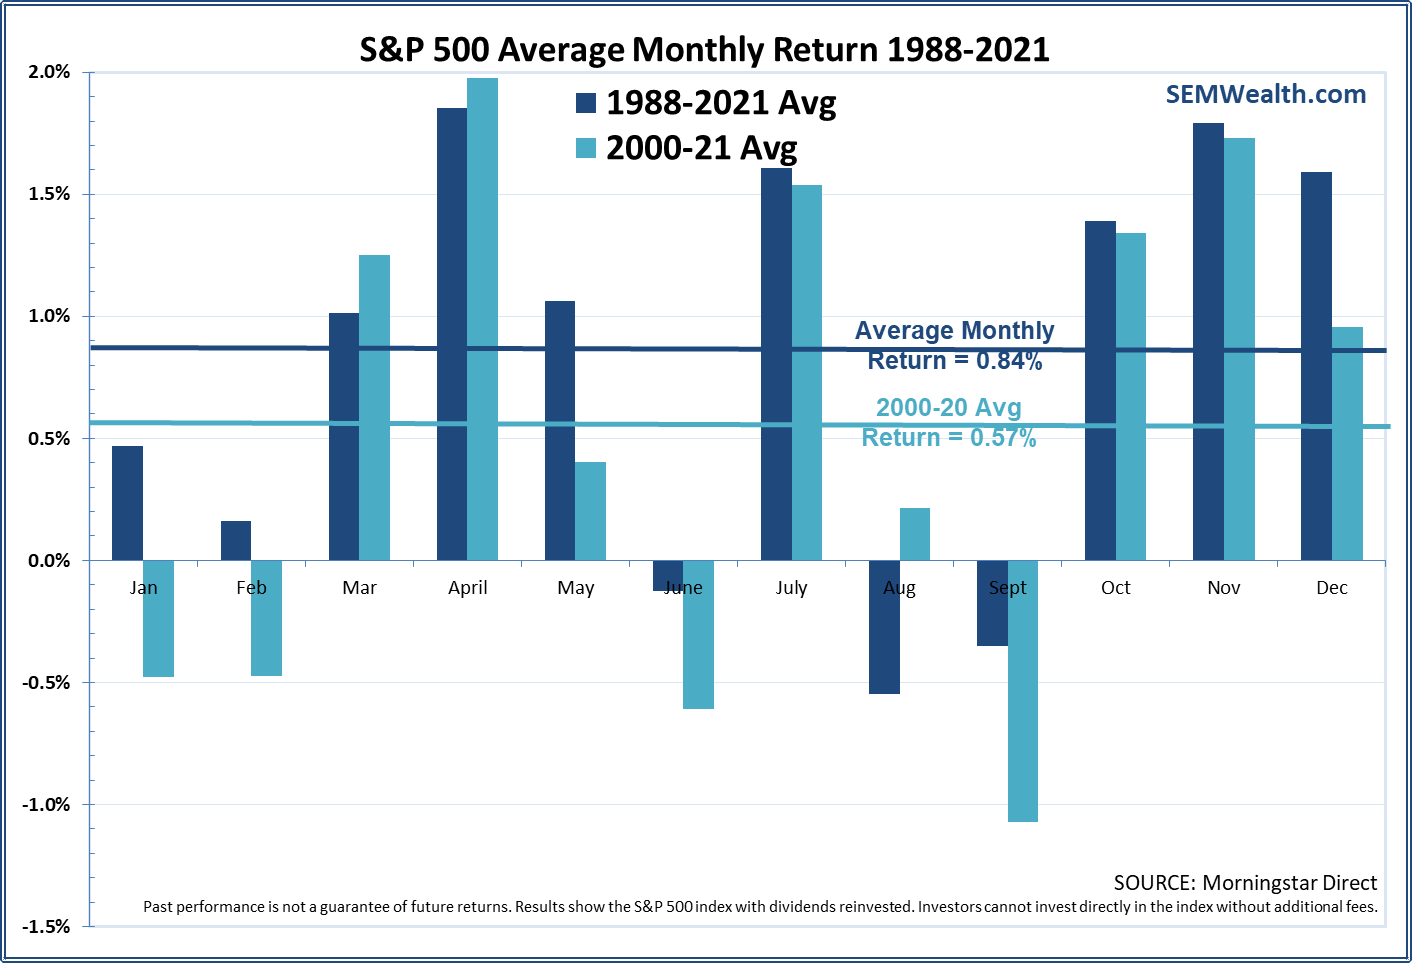
This doesn't mean we cannot have some great returns.
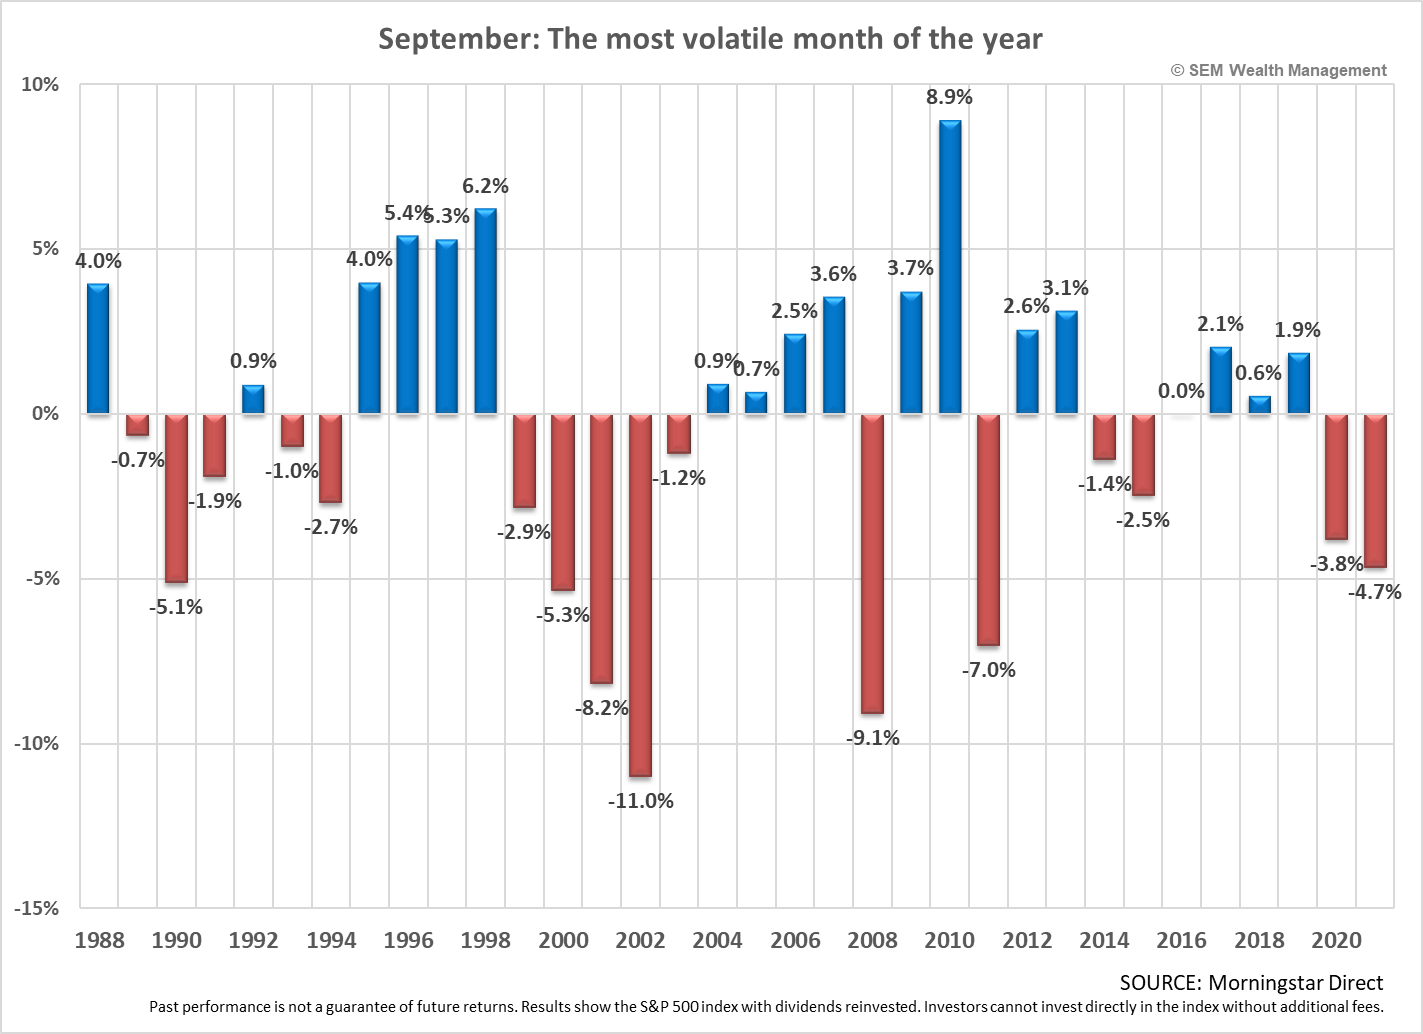
Conversely, note the large losses during past bear markets/economic slowdowns (2000-2003, 2008, 2011, 2015, & 2020). Tie that in to the next topic and caution is certainly warranted.
Bear markets are "back end loaded"
Since June when the S&P 500 "officially" entered a bear market based on the mainstream -20% metric, I've been warning investors and advisors to not get sucked into what will be some very big bear market rallies. The biggest gains tend to be during a bear market, which are then followed by even larger losses.
Over the weekend I saw this table from macro analyst Nick Reece.
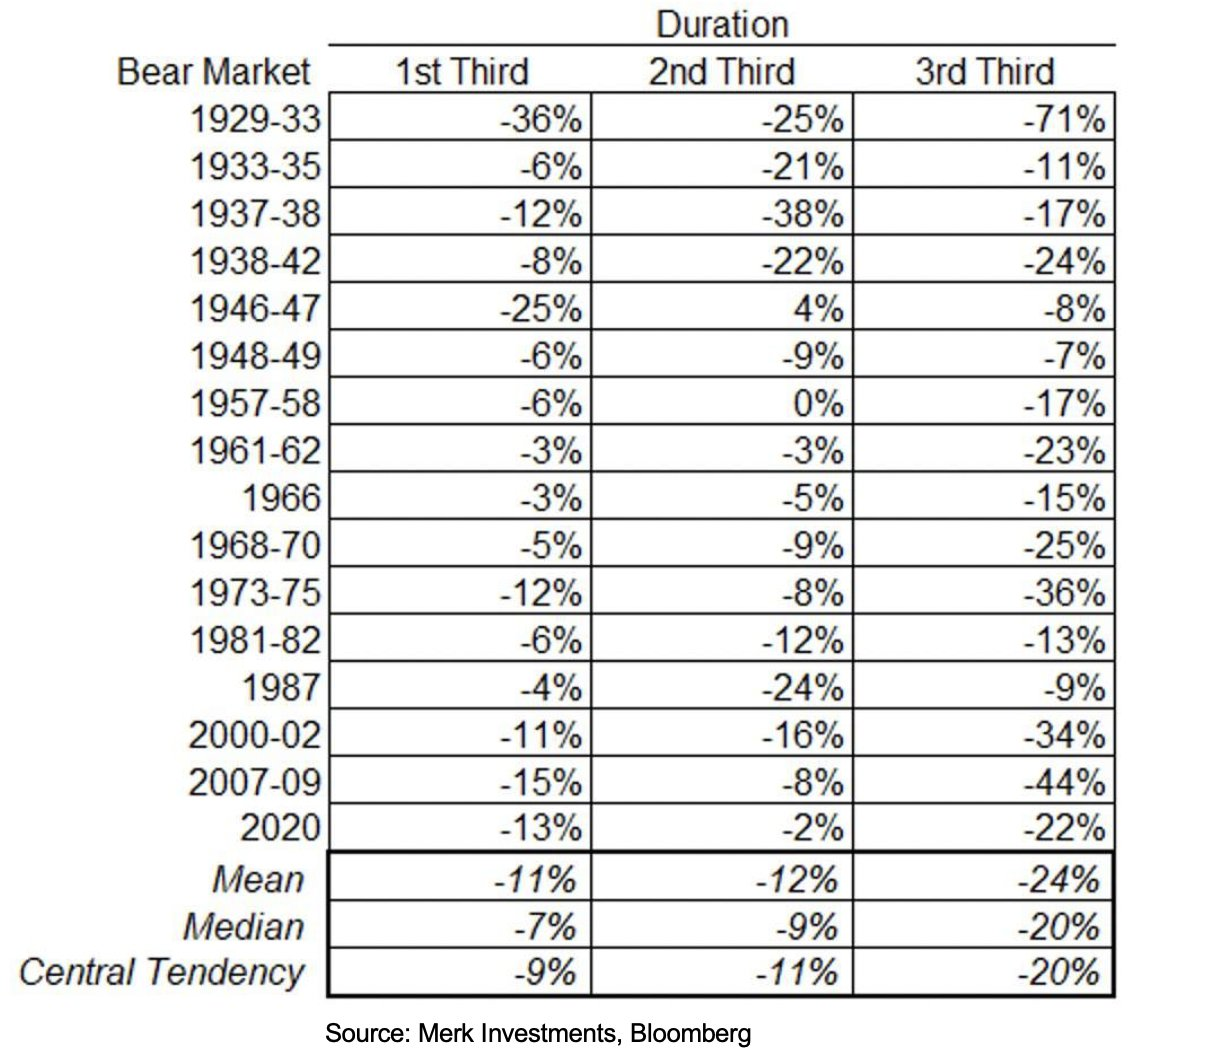
Obviously we won't know until we have the benefit of hindsight the duration of the bear market. The average bear market last 16 months. This means we are in the middle of the 2nd third, which would normally have losses about equal to the first third. We lost 16% during the first 5 months of this bear market. 16% down from May through September would put the S&P 500 around 3500 or down 11% from here.
Who knows how this will play out, but if this is an "average" bear market, we could be looking at some much bigger losses into the early parts of next year.
Market Charts
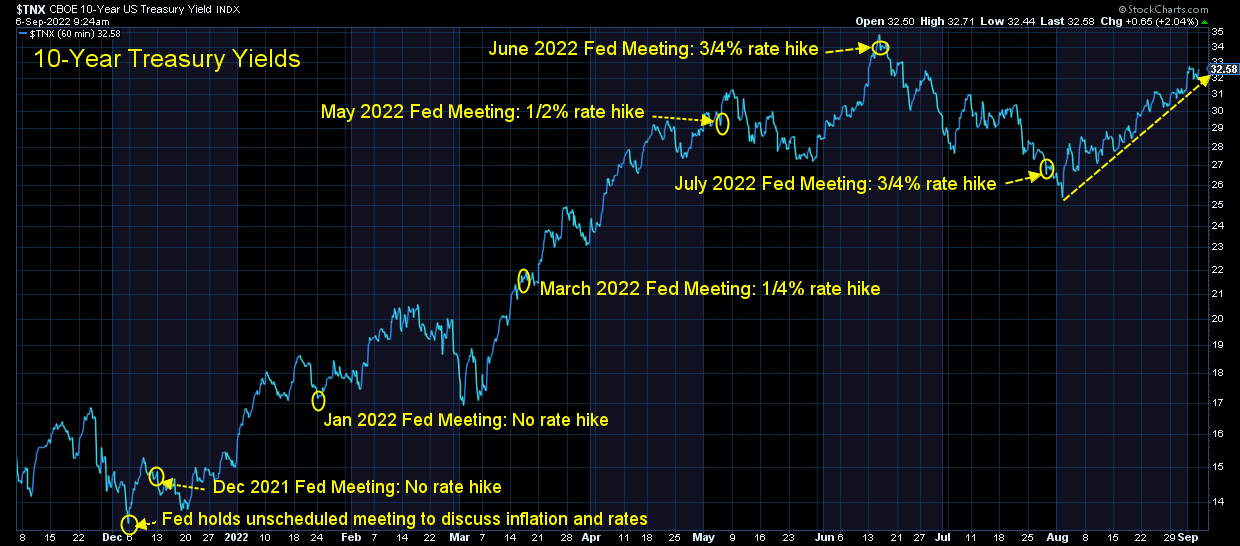
I've been posting the next few charts pretty much every week all summer. I added notes and lines in yellow to mark the key Fed announcements. These lines help us look at the market's reaction. It's no coincidence the bear market started at the beginning of the year when the Fed warned about needing to raise rates to fight inflation.
We can also see the "celebration" following the first 3/4% rate hike back in June and especially following their July 3/4% rate hike. We are now back to where the market was on that last rate hike.
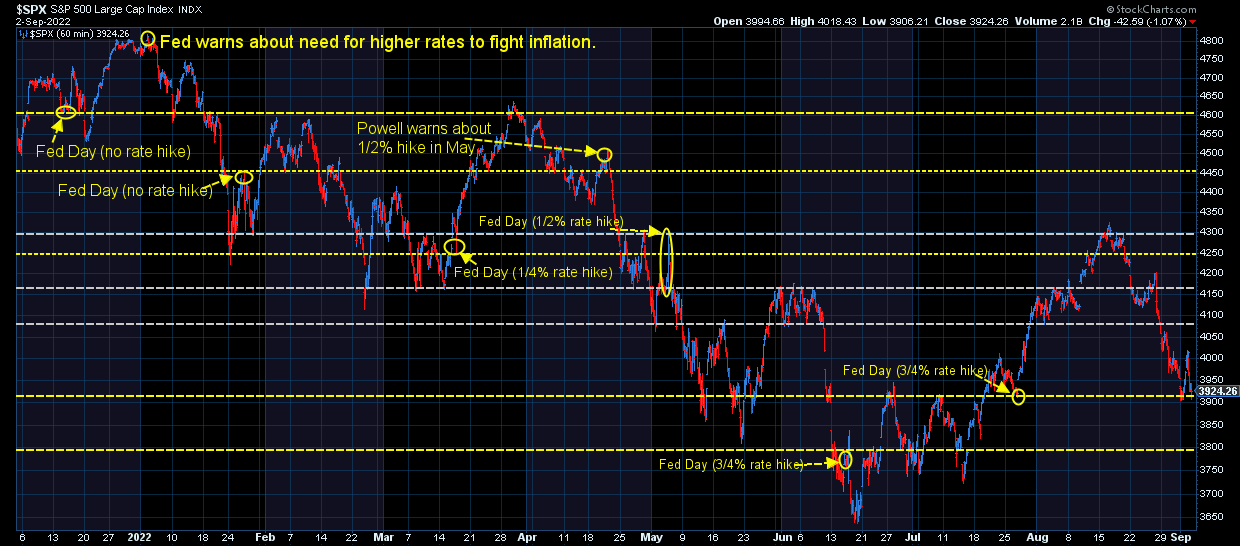
What's interesting is the duplicate pattern following the first rate hike and the last rate hike. These squares are the exact same size.
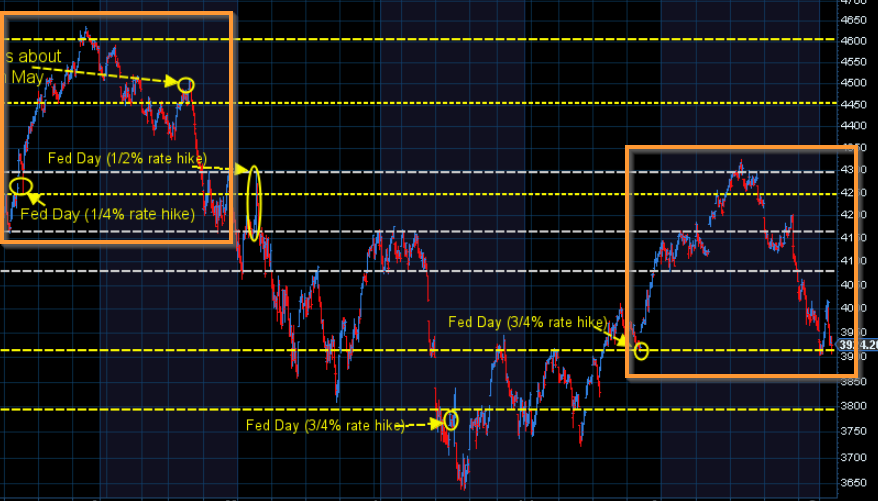
As you would guess by our tagline, "a behavioral approach to investing", we firmly believe (based on decades of academic research and 30+ years of managing money) that human emotions drive the market and those emotions show up in the stock charts. The "euphoria" following the rate hikes under the assumption the Fed was going to be able to stop inflation was followed by disappointment when reality set in.
If we track the same pattern, we should expect some consolidation followed by an attempt to rally and then an even larger drop. Stay tuned.
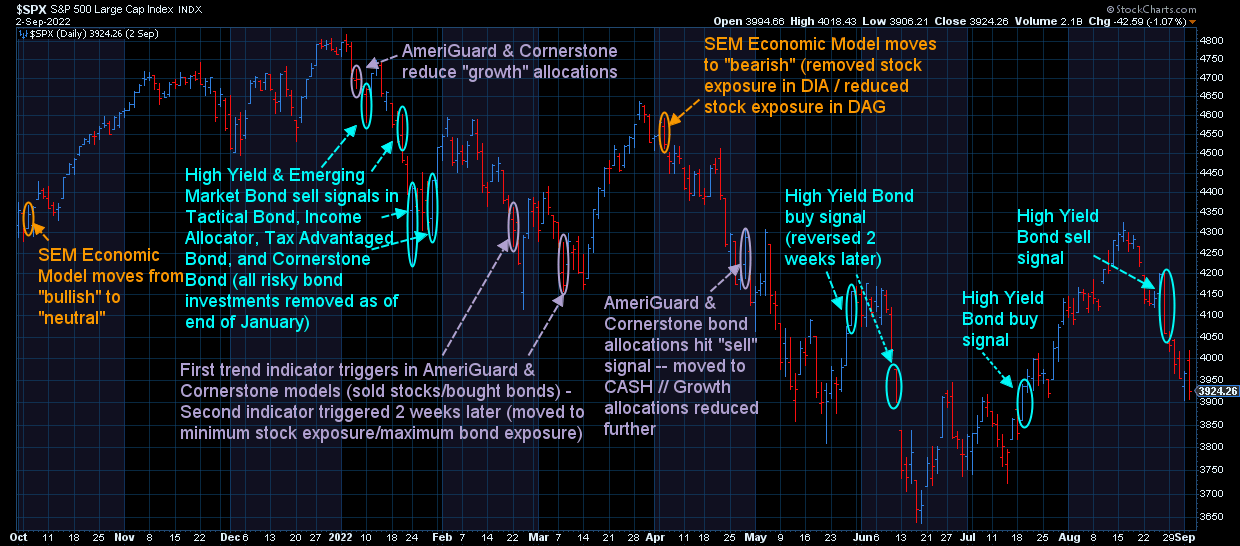
Our models remain as bearish as each allows. This chart illustrates when we've taken action in the various models and trading systems.
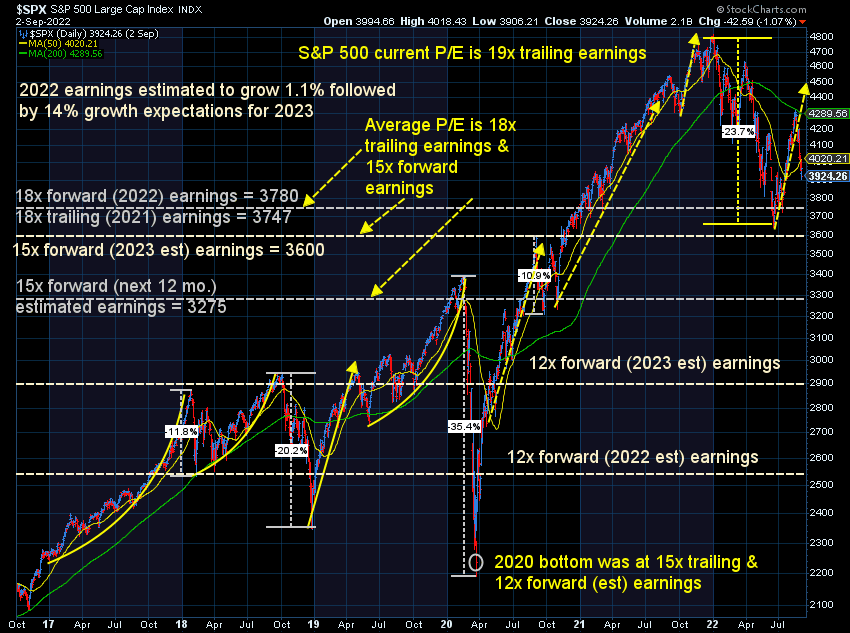
The next chart is a busy one, but an important one. I continuously hear Wall Street bulls attempting to argue that stocks are "under valued". Based on "average" valuations, stocks are still overvalued. The biggest problem is nobody knows what earnings will be this year and beyond. Estimates have dropped from an expectation of 7% growth in 2022 down to just 1% growth. Of course the perma-bulls believe this means 2023 will be even better than previously thought. At the beginning of the year estimates were for 10% growth in 2023. Those are now INCREASED to 14%.
Subjectively I wouldn't get close to excited until the S&P was at least down to 3275. 2900 would be even better. This would put the S&P at the same valuations we saw at the bottom in 2020. Most bear market bottoms occur around 15x trailing earnings and 12x forward earnings. That's 17-26% lower from here, which would align with the losses of the "last 1/3" mentioned above.
Turning to interest rates, the bond market continues to not be happy about inflation and/or the prospects for the economy. Long-term bond yields hit a short-term bottom at 2.53% on August 1, just a few days after the Fed's last meeting.
The bond market is doing more work than the Fed in terms of slowing speculation, growth, and inflation. This is having an impact on the housing market and could filter through to the private equity market and the rest of the financial system.
There will be easier times to invest. The most important thing right now is to conserve as much capital as possible and not let our emotions get the best of us (up or down).
Don't miss out!
For the past month we've been branching out our social media posts to short-form videos. We are attempting to stay in front of trend changes in technology in our mission to provide common-sense financial education and analysis.
Among the handful of videos last week, we addressed some questions surrounding the student loan forgiveness program. Check it out here:
@finance_nerd more on student loan forgivness. @
♬ original sound - finance_nerd
If you're on either platform, you can follow us here (and look for a "Musings Minute video later Tuesday morning):


