
Is the recession over? Is the economy back on a growth track? Is the resilient consumer going to be able to keep the economy growing? Is inflation heading down? Is the Fed nearly done raising rates? Is the coast clear for stocks?
Based on the market action last week, the answer to all of these seems to be a resounding "yes". To that I say, "not so fast."
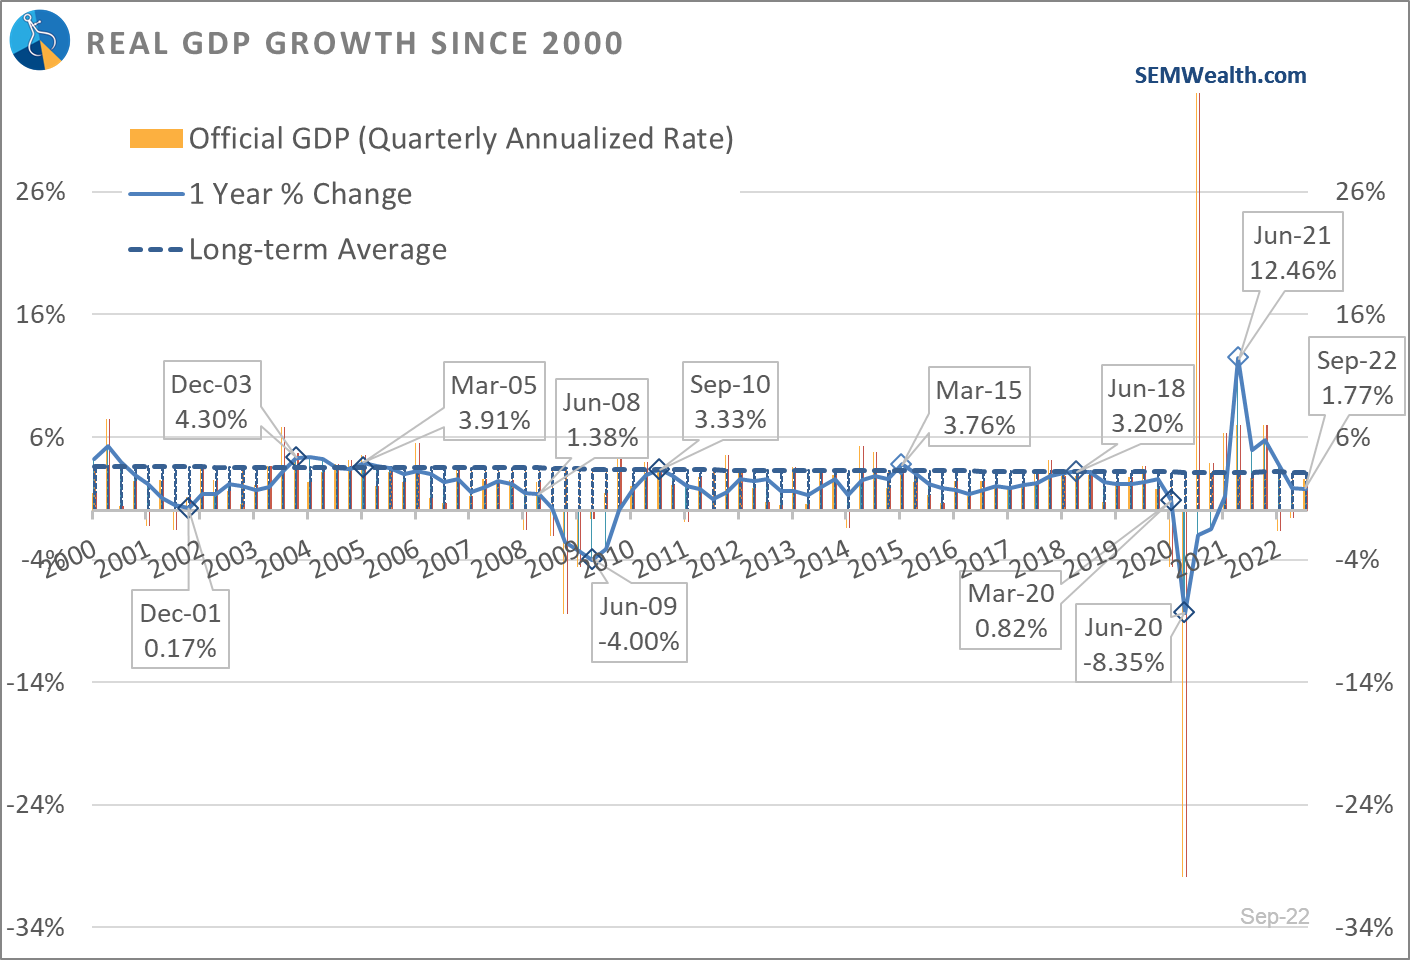
While GDP came in higher than last quarter economic growth is slowing compared to a year ago. Just as too much inventory led to a contraction in the "official" number the last two quarters, slow rebuilding of that inventory led to the "official" number increasing. The reason I put the " " around official is because it is the only economic or financial number I'm aware of which is annualized based on just the last 3 months rather than how it's done the past year. I frequently show this chart to put growth in perspective.
The economy is slowing beneath the surface. This isn't a new phenomenon. This chart shows how our economy has struggled since 2016.
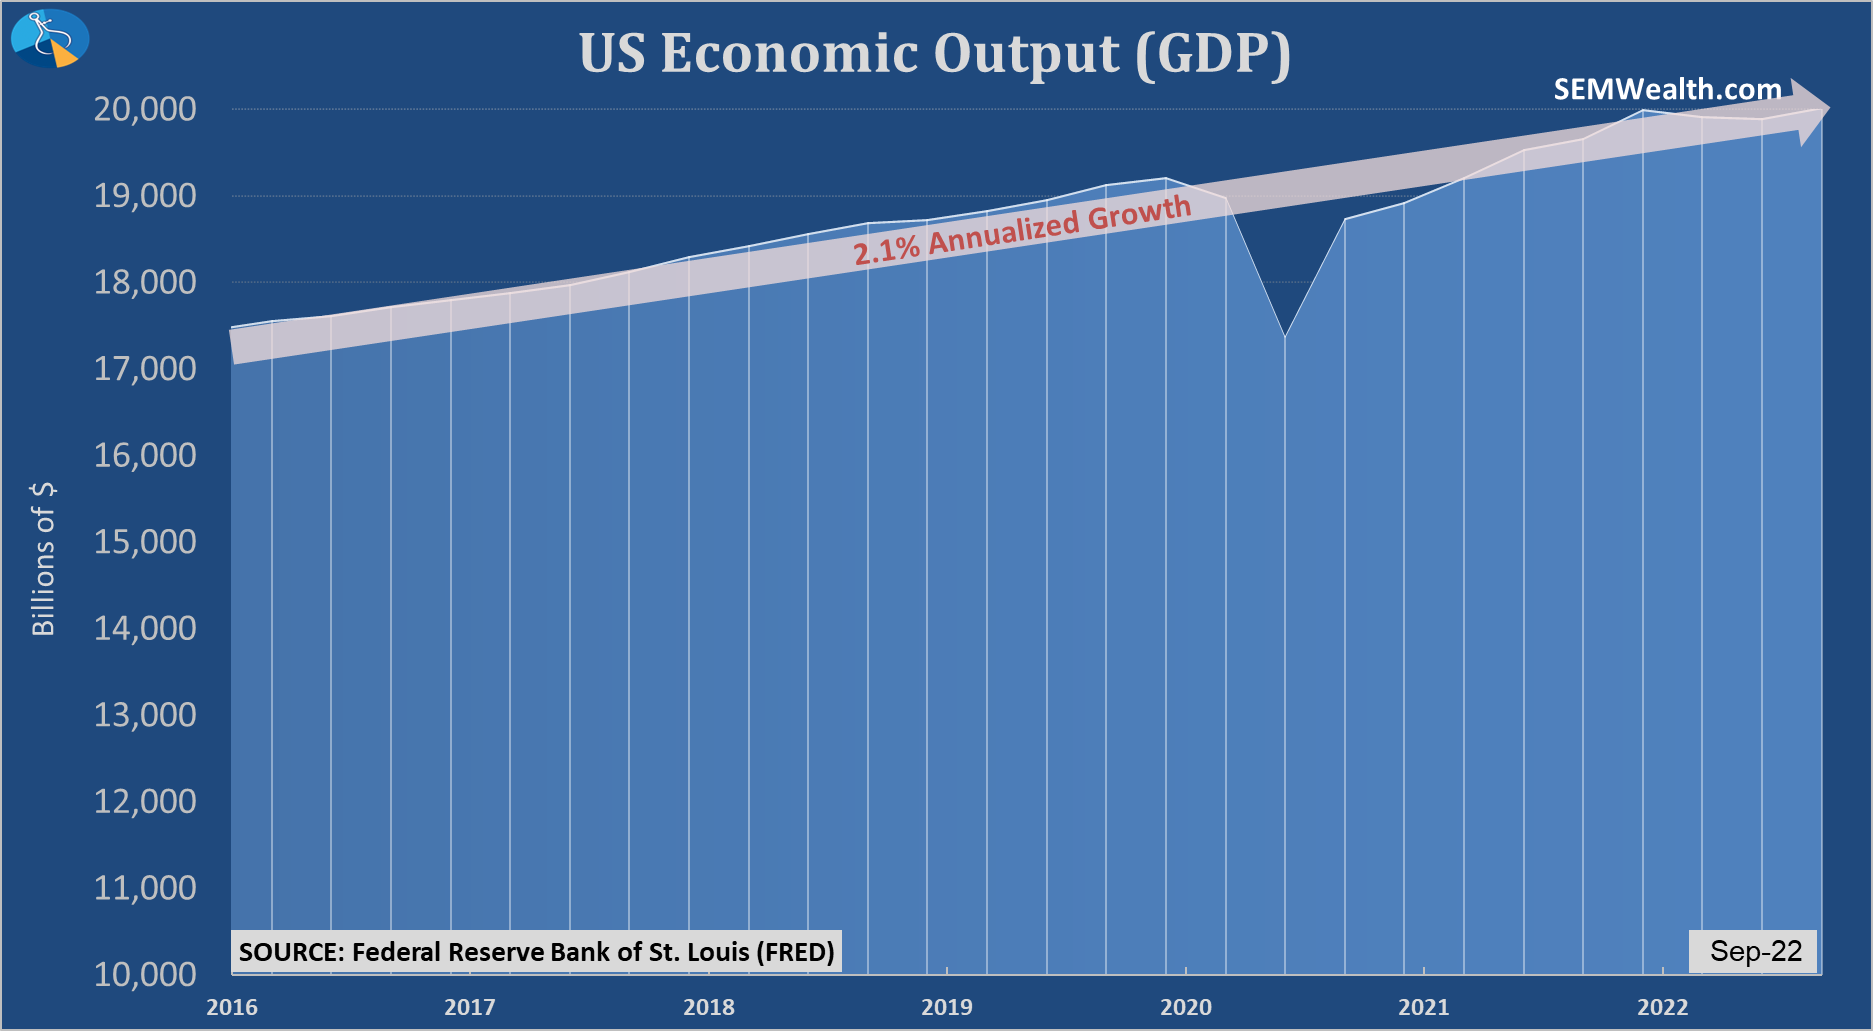
The long-term average is 3%. We've barely grown above 2%. We can't blame COVID or one political party. Growth was well below average pre-COVID and it continues to be well below average.
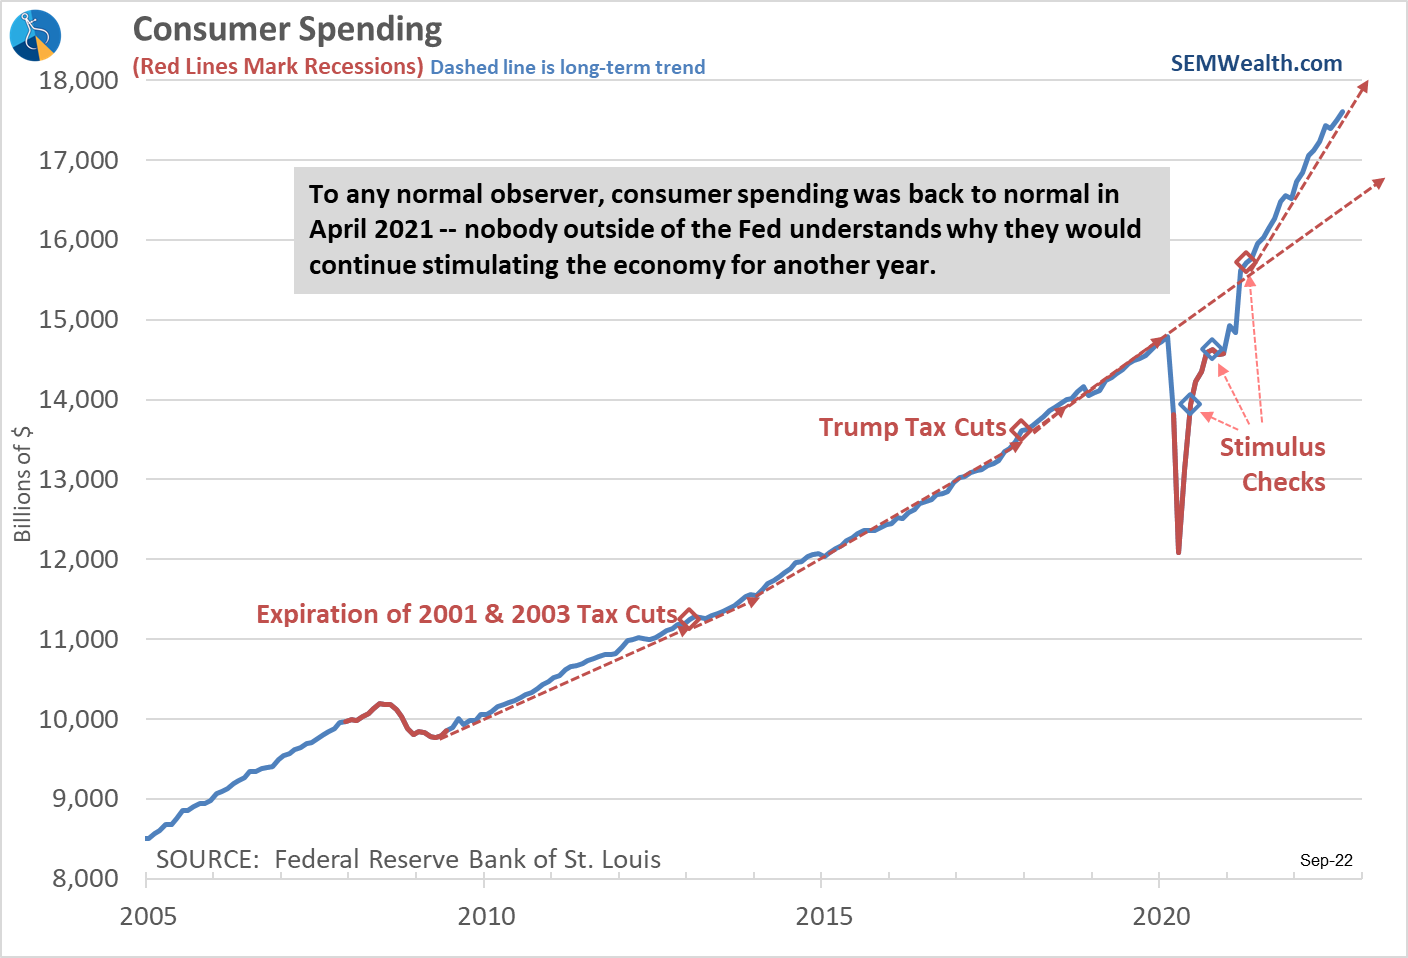
The primary driver of our economy has been the consumer. This charts puts in perspective how strong consumer spending has been compared to the pre-COVID levels. We sent way too much money to far too many people who absolutely did not need it. They continue to spend their excess savings at a record pace. That may be coming to an end soon.
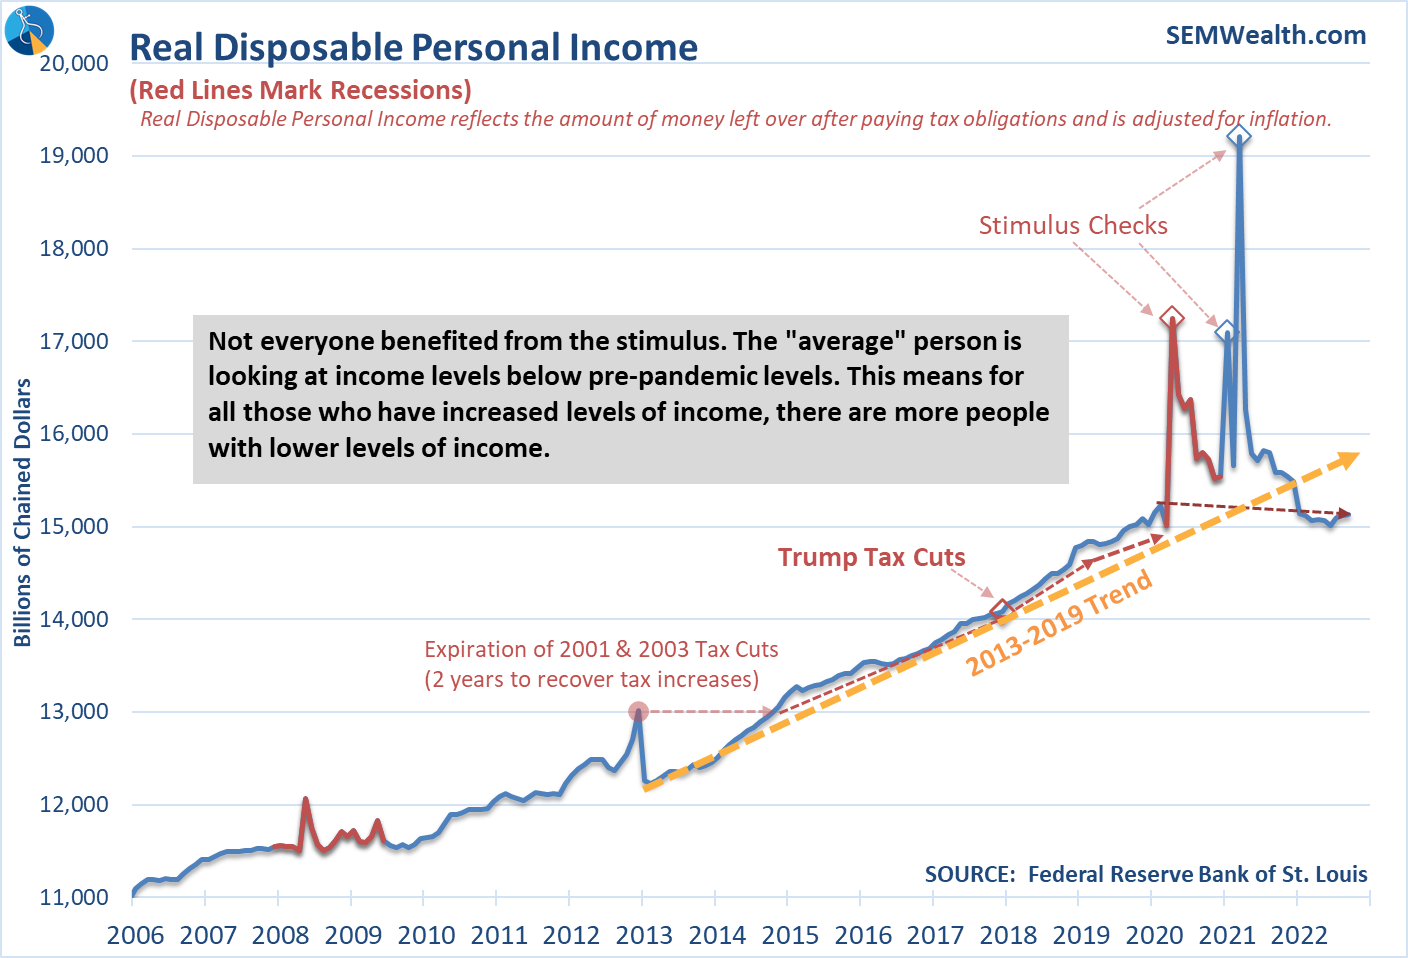
When you account for inflation, the average American is now making less money than they were before COVID.
Our country continues to rely on far too much debt. This chart illustrates just how much. The dashed line is our economy. Our total debt exceeded the economy back in 1985. Even though the financial crisis was literally caused by too much debt, it actually increased our reliance on debt to stimulate growth.
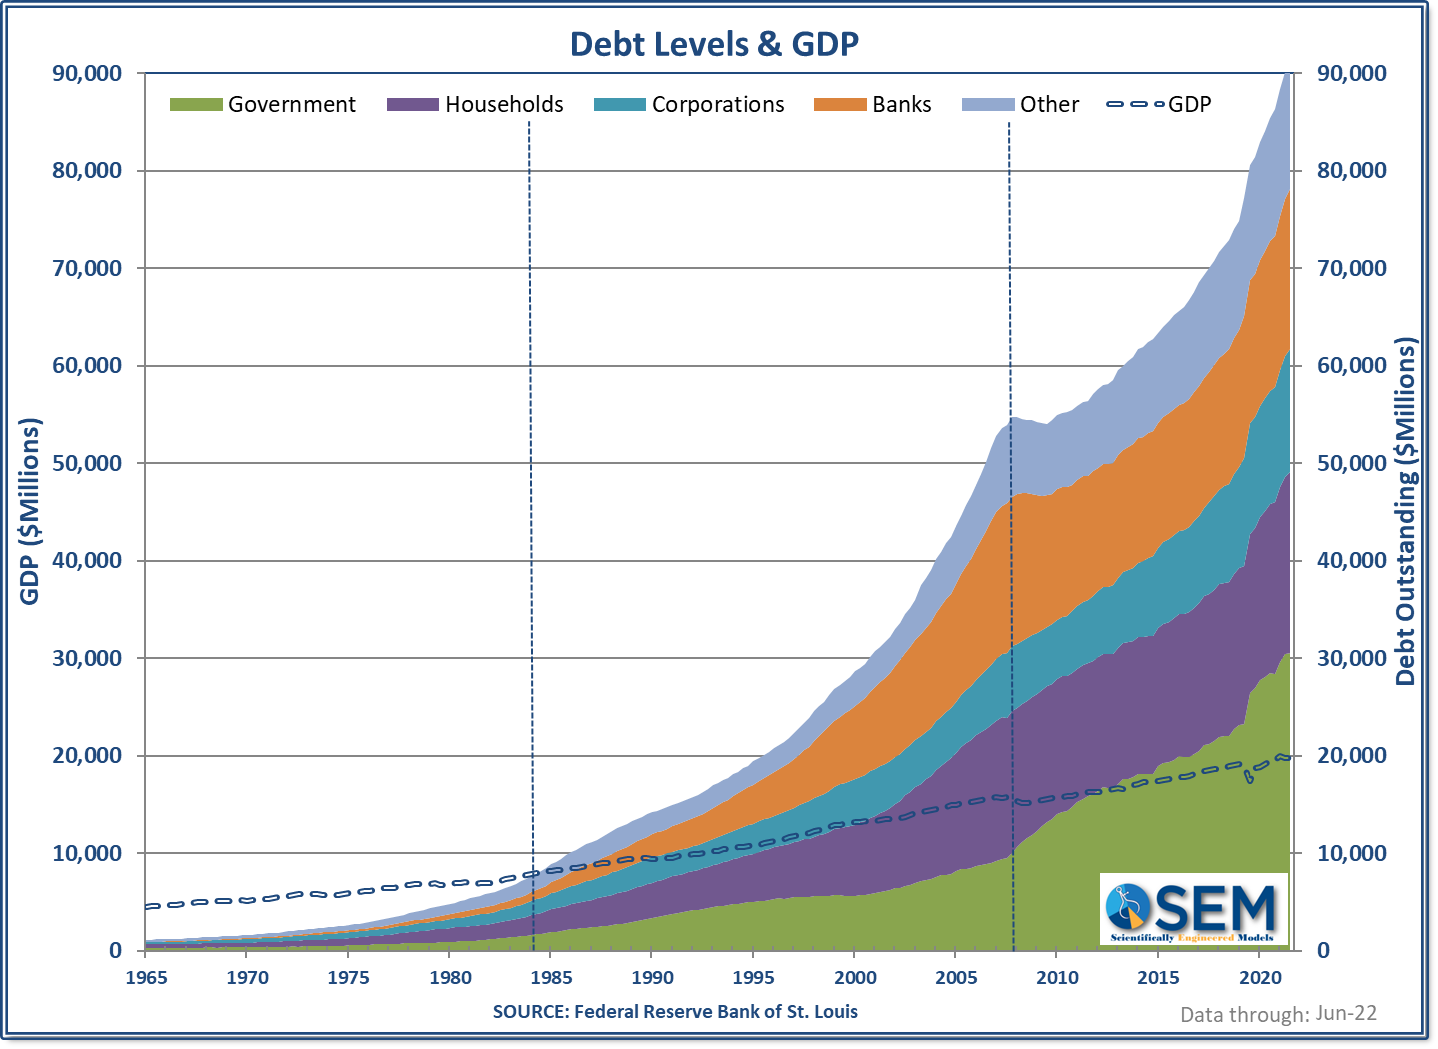
Remember, you cannot create money out of thin air. The excess money the government sent Americans to spend is now a liability. Until this year the Federal Reserve has been buying most of that debt, but now we have runaway inflation and they are going to have to hike interest rates and sell off their government bonds until it's uncomfortable for the economy. Debt at its core is future spending pulled forward to the present. As you pay back that debt, you need higher growth or you have an economic slowdown. Americans have spent the debt so fast it sparked runaway inflation.
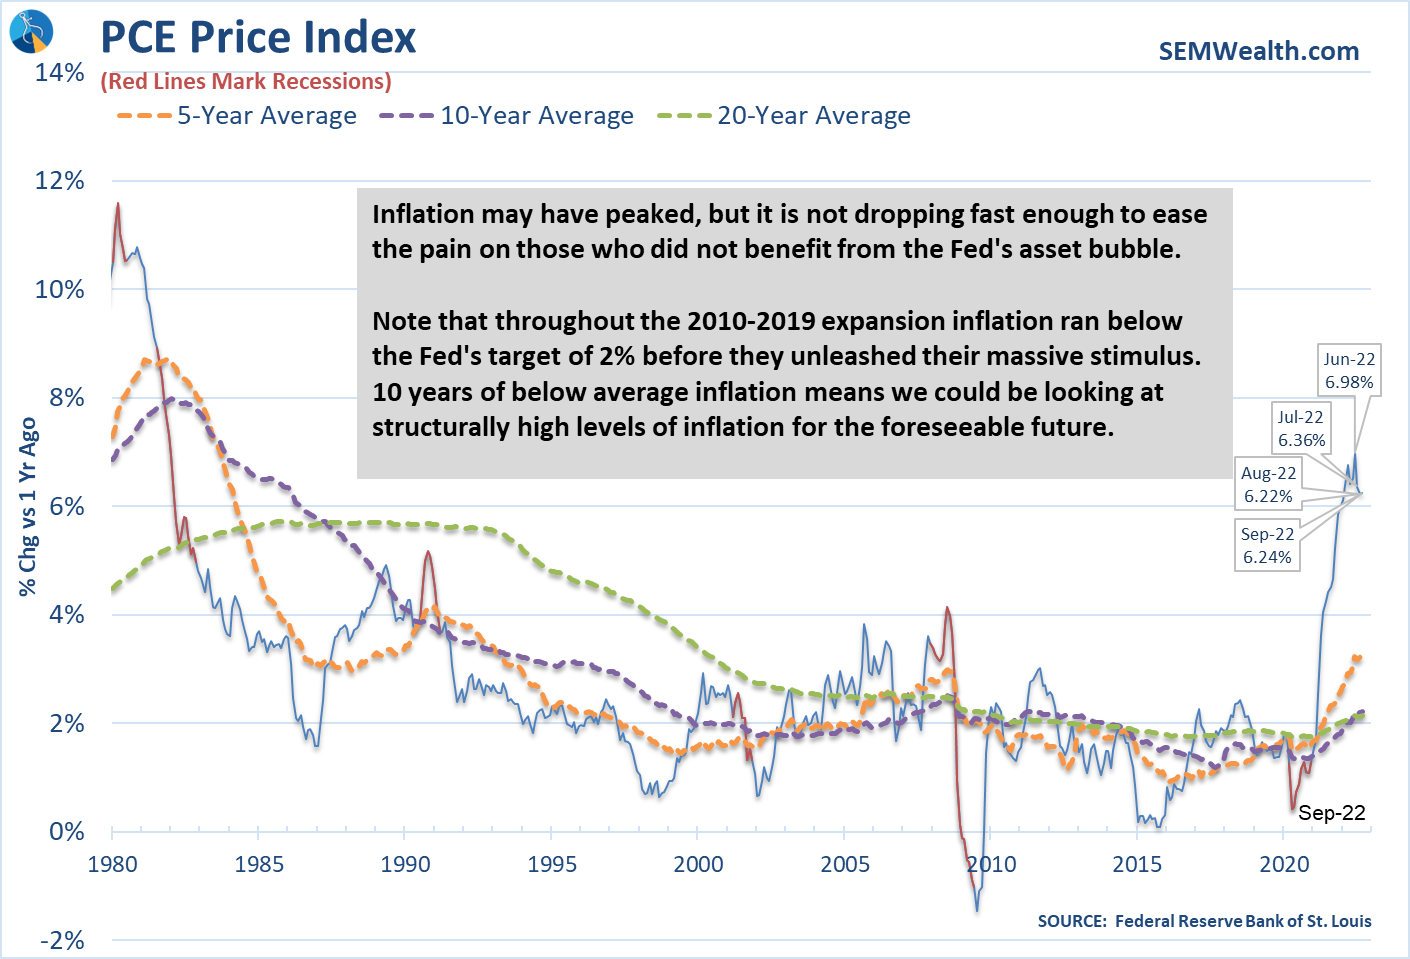
The data last week included the Fed's preferred measure of inflation, the PCE Price Index. It actually increased in September.
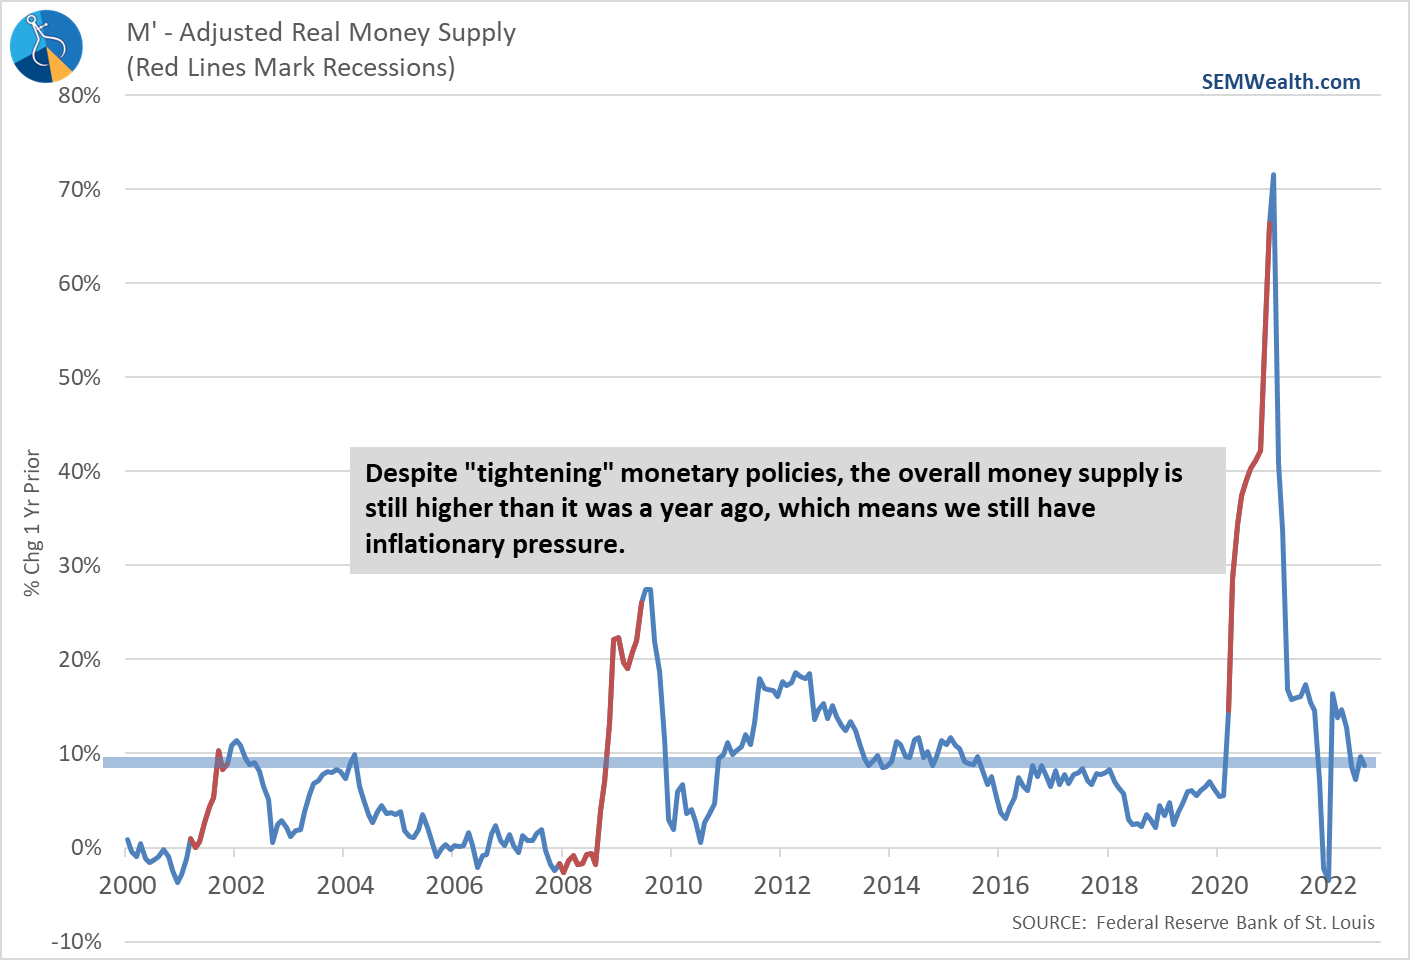
The Fed has barely done anything (relatively speaking) to slow things down. Take a look at the Money Supply. It is still nearly 10% higher than it was a year ago.
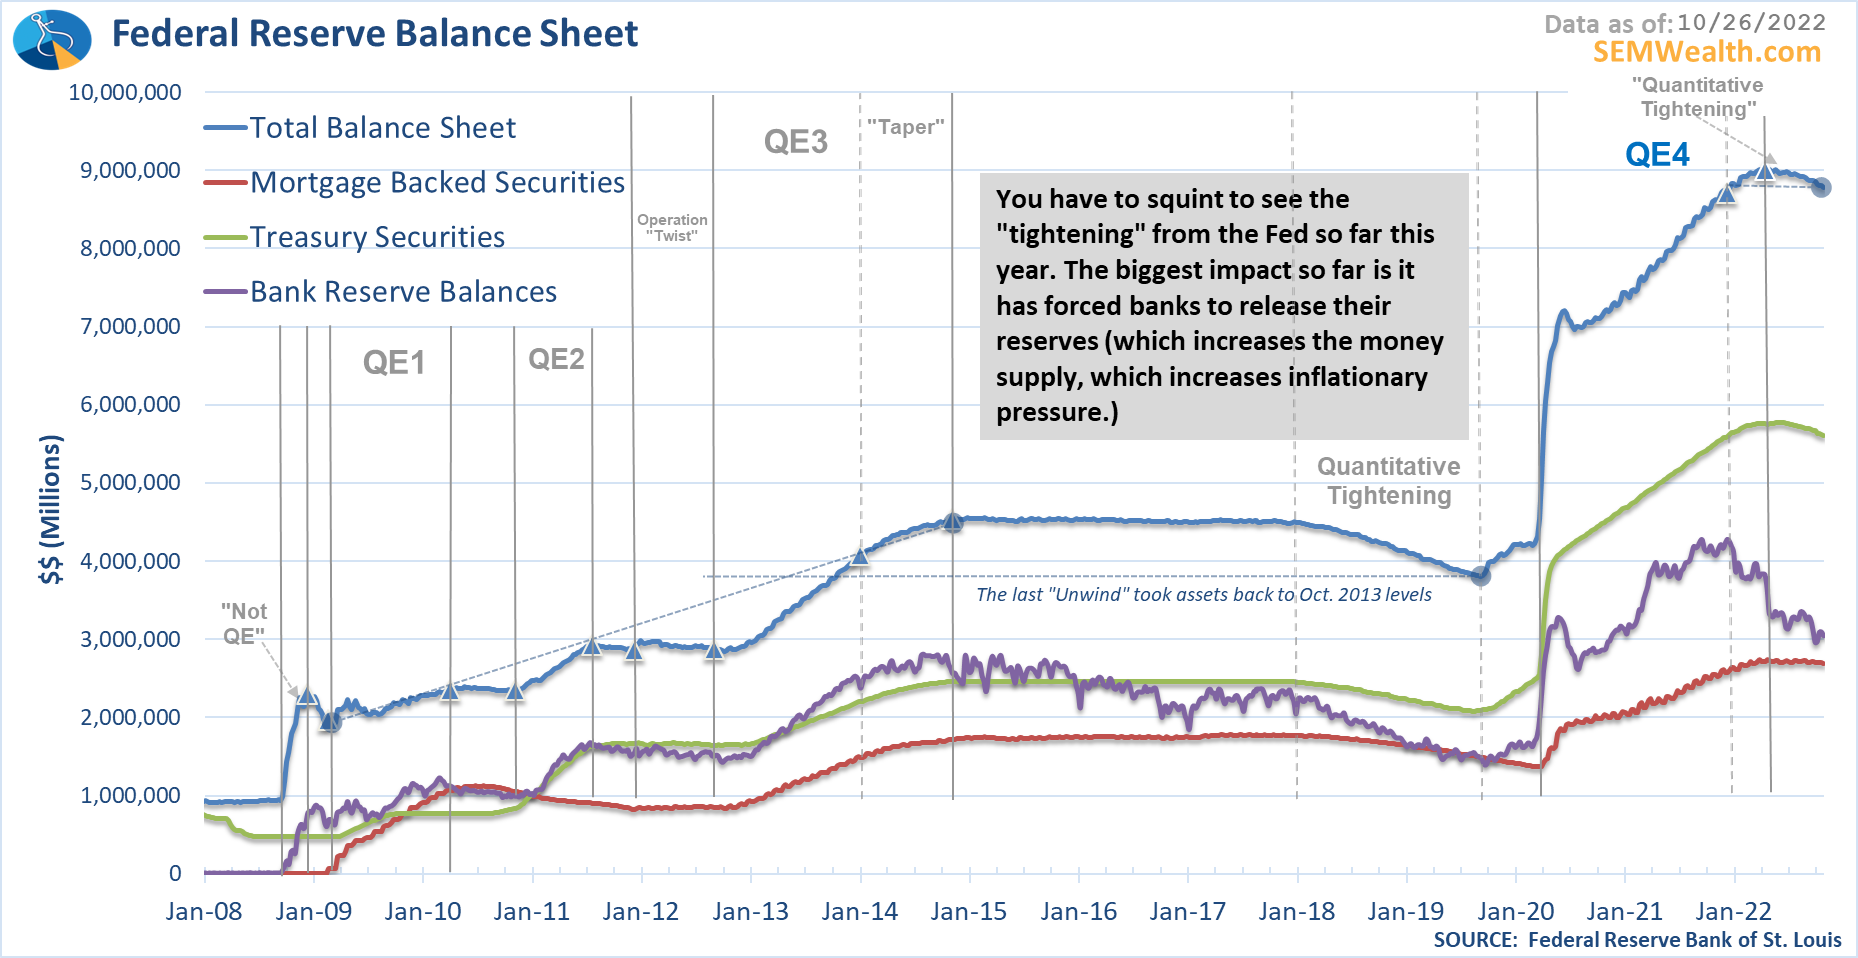
And their balance sheet (the blue line below) remains much higher than it was last year. Also note how last time when QE ended, they did not begin unwinding it for 3 years. This time around they were forced to halt QE and immediately begin unwinding.
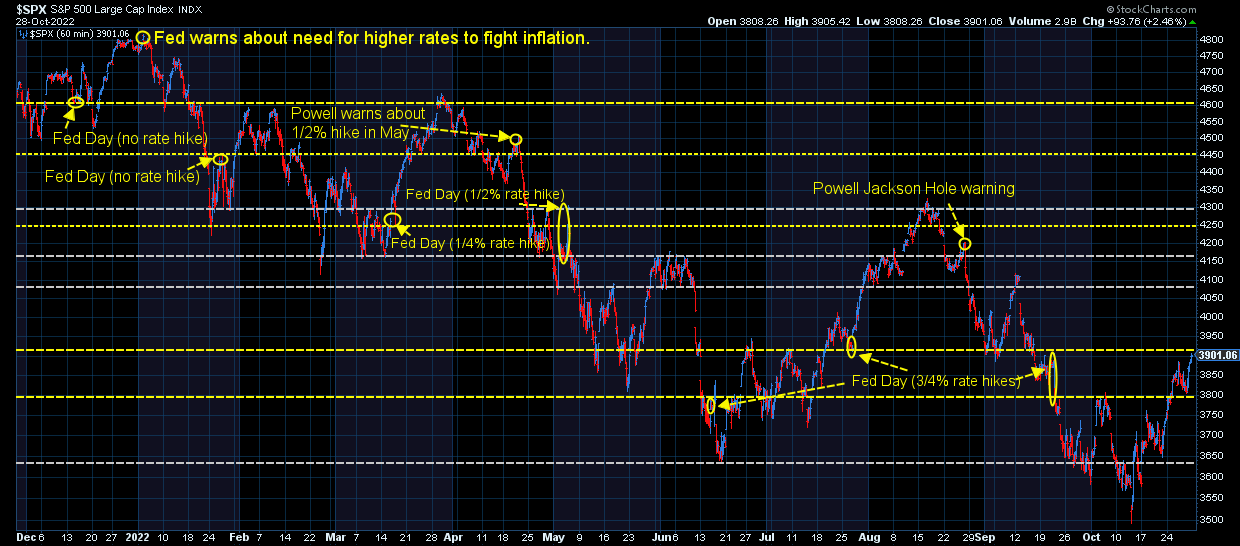
For whatever reason, interest rates backed off a bit last week and stocks rallied. The economic data does not justify this move. Instead, it was generated by hope the Fed was going to "pause" their rate hikes. As we've discussed constantly throughout this bear market, during the last two bear markets the Fed was actually CUTTING rates and printing money. It still didn't stop the recession or the severe losses of the bear.
Even if the Fed were to stop hiking rates today, we would still likely be heading towards a recession. That's what the data continues to tell us. We'll have a full update of our economic model next week, but here is what it looks like currently. The blue line continues to move lower, which is bad news for those betting on no recession.
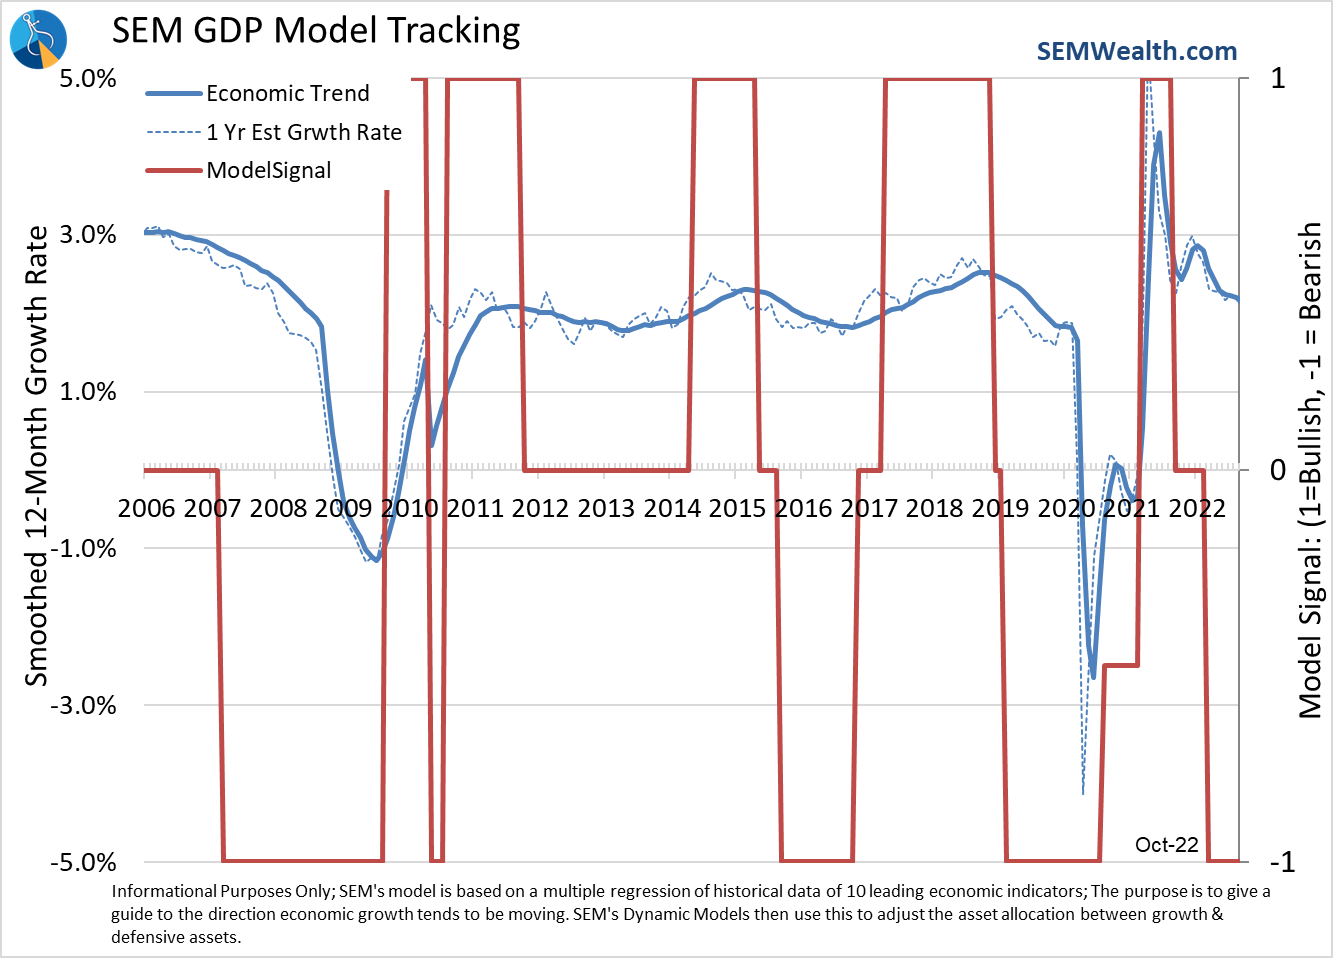
The economy continues to slow which is bad news for stocks. Prices have not come anywhere near pricing in the prospects of a recession. Each rally needs to be looked at as a chance to lower the risk in a portfolio rather than proof the worst is over. Stocks are back to where they were the last time the Fed met. Eventually the market will reach a "washout" point. Until the DATA says otherwise, we should assume this rally will not last. Enjoy it while it lasts. Don't get sucked into it. Sell positions which are too risky for your long-term plan.
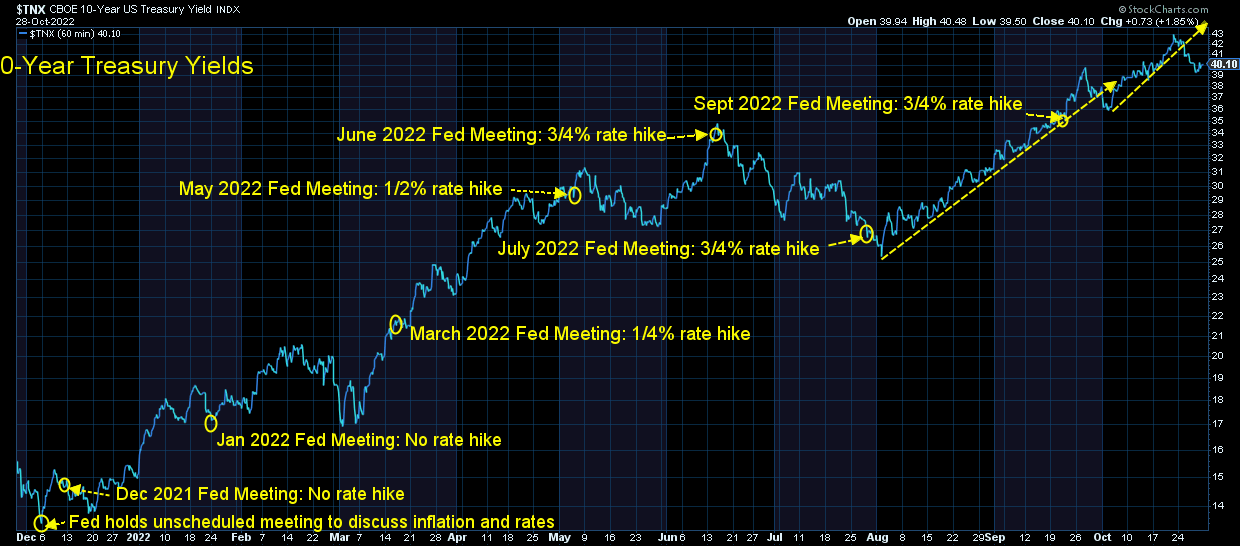
Bonds are a different story. Our models remain cautious on bond yields, but we have begun nibbling on high yield bonds in our Tactical Bond model. Subjectively I don't see long-term Treasury yields going much higher. This isn't because I'm optimistic about the Fed getting things right, but instead believe the coming recession will take care of inflation and drive long-term bond yields lower.
As I said a few weeks back, we are through the seasonally worst time of the year. This bear market rally could run a bit. I'd still be looking to "de-risk" any accounts which were overexposed to stocks. Most of those are investors who jumped into stocks during the last half of 2021 simply because stocks seemed invincible back then.
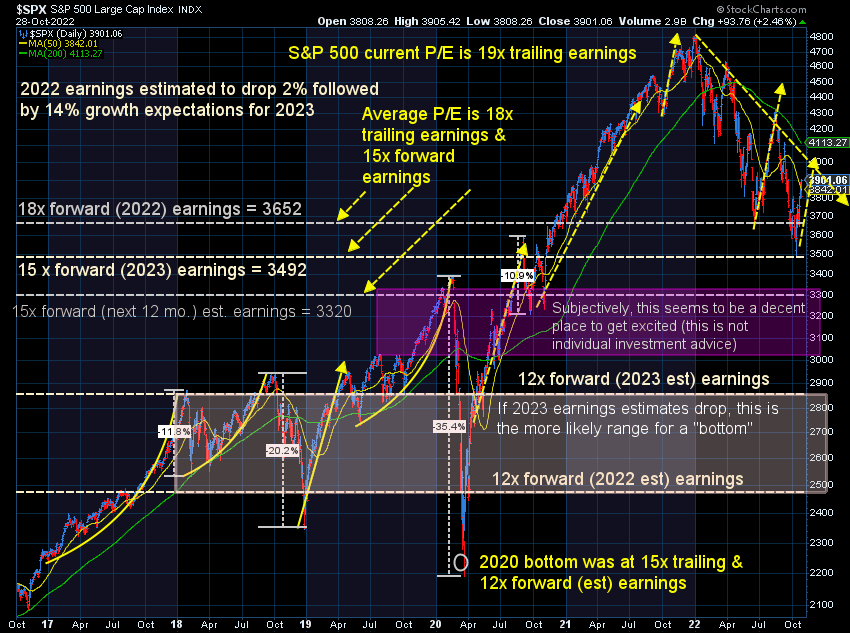
From a valuation perspective, stocks are nowhere near attractive following the rally the last few weeks. The eternal optimism of Wall Street has always baffled me. We started the year with analysts expecting an "average" year in 2022 of 10% earnings growth followed by a 13% jump in 2023. Throughout the year as reality set in, the expectations for 2022 earnings continued to decline. Right now the expectation is for a slight decline in earnings this year, but a huge rebound in 2023.
This is how Wall Street justifies the current level of stocks. Why we trust their expectations is beyond me. They have a terrible track record of getting it right, yet everyone seems to base decisions on what they say.
From our perspective, while we've started to nibble on high yield bonds, most of our models continue to say this is no more than a bear market rally. This means investors are likely to be disappointed again. Worse, it means we likely haven't seen the lows of the bear market. I could be wrong as could our systems. If we are, mechanisms are in place to find the most attractive places to invest all while keeping a close eye on the next catalyst for a market drop.
Follow us on Social Media
While the blog will continue to be the source for deeper dives into everything that is happening, we post a lot more short-form content to our social media channels. Some are funny, some are quick takes on that day's news, some are answers to questions we've received, and some are designed to educate. Regardless, if you're looking for some different financial content, make sure you are following us. Here's one of the videos we posted last week explaining what drives stock prices:
@finance_nerd Stock vakues can be confusing, but we’re here to help with this week’s #financialliteracyfriday! #financialliteracy #stockvalue #stockmarket101 #financemadesimple #finance101 #investingforbeginners ♬ Aesthetic - Tollan Kim


