
We wake up this morning with news of the 2nd largest bank failure in the history of our country. Interestingly enough, this is not being looked at as a major move by investors. After the failure of Silicon Valley Bank in March and the swift actions by the Fed, FDIC, and Treasury Department to stem the risk of contagion it was expected a few more fast-growing banks would also need to be given to the Wall Street banks. That's exactly what happened over the weekend.
The goal from regulators, the Fed, Wall Street, and investors seems to be to keep the system propped up as long as possible hoping we can work through the consequences of 40-year high levels of inflation and return to "normal". The focus so far has been losses on the Treasury Bond assets the banks purchased with their deposits. Those deposits were hit hard when the Fed finally got around to raising rates. What nobody is talking about (yet) is the commercial real estate related 'assets' (loans) on the books of the major banks.
This week the Fed meets again, and the question is whether or not they will "pause" their rate hikes. The expected outcome is one more 1/4% rate hike followed by an actual pause to see if inflation trends lower. The move up in rates hit technology stocks the hardest in 2022 (of course they went up the most in 2020 and 2021). The hope that the Fed will stop rate hikes has led to a surge once again in technology stocks.
Technology continues to drive the returns of the stock market. I stopped wasting my time trying to decipher earnings reports back in August of 2000. It became clear to me companies could tweak their earnings to nearly always be "better than expected" while hiding underlying weakness in their business as long as possible. What is more important is the perception of where earnings are heading overall. Based on the action last week, the technology sector's widespread layoffs are enough to keep earnings moving up even as overall revenue slows down.
While other industries garner attention, if you are an index fund investor as goes technology, so goes your returns.
27% of the S&P 500 is now comprised of Technology companies. We're getting very close to the all-time high of 29% set back at the beginning of 2000 (just before the tech bubble burst).
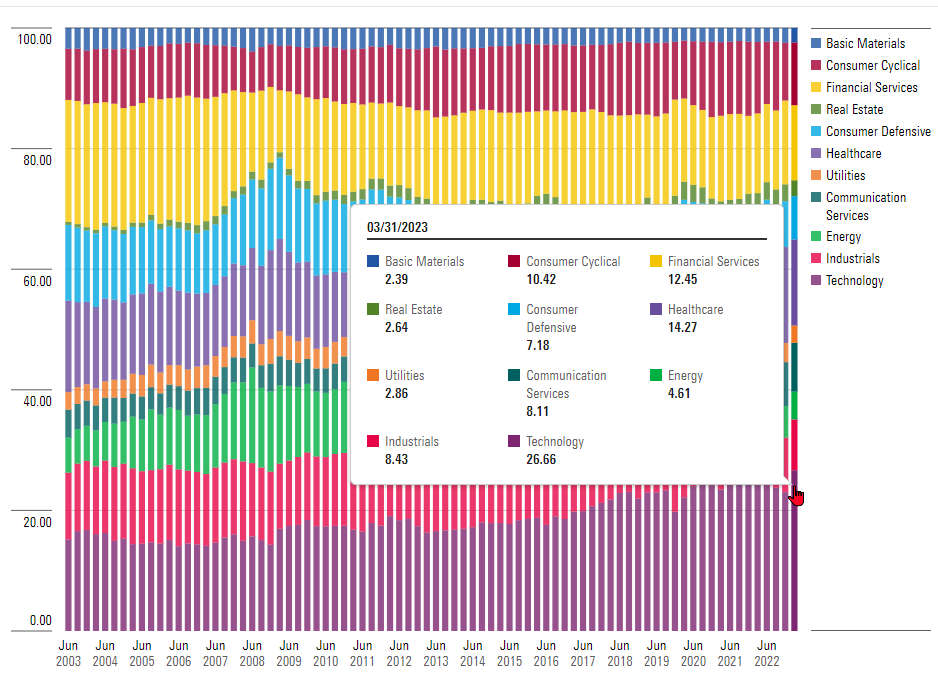
The next two largest industry allocations, healthcare & financial services combined have less of a weight than technology.
Last month we saw another new record for the S&P 500 – two stocks (Apple & Microsoft) now exceed 13% of the index. A record 28% of the S&P 500 is now allocated to the top 10 stocks. If you own an S&P 500 index fund you are not diversified.
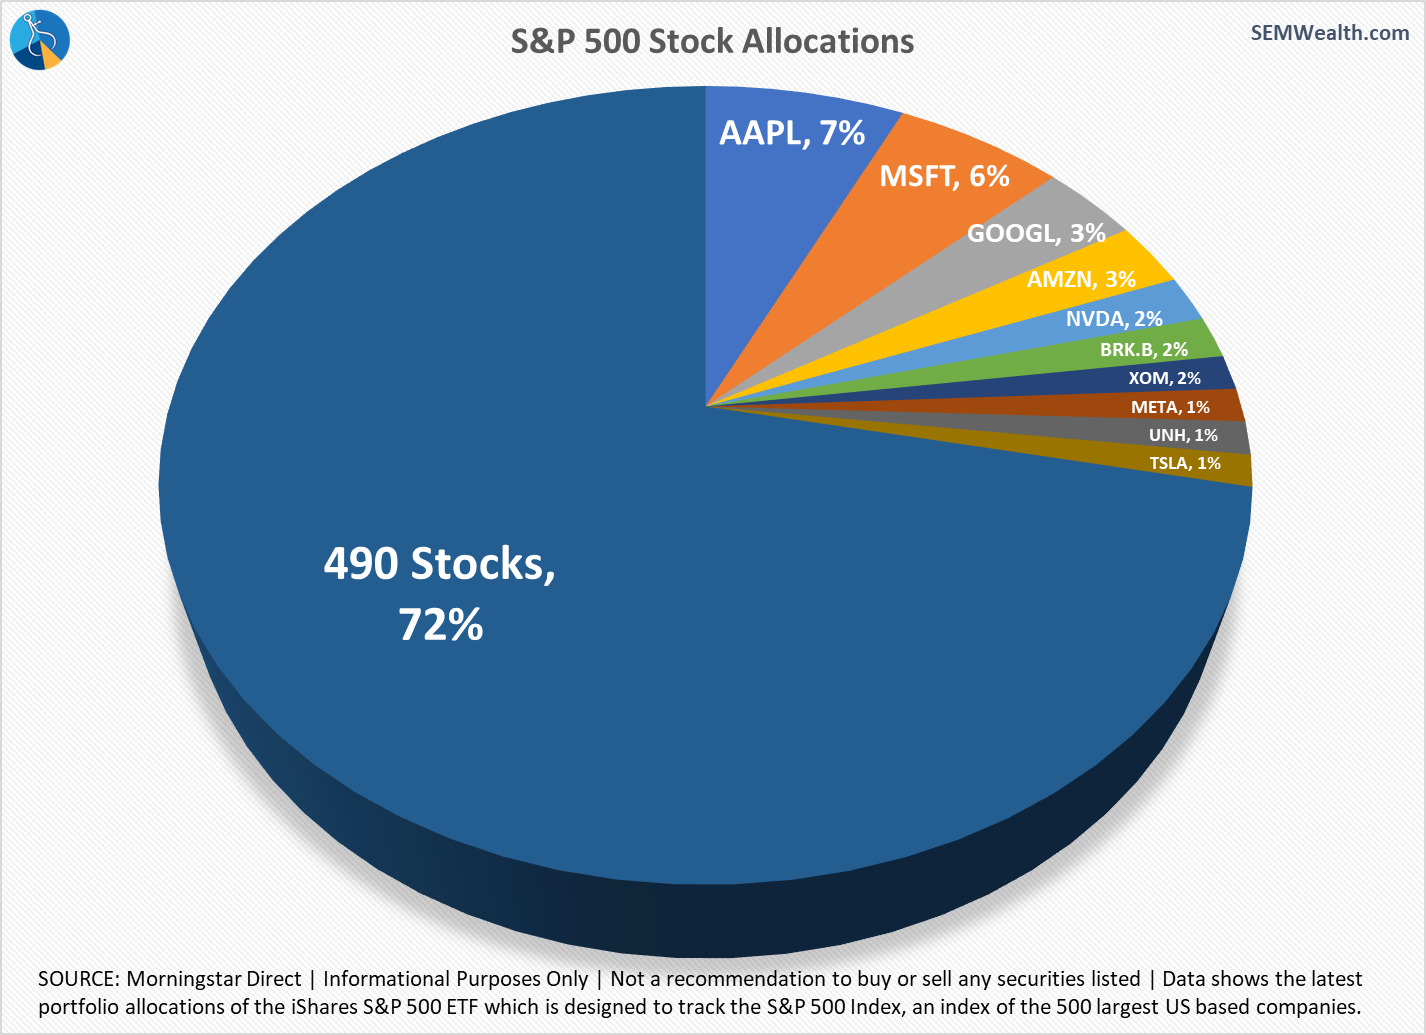
Warren Buffett's, Berkshire Hathaway, Exon-Mobil and United Health are the only non-technology companies in the S&P 500. The problem is the S&P 500 is a "capitalization weighted index". The more people who invest money in a particular stock, the more impact it will have on the returns of the index. When you combine that with all the money invested in index funds via retirement plans, you have a steady flow of money going into these stocks, which drives there performance even higher. This works well as long as money is flowing into the index funds. It works in reverse when it starts going out.
As I've said for the past month, the expectations for corporate earnings do not align with the underlying economic data. If the economy slows, earnings are likely to slow. Right now that is not priced into the market.
We'll have our usual full economic update next week, but it does not appear our economic model will be reversing from its 'bearish' signal any time soon.
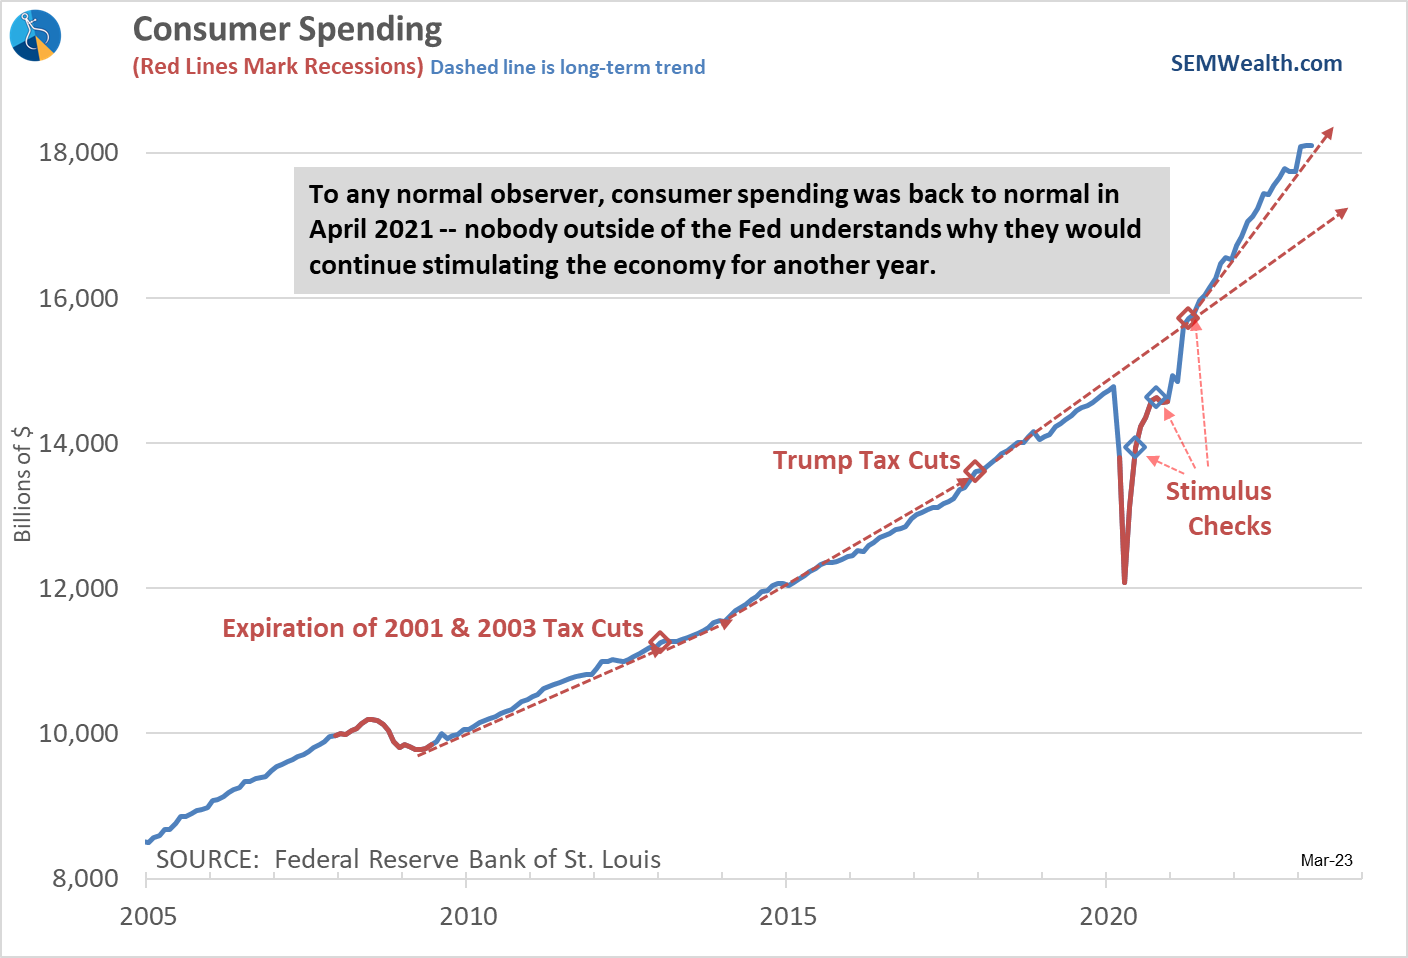
Probably the most surprising data point came from Consumer Spending, which was essentially flat month to month. Granted, this isn't the first pause in spending since the stimulus checks started pouring in, but it is something to watch as this along with the labor market were the only two indicators still positive on our economic dashboard.
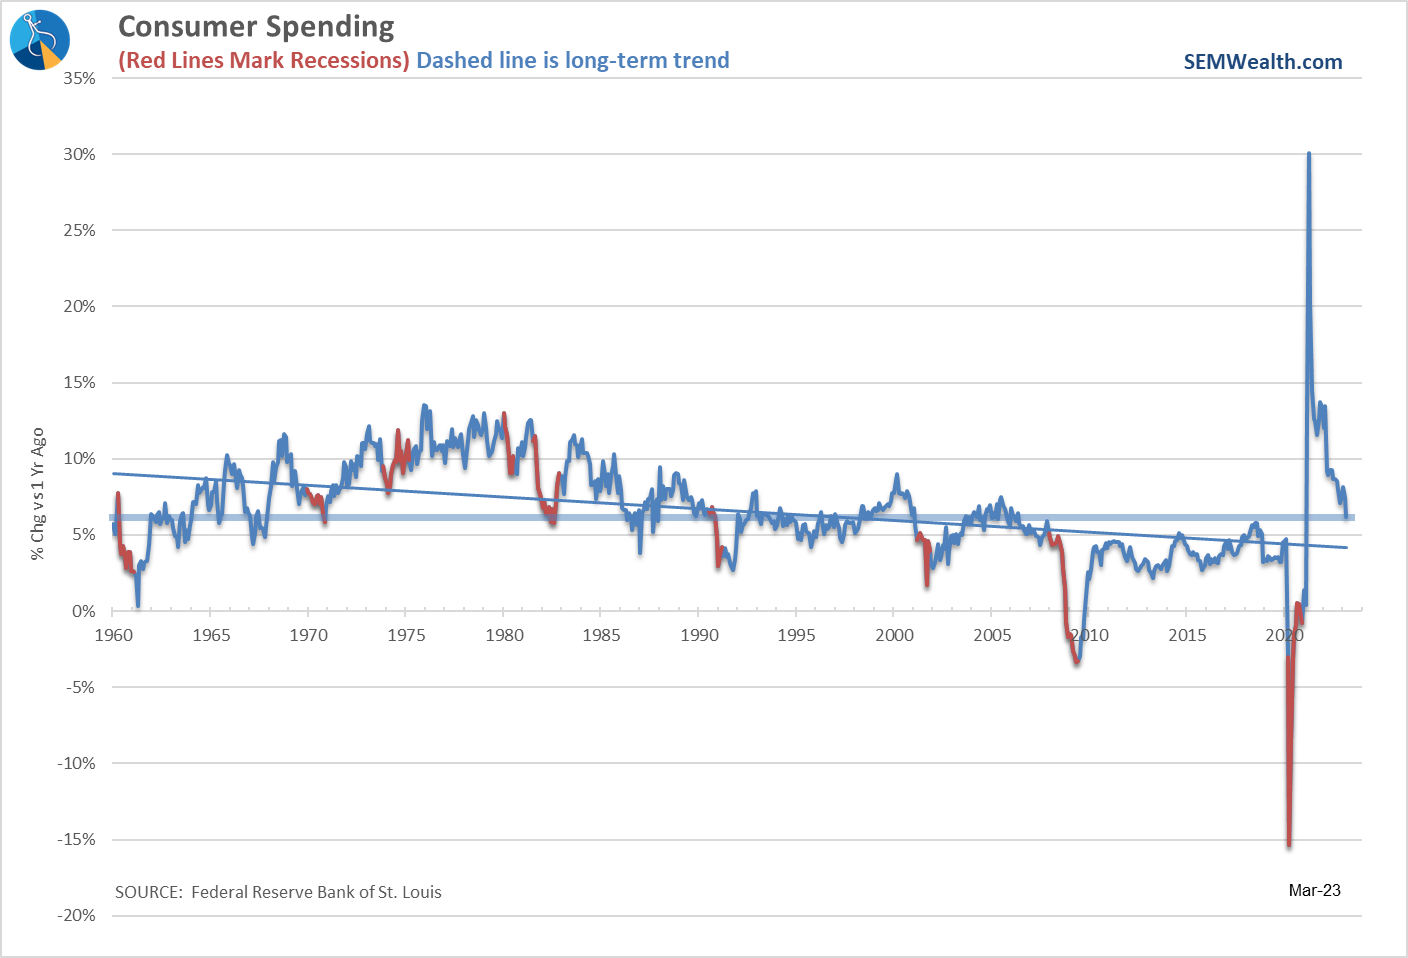
To keep things in perspective, the year-over-year change in spending is still running at the highest levels since the mid-2000s.
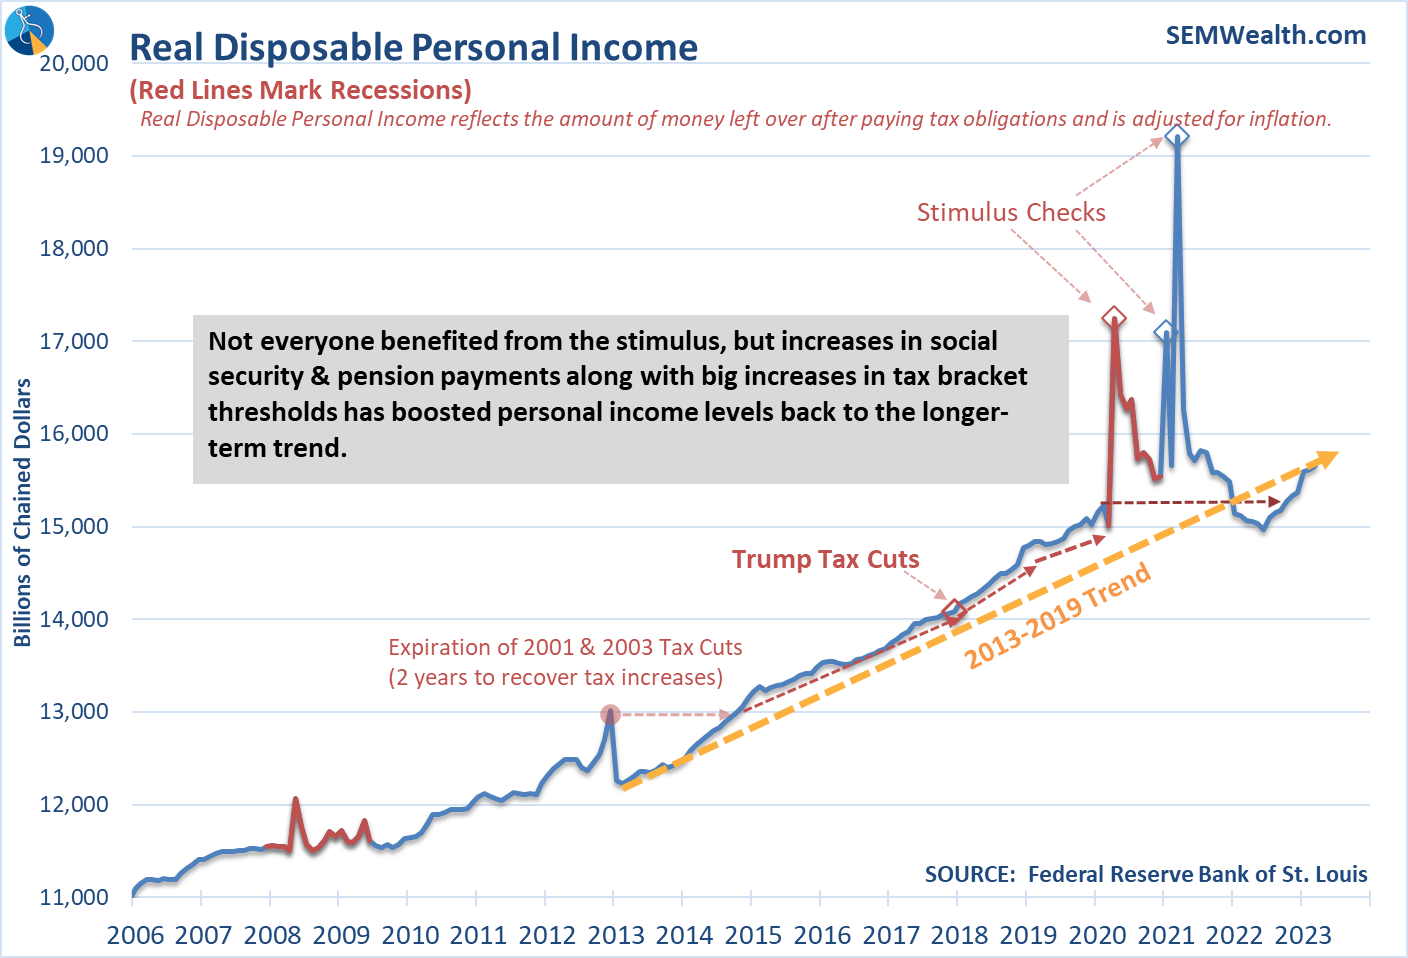
On the income side, we continue to see the benefit of the changes in tax brackets along with large increases in social security and pension payments to start the year. Income is back on the 2013-2013 trend line.
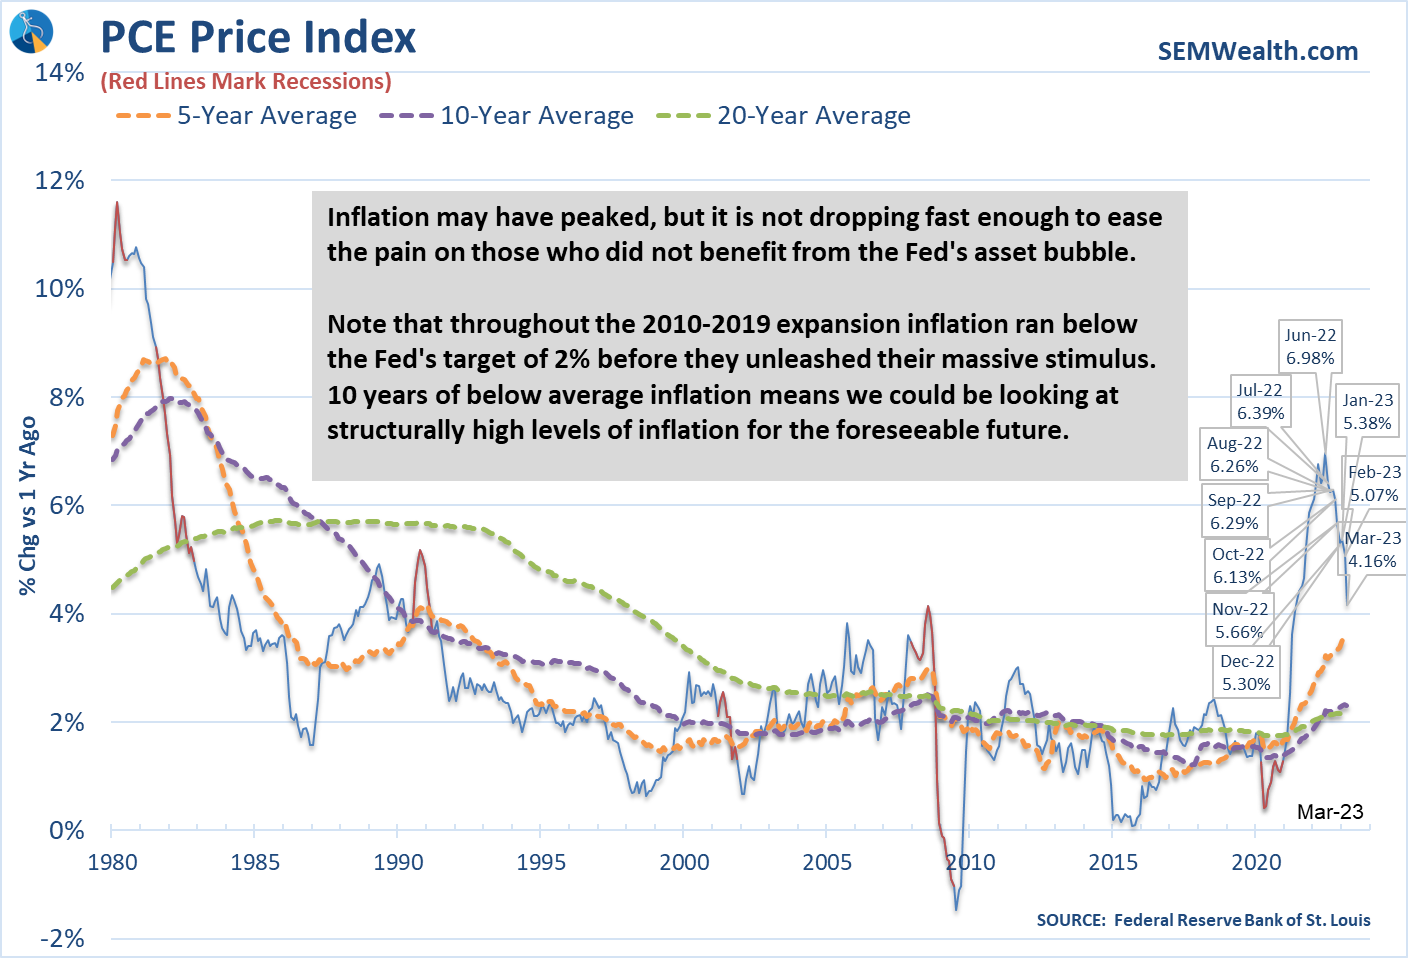
On the inflation front, the Fed's preferred measure shows a continued reversal in the rate of inflation. It is still more than double their "target" of 2%, but it is moving in the right direction.
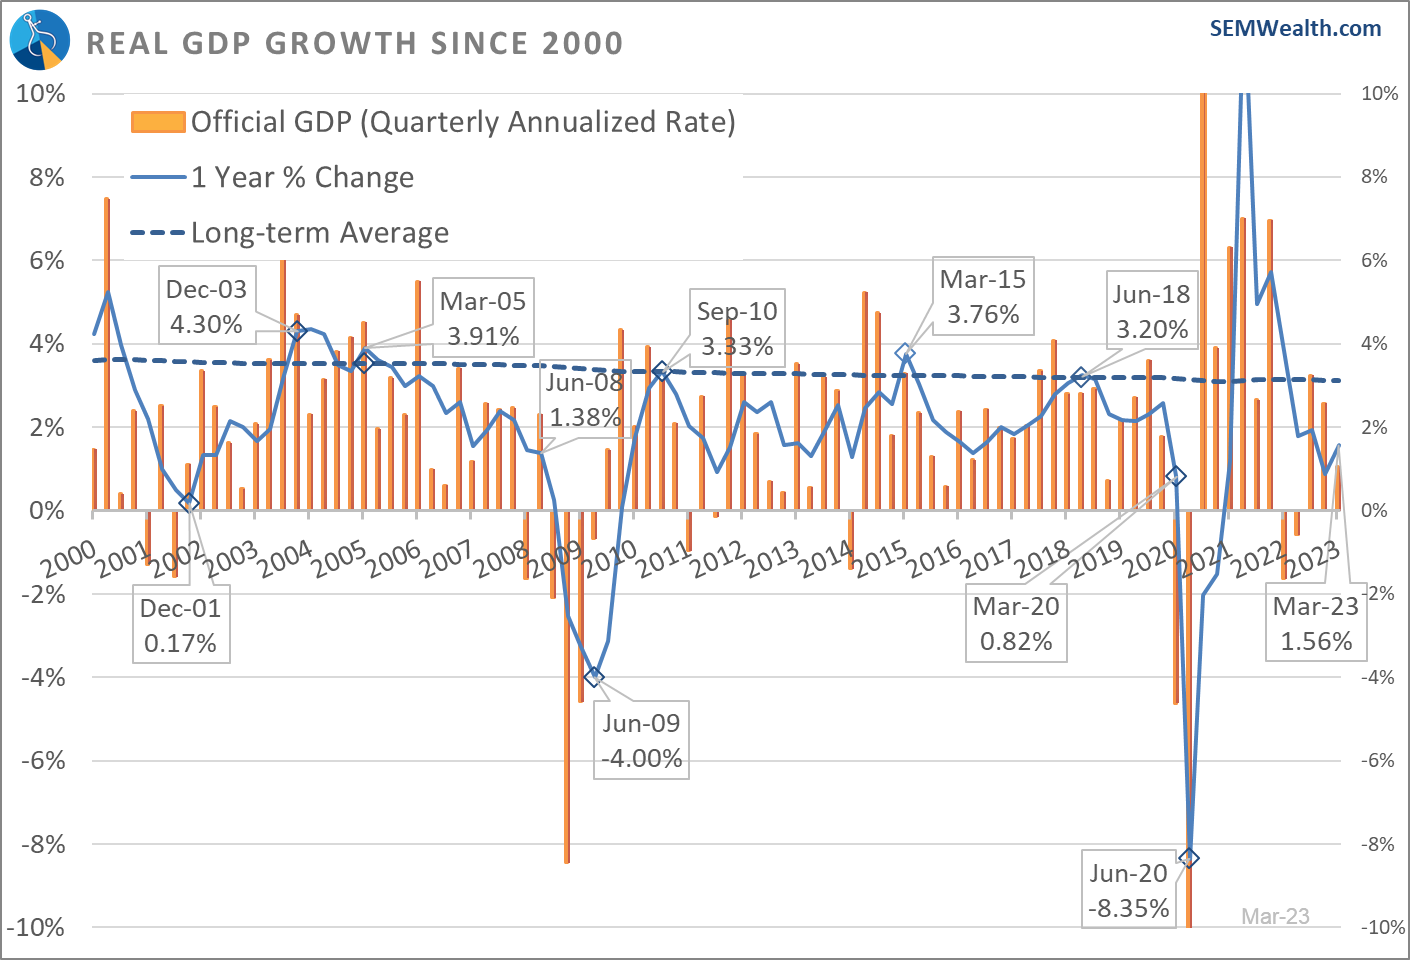
Overall, GDP is still positive both in the government's 'official' quarter-to-quarter number as well as compared to a year ago.
If I had to pick one chart that is most important in understanding the bigger picture when it comes to the Fed, interest rates, and recessions, it is this one.
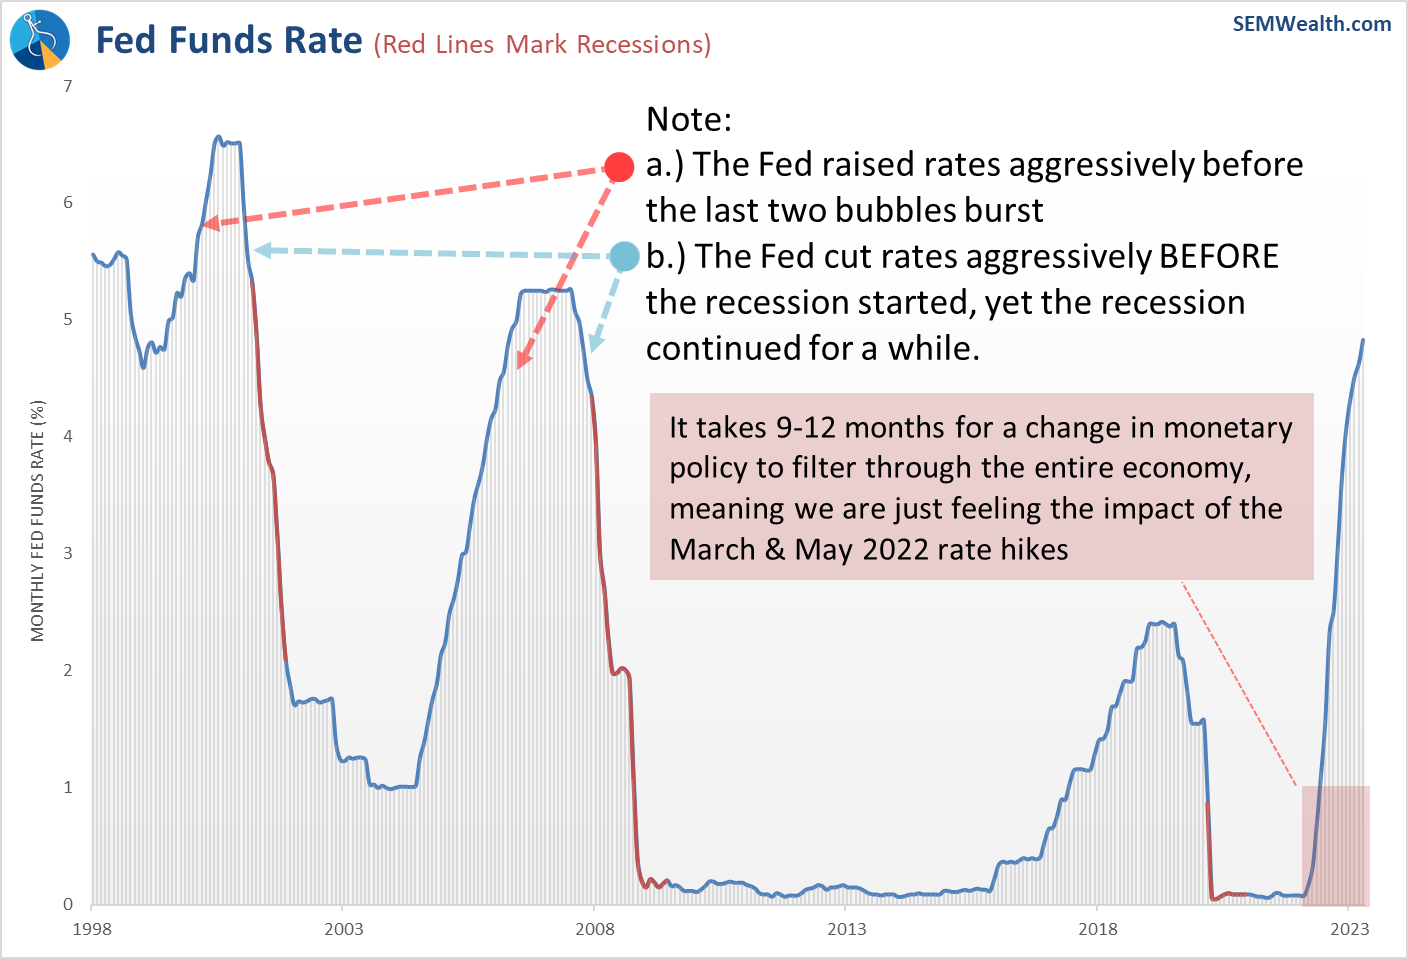
We have a whole lot of economic slowing coming and even if the Fed were to CUT interest rates, it's hard to make a case they can save the economy based on the data.
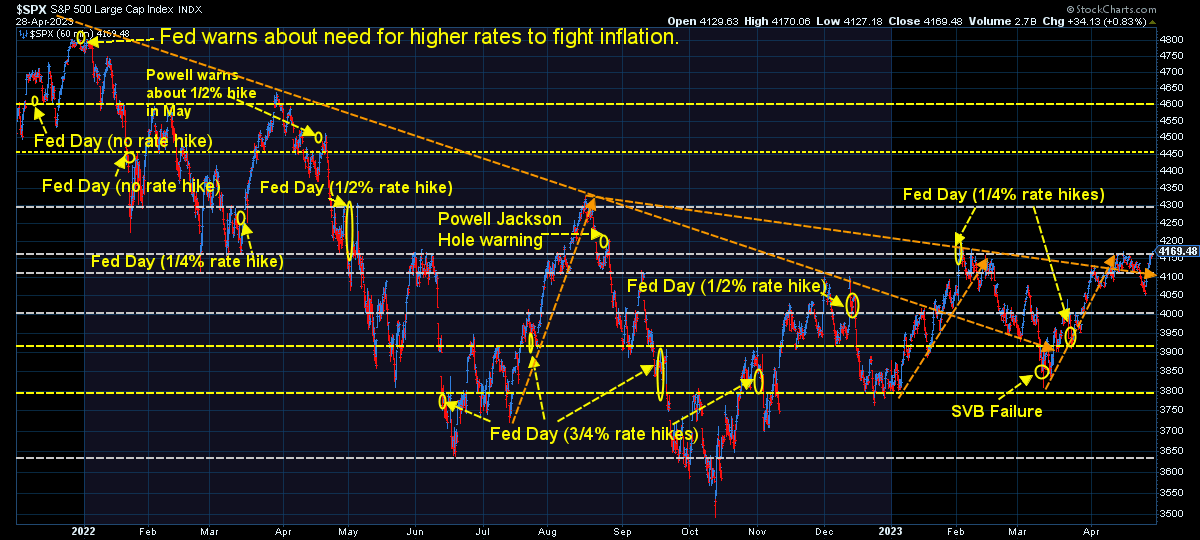
Turning to the markets.................
The short-term trend remains up. The intermediate-term trend could more be classified as sideways. A prolonged move above 4200 would be a positive development.
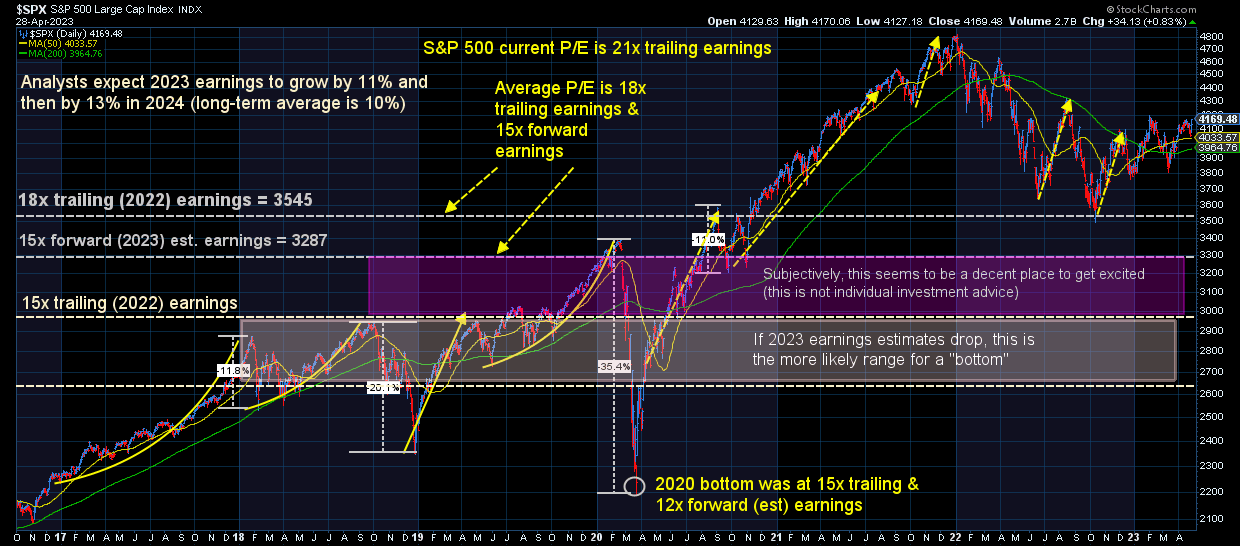
Bigger picture I continue to use this chart as a guide. Stocks are significantly overvalued based on historical metrics. With the chances of an economic slowdown high the likelihood of an earnings disappointment is also high, which means stocks could see steep losses unless the economy magically turns around.
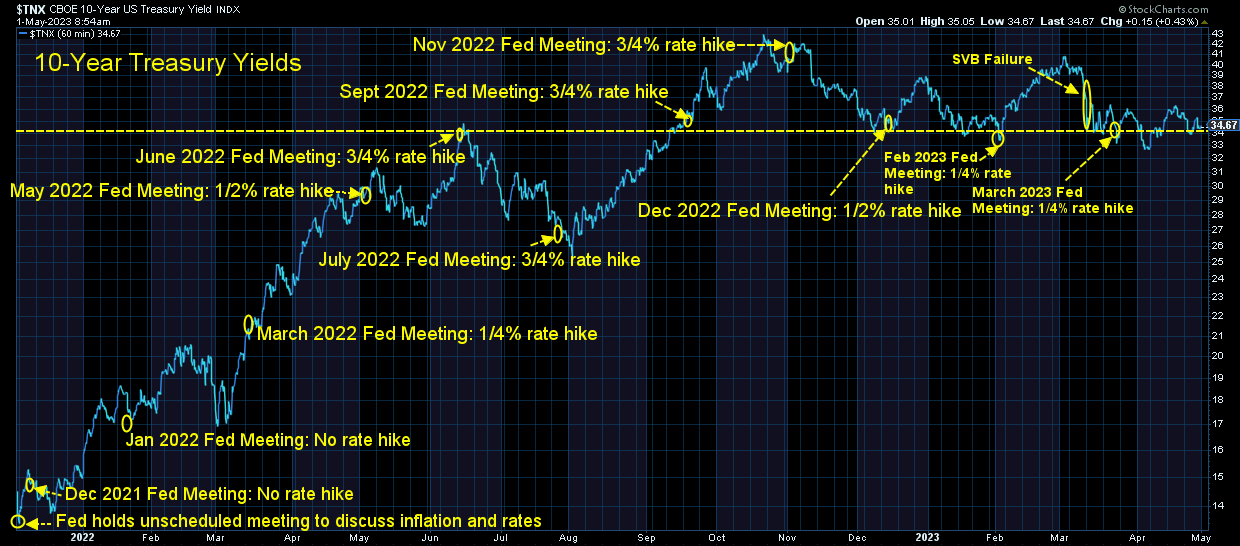
Looking at interest rates, I've said throughout the last year, the direction of long-term interest rates has been based on the perception of how well the Fed is handling inflation. The fact they have essentially been in the same range for the past 8 months could either be seen as a positive (the Fed has stabilized the inflationary pressures) or a negative (inflation is going to flatten, but at a level ABOVE the Fed's target).
For our part, we remain mostly invested in high yield bonds in Tactical Bond, Income Allocator, and Cornerstone Bond. We remain "bearish" in the Dynamic models (reduced risk exposure based on our economic model), and right in between minimum and maximum exposure in our 'strategic' models. This chart summarizes where we are:
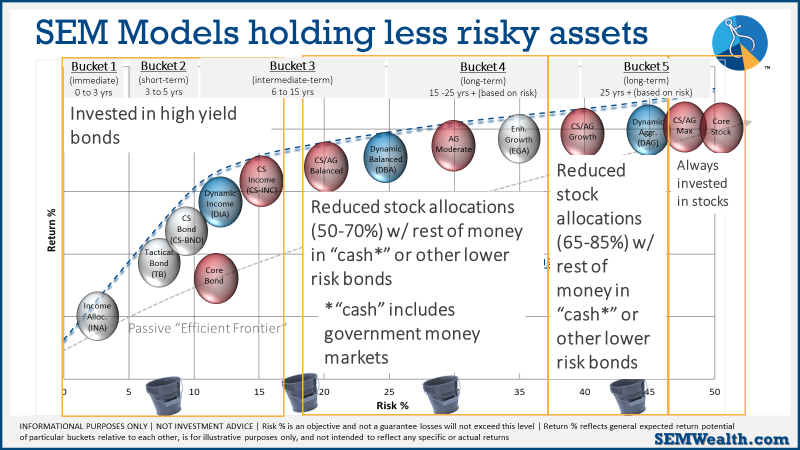
As always, our models will change if the environment changes. For now, calculated, short-term risks are acceptable with the knowledge things could change quickly.


