
Last week I walked through our economic model in great detail. With the markets closed on Monday for Martin Luther King, Jr. Day today's musings will be quite brief.
Let's start with the DATA we presented last week (click here to review) which clearly shows the economy is at best slowing significantly to a 1-2% growth rate (3% is "average") and at worst shows we are rapidly heading to recessionary territory. Let's add to the framework the AVERAGE growth rate for S&P 500 earnings the past 30 years is 8% and use simple logic:
The economy is going to grow at a below average rate; Therefore, S&P 500 earnings growth is likely to be below average.
That is not reflected currently in the market.
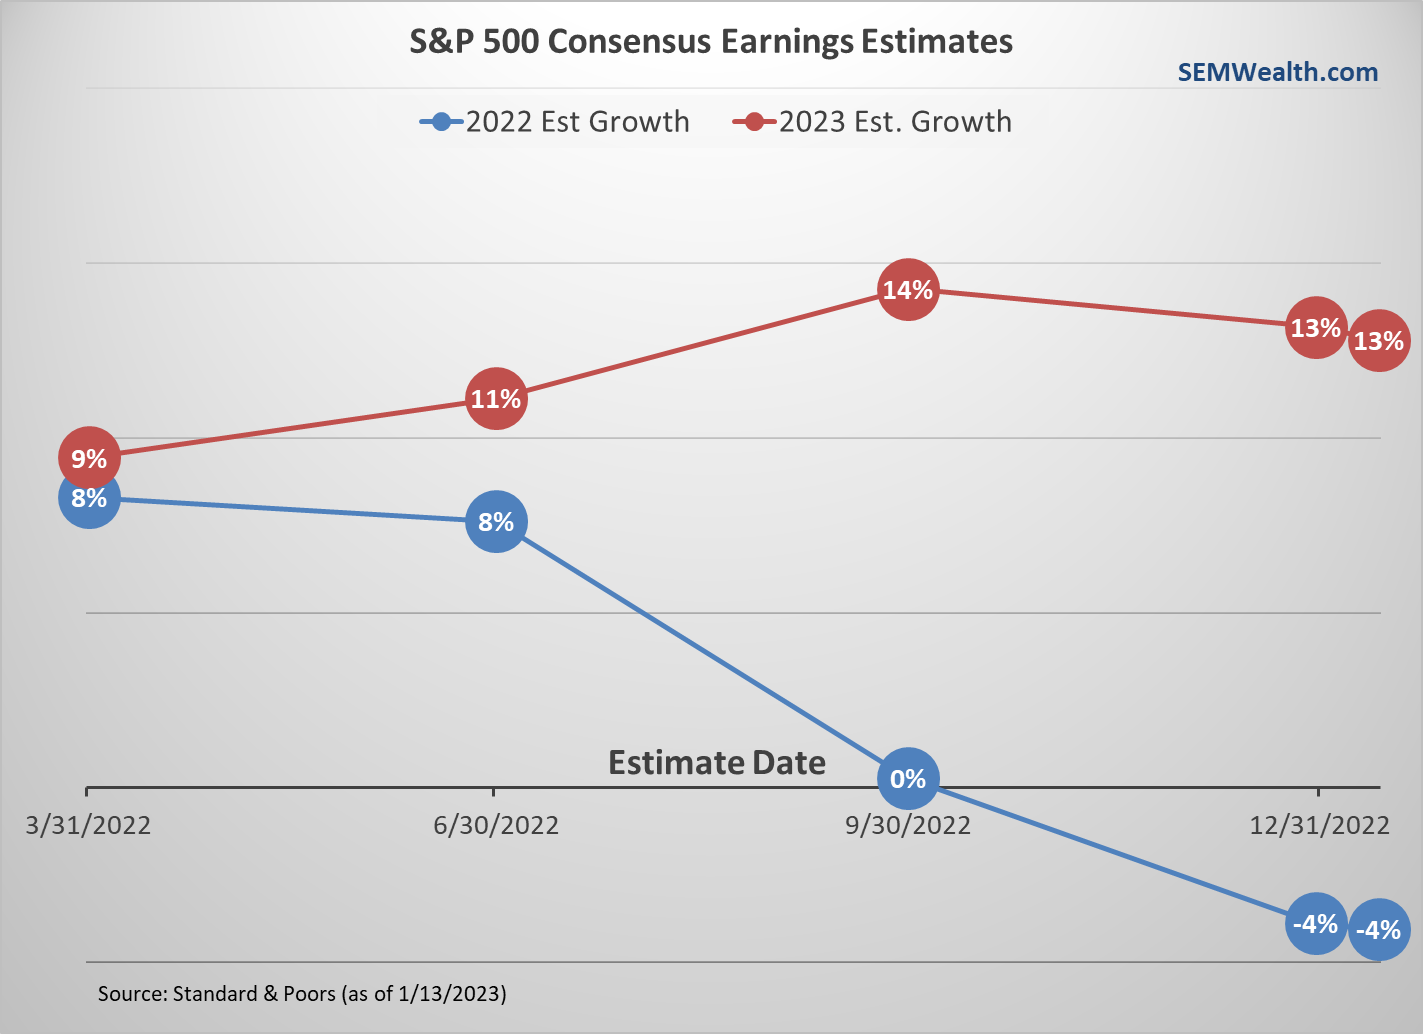
Here's a simple chart showing the expectations for earnings over the past year. The red line shows the expectations for 2023 year-end earnings and the blue line the 2022 year-end earnings estimates. For example, in March 2022, the market was pricing in 8% growth in 2022 followed by 9% growth in 2023. As reality set in for 2022, those estimates dropped, but the analysts simply assumed the earnings decline would be added on to 2023.
Now that 2022 is over, analysts have adjusted their 8% estimates down to a 4% decline, but they still believe earnings will jump 13% in 2023. This does not line up with most economic projections.
Even if they are right, stocks are trading at a P/E of nearly 18, which is the AVERAGE P/E ratio for the past 20 years. During a recession, the P/E typically dips to 12 to 15 before it hits bottom. If you are buying stocks today expecting strong gains this year, the data (and my 25+ years of experience) tells me you are living in fantasyland.
I'd love to be wrong. I'd love to see the economy grow above 3%, which would allow earnings to grow faster than the long-term average of 8%. That would lead to a great year for stocks. Unfortunately, investors are holding onto hope that the Fed simply stopping their interest rate hikes will lead to a strong recovery for the economy and earnings.
For our part our systems remain skeptical. Our systems are still warning more trouble is ahead for stocks. Remember, we err on the side of caution.
Looking at the markets, stocks continue to try to rally, but this chart serves as a reminder that the hope can quickly turn to dispair for those believing the worst is over.
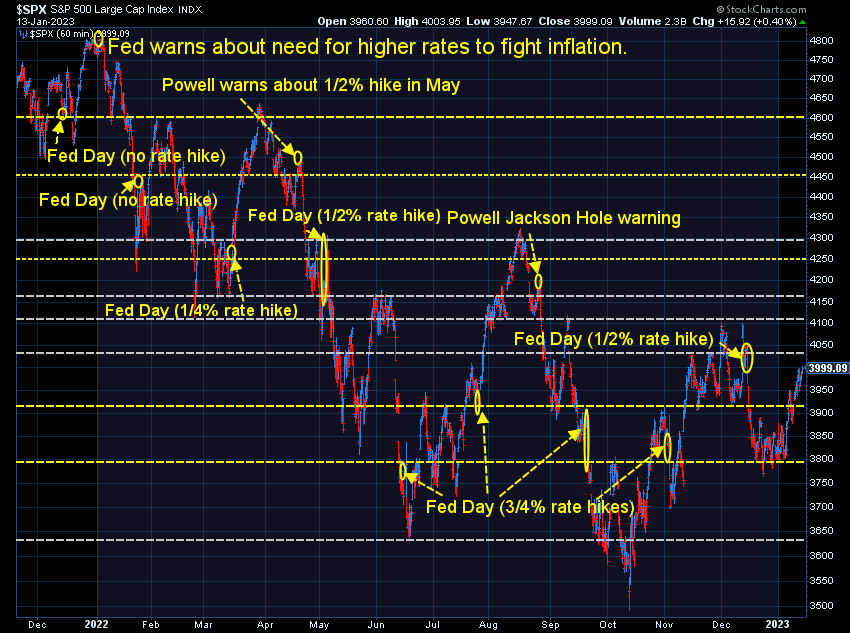
As long as the S&P remains below 4100 we are technically still in a down trend (lower highs). A break below 3750 could lead to new lows. If you are over-exposed to stocks, these rallies are a great time to "derisk" your account, especially given where bond yields are currently.
Looking at the 10-year, the 3.4% range appears to be the current "pivot" point, meaning a clear break below that level could be fairly significant.
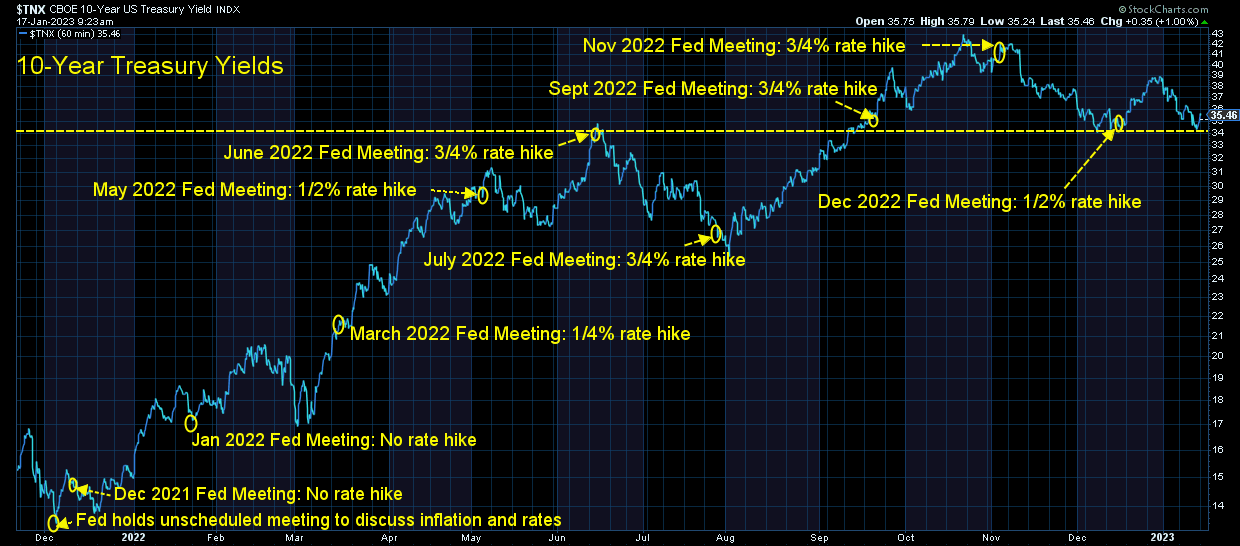
Right now the correlation between stocks and Treasury bonds is still quite high (which other than 2022 is not "normal"). This means the market is still betting on the Fed controlling inflation and even shifting to LOWER rates is the assumption going forward. Again, the data and my experience says that is probably wrong.
Please be careful. It's nice to start the year with gains given what 2022 did to most portfolios. Do not get sucked into the enthusiasm that the worst is over. We could have a lot more pain ahead.
Most importantly, you should only make investment decisions within the framework of your financial plan, cash flow strategy, and overall investment personality. If you don't have a financial plan, let me know and we can help you get started.


