
Wall Street likes to throw around a lot of terms as they attempt to form a narrative for their clients. Often times the narrative begins to shape the analysis done by those firms. For instance, I mentioned last week the forecasts for the top Wall Street firms. JPMorgan & BMO were by far the most optimistic for both 2022 and again for 2023. Throughout the year in 2022 when the markets were down JPMorgan and BMO's top strategists would appear on CNBC and Bloomberg to argue why stocks were bound to go higher. Especially in the case of BMO, those discussions would become quite heated on CNBC's Halftime Report.
Even when their bullish arguments were proven wrong, BMO and JPMorgan ignored the data. They are among a handful of Wall Street firms predicting a sharp turnaround in the stock market. Each has been using the term "soft landing" as justification for their continued bullishness.
A "soft landing" is the rare and opposite case of what happens when the Federal Reserve is forced to raise rates and pull back stimulus. You see, most of the time when the Fed is fighting inflation, they end up going too far and a recession followed. A recession is considered a "hard landing". The most recent "soft" landing was in 1994. This was an outlier as we saw recessions following Fed tightening cycles in 1970, 1974, 1980, 1990, 2001, 2008, & 2020. I know some will argue COVID created the recession, but SEM's economic model was signaling an economic slowdown going into 2020 (more on that below). I argue COVID accelerated the slowdown, but the "solutions" masked the underlying problems. Those problems are being unraveled today.
Anyway, last week the Payrolls report suggested to the always-bullish analysts on Wall Street that we are well on our way to a "soft landing." We still are creating jobs, but employment costs have slowed, they argue. This means the Fed will not be forced to raise rates that much longer.
Are they right? Time will tell. For us, our quantitative models drive the ship, not our opinions (or having to defend a year end price target). The payrolls report marks the end of our monthly cycle of data for our economic model, so we'll take a look at where the economy is below.
But first......
Market Summary
We manage money on several platforms to give advisors access to some of our investment models inside their Broker/Dealers. One of those platforms asked me to write a short summary of what we see in the markets overall. Obviously when I typically write 1500-2000 words a week, summarizing my thoughts in one paragraph is tough. Here's what I came up with:
As quantitative managers we let the data dictate our market outlook. The number one determinant of long-term returns is the starting valuation point. Despite the near 20% correction from the highs in stocks, valuations remain unattractive. This is because earnings estimates declined significantly in 2022. So far this year, Wall Street expects 12%+ earnings growth for the S&P 500, which they are using to justify the high valuations. Most true bear market bottoms see P/Es in the 12-15 range (we currently are at 20). If earnings are flat this would mean the S&P 500 would trade around 2800-3200, which coincidently would put it at the same total loss of the average recessionary bear market. While we do not predict recessions, our economic model does give signals on the economy, and it remains "bearish" as it has since April 2022.
Turning to bonds, the large moves in Treasury yields has not been matched by riskier bonds. This means you are receiving very little for taking on credit risk. For instance, you can receive just over 4% in some money market funds, but a higher quality high yield bond fund is paying only 6.5%. If the economy slows, we are likely to see defaults spike, which will also drive yields higher (and prices lower) in corporate high yield bonds.
We encourage advisors to have patience. Bear Markets are a process which includes many 10%+ false rallies. So long as economic growth is expected to be weak, we should expect each rally to be a false one. Much better opportunities will emerge on the other side.
Economic Update
Now back to our economic model. The focus is always on the jobs report, so I'll start there.
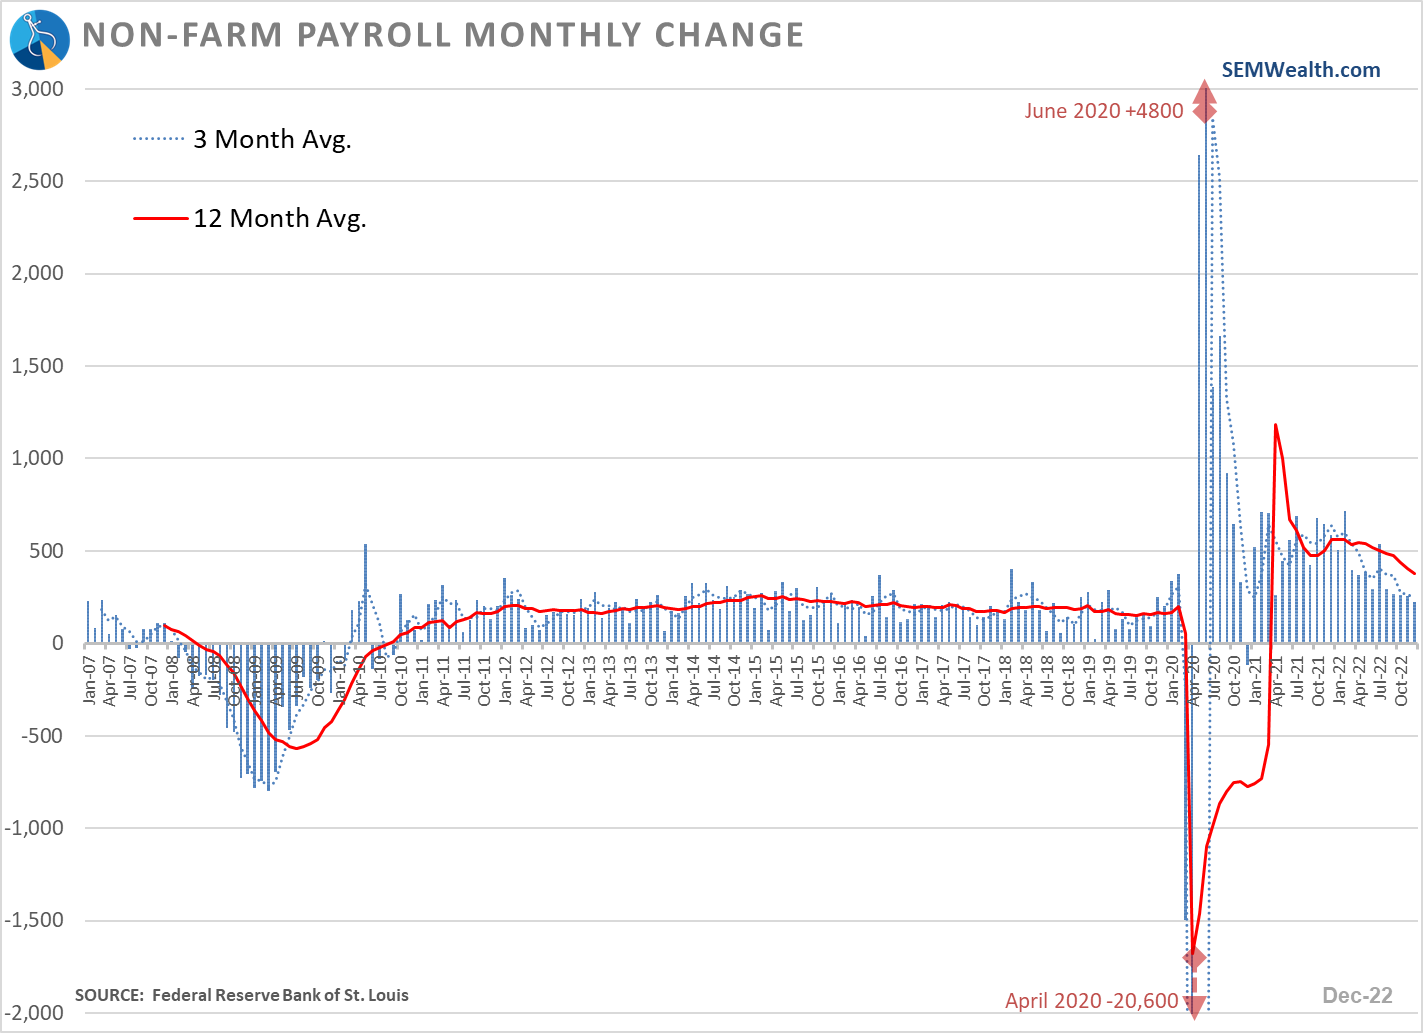
Labor Market Remains Strong
The pace of growth has certainly slowed, but the number of jobs being added each month are still significantly strong. While we haven't seen too much wage pressure, I have a hard time seeing how this strong of a labor market with overall inflation still running high and speculation running rampant in the markets means the Fed is going to have to reverse course and lower rates.
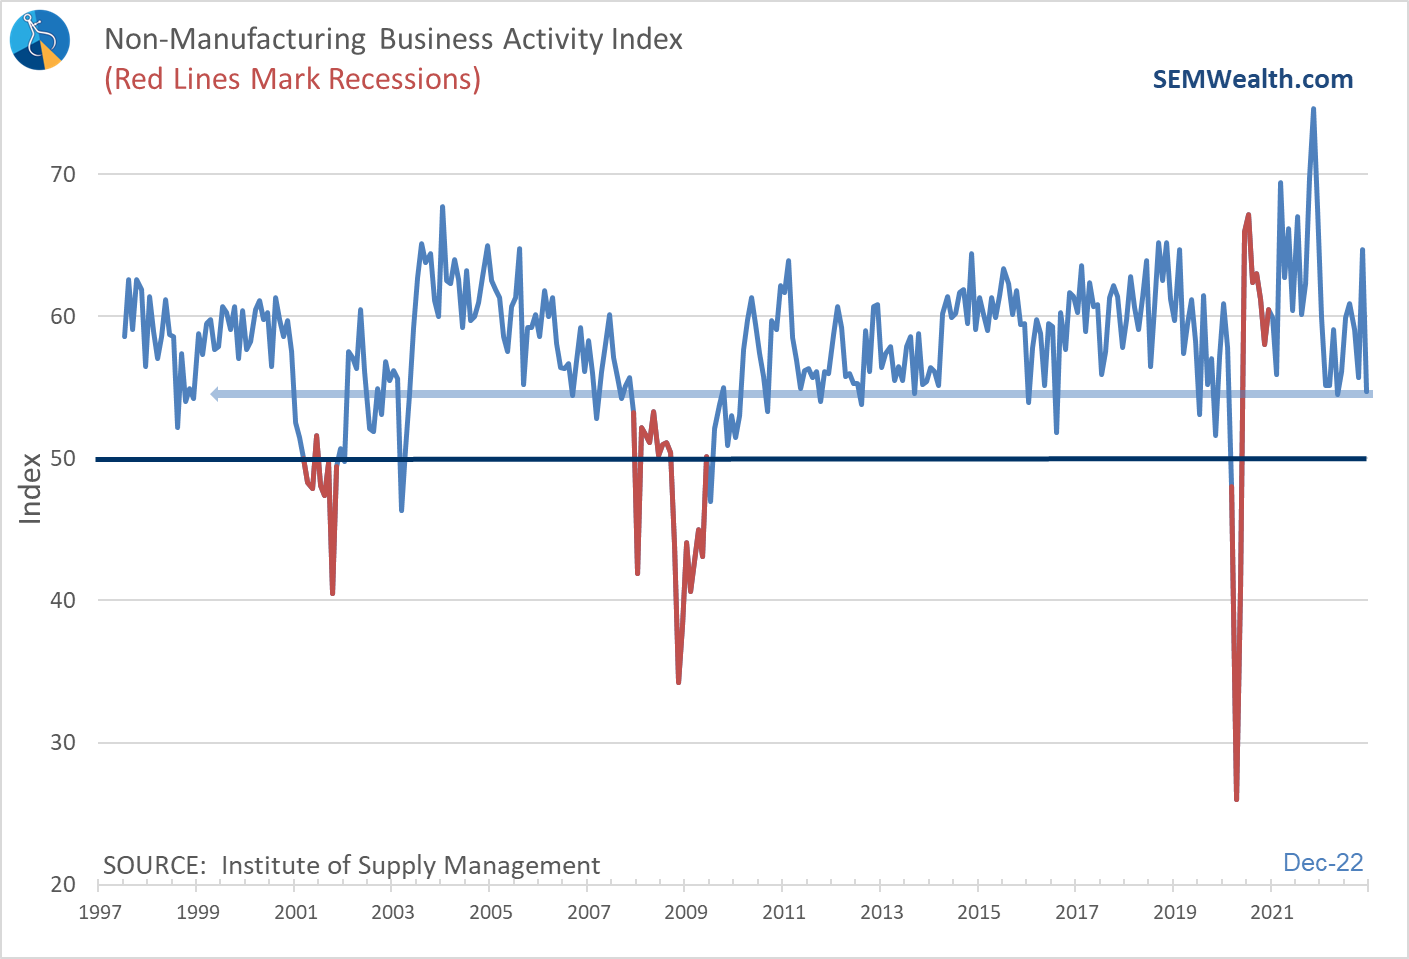
The only change to our model since I created it in 1995 was the addition of the Service Business New Activity Index. This index was not around until the mid 2000s and as services became a bigger and bigger driver of our economy we found it also was a good leading indicator. The index is now at post-pandemic lows. While volatile, note how it had turned lower prior to COVID hitting the economy.
Service Activity at post-COVID lows
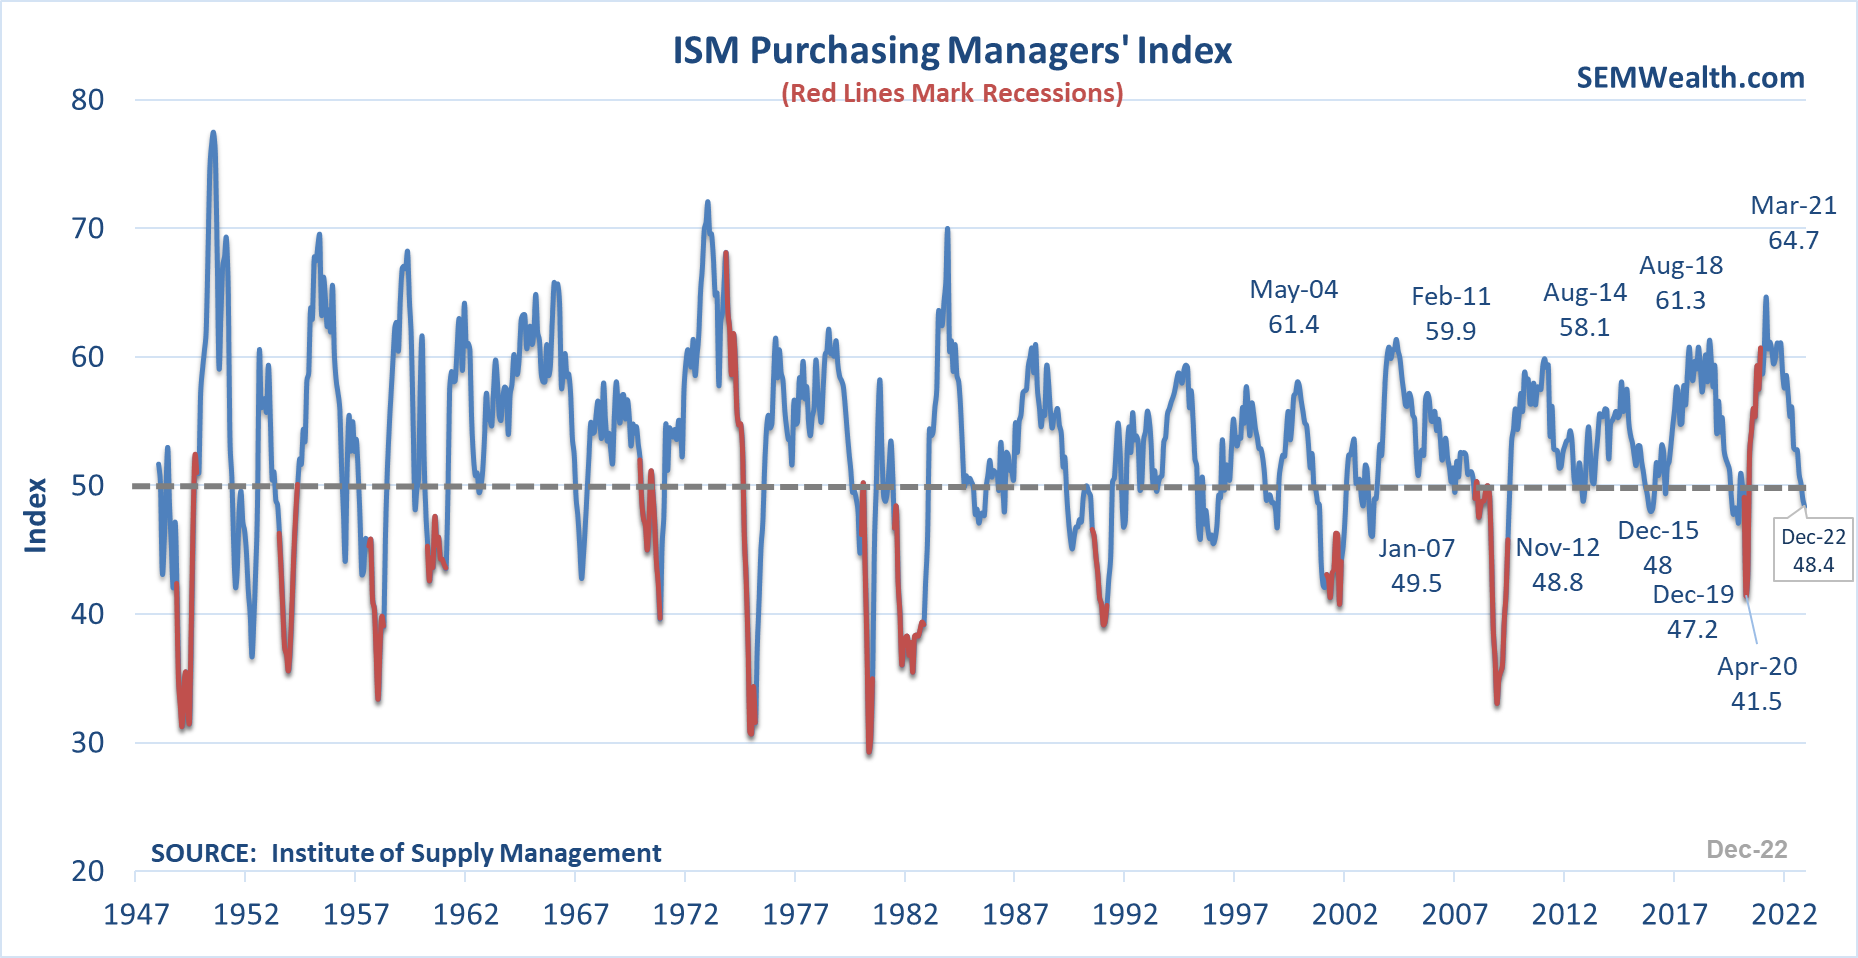
While manufacturing has been diminished in importance, the manufacturing index still provides a strong predictor of the direction of the economy. The overall index is also at a post-pandemic low and within a whisker of the December 2019 levels (when SEM's economic model was bearish).
Manufacturing Activity Continues to Weaken
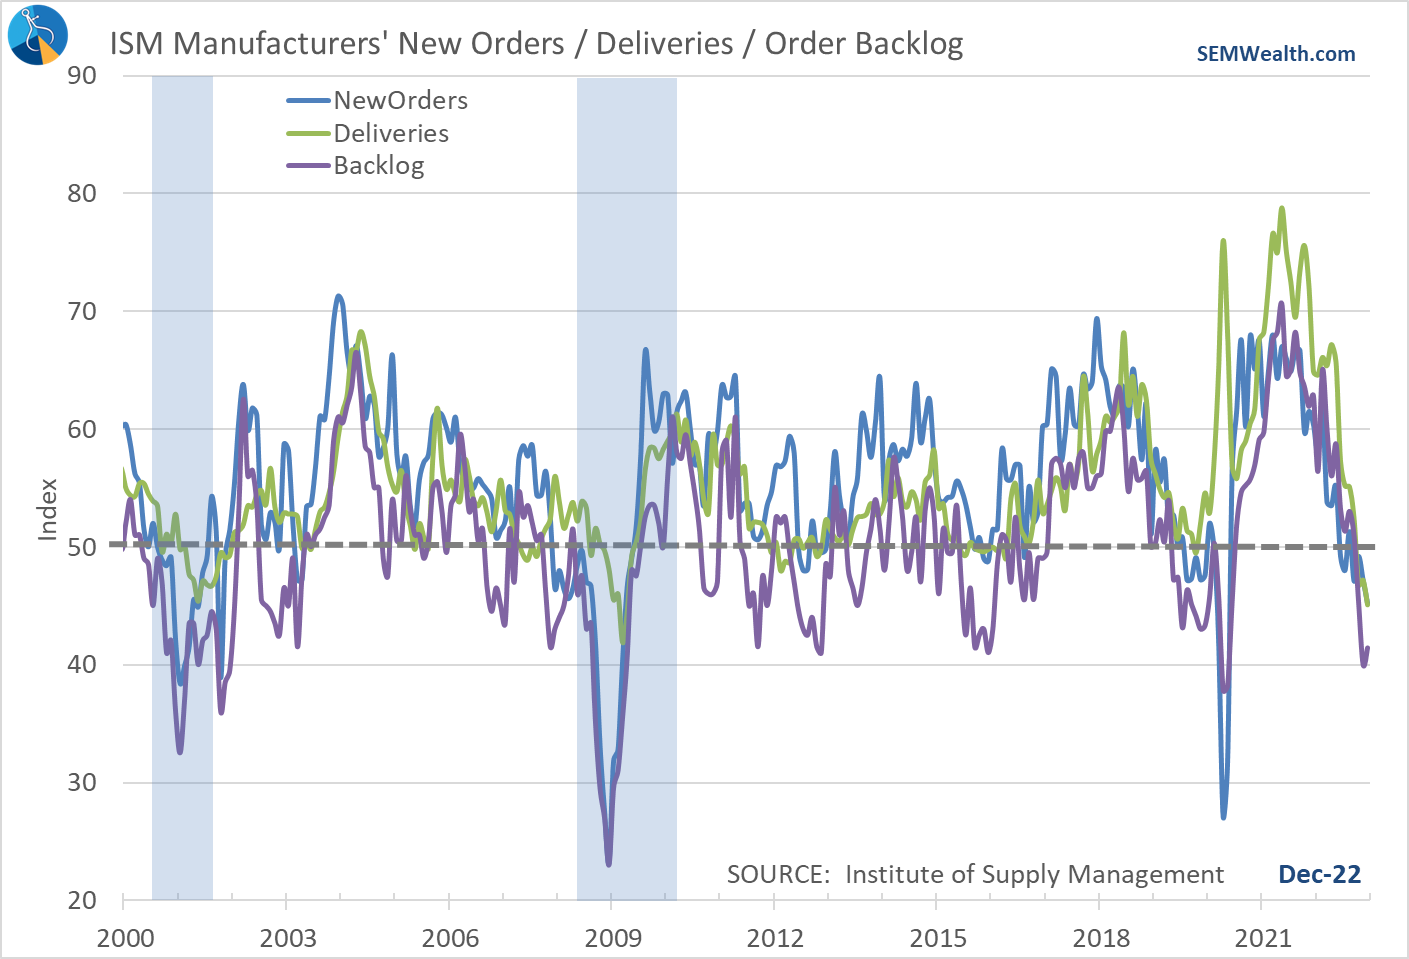
There are several leading indicators inside the manufacturing index, all of those are also at post-pandemic lows and more importantly BELOW the December 2019 pre-COVID levels.
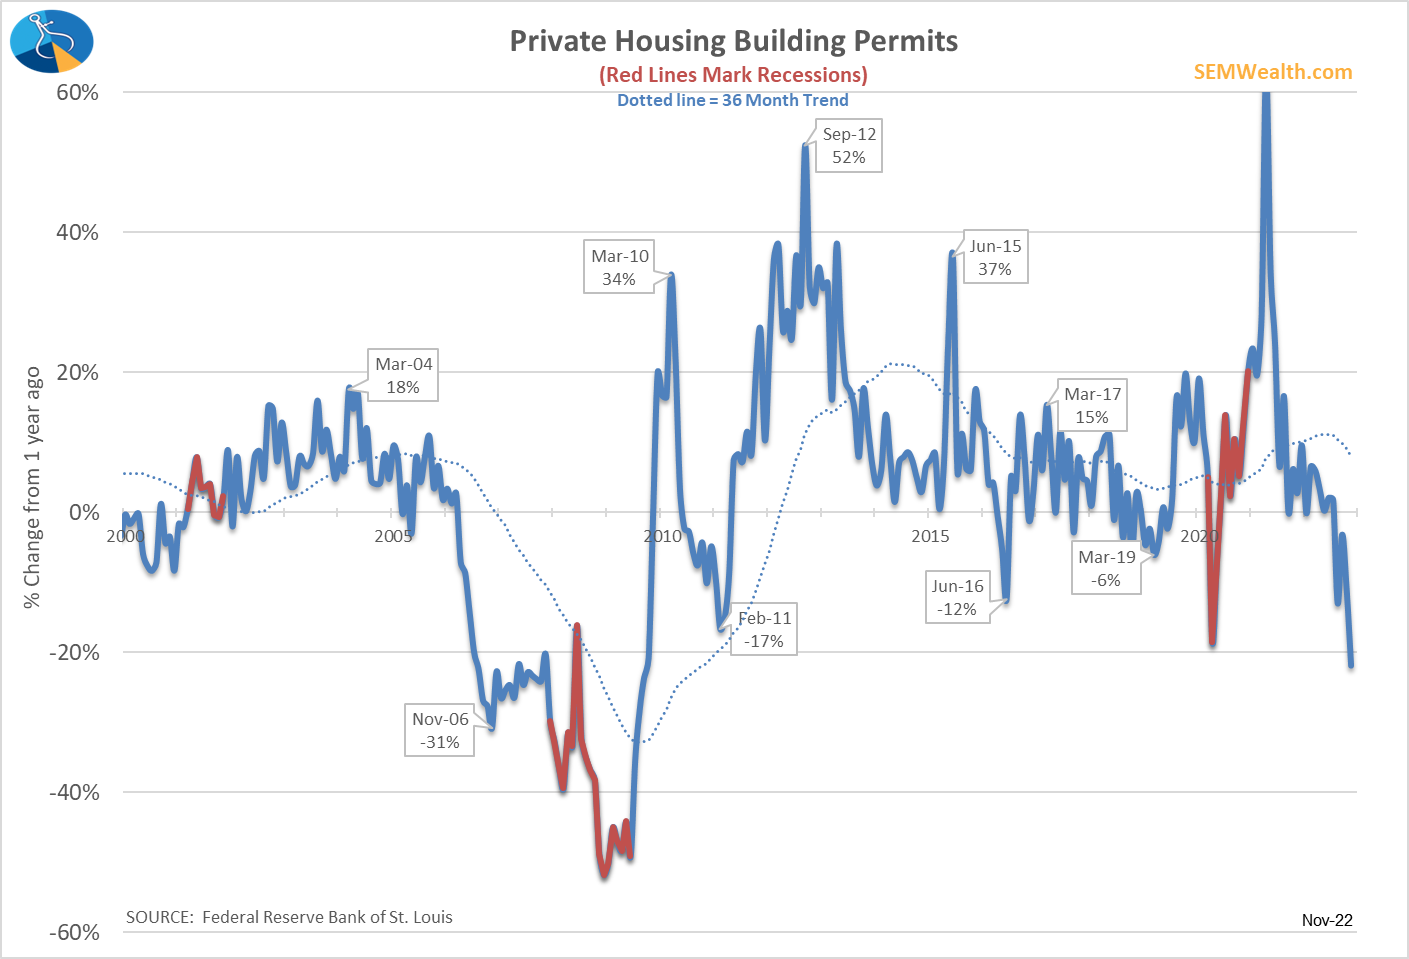
Housing Activity Could be a Problem
Building Permits (which are a leading indicator of Housing Starts) have always been a reliable indicator of future economic growth. The year-over-year drop in permits is now WORSE than what we saw at the COVID lows. This will be something to watch closely as we move through the year.
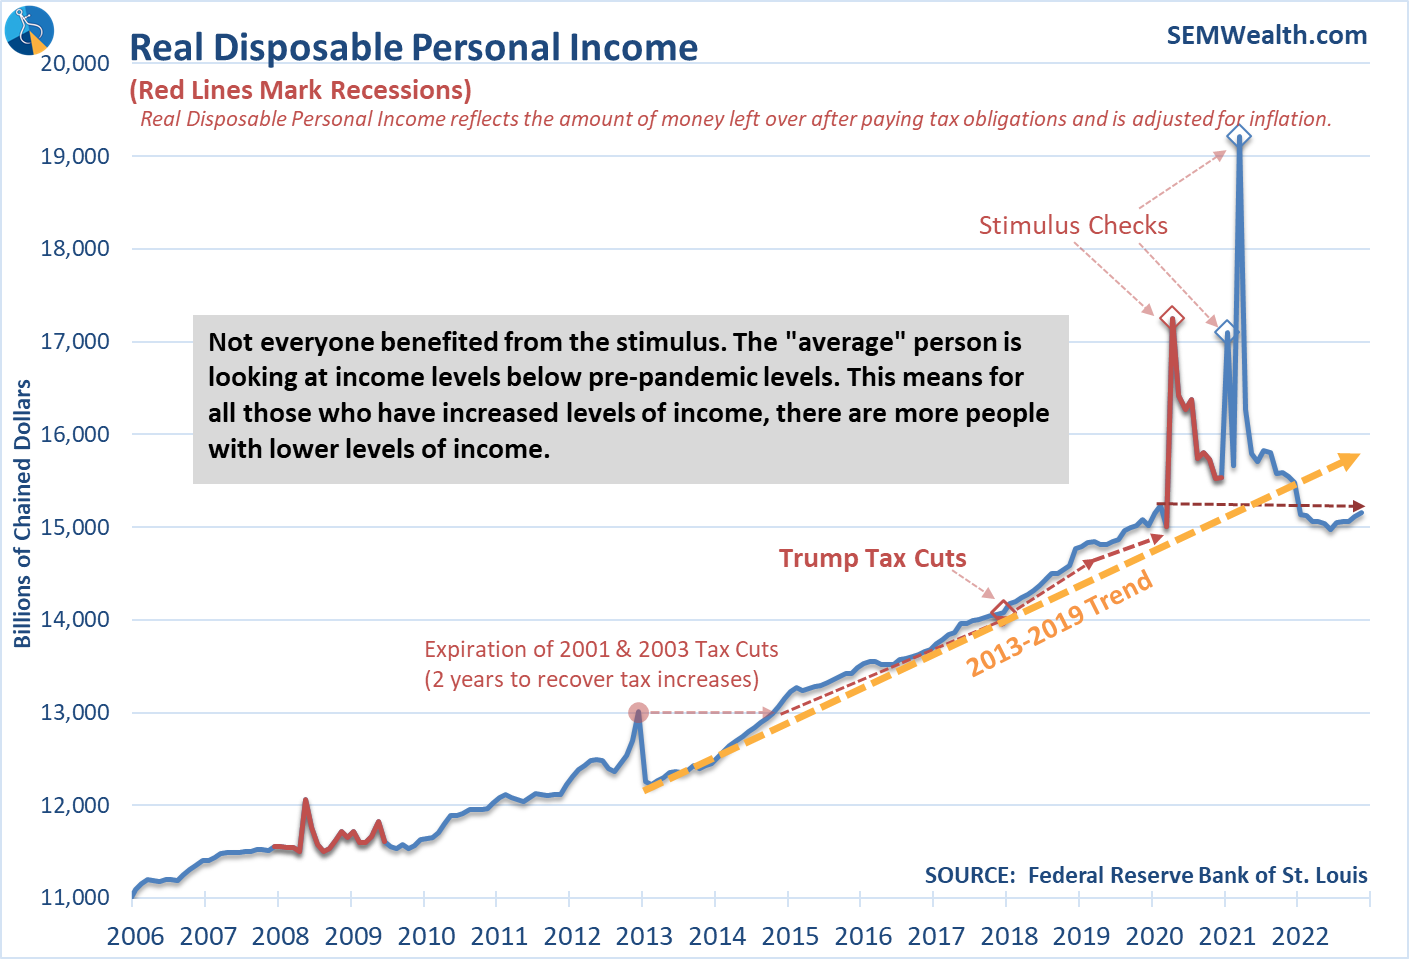
Real Personal Income is Falling
At the start of 2022, I identified this chart as the key to the year. It illustrates how much income is left after paying taxes and adjusting for inflation. It fell below the 2013-2019 trend in 2021 and remains BELOW the pre-COVID levels.
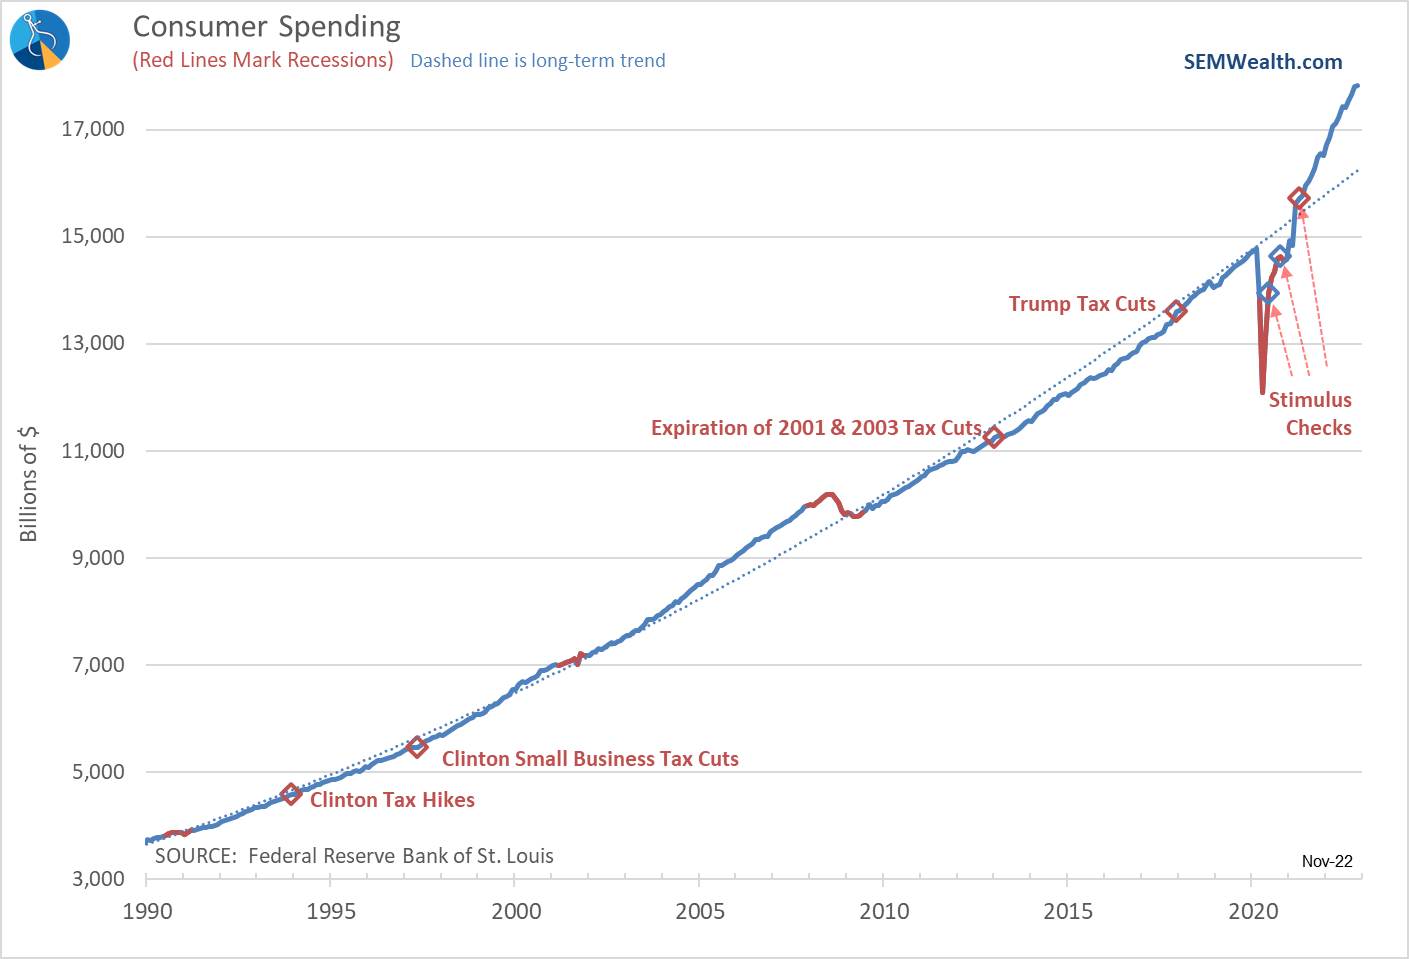
When will Consumers Stop Spending?
This has yet to hit consumer spending. This chart perfectly illustrates the impact the stimulus checks had on consumer spending. I said at the time, "we are sending too much money to too many people who absolutely do not need it." When Americans have excess money, they spend it. It was clear before the third round of stimulus hit, spending was back "on trend", meaning there was no reason to send money to most Americans. This literally broke our economy and we are paying for it today.
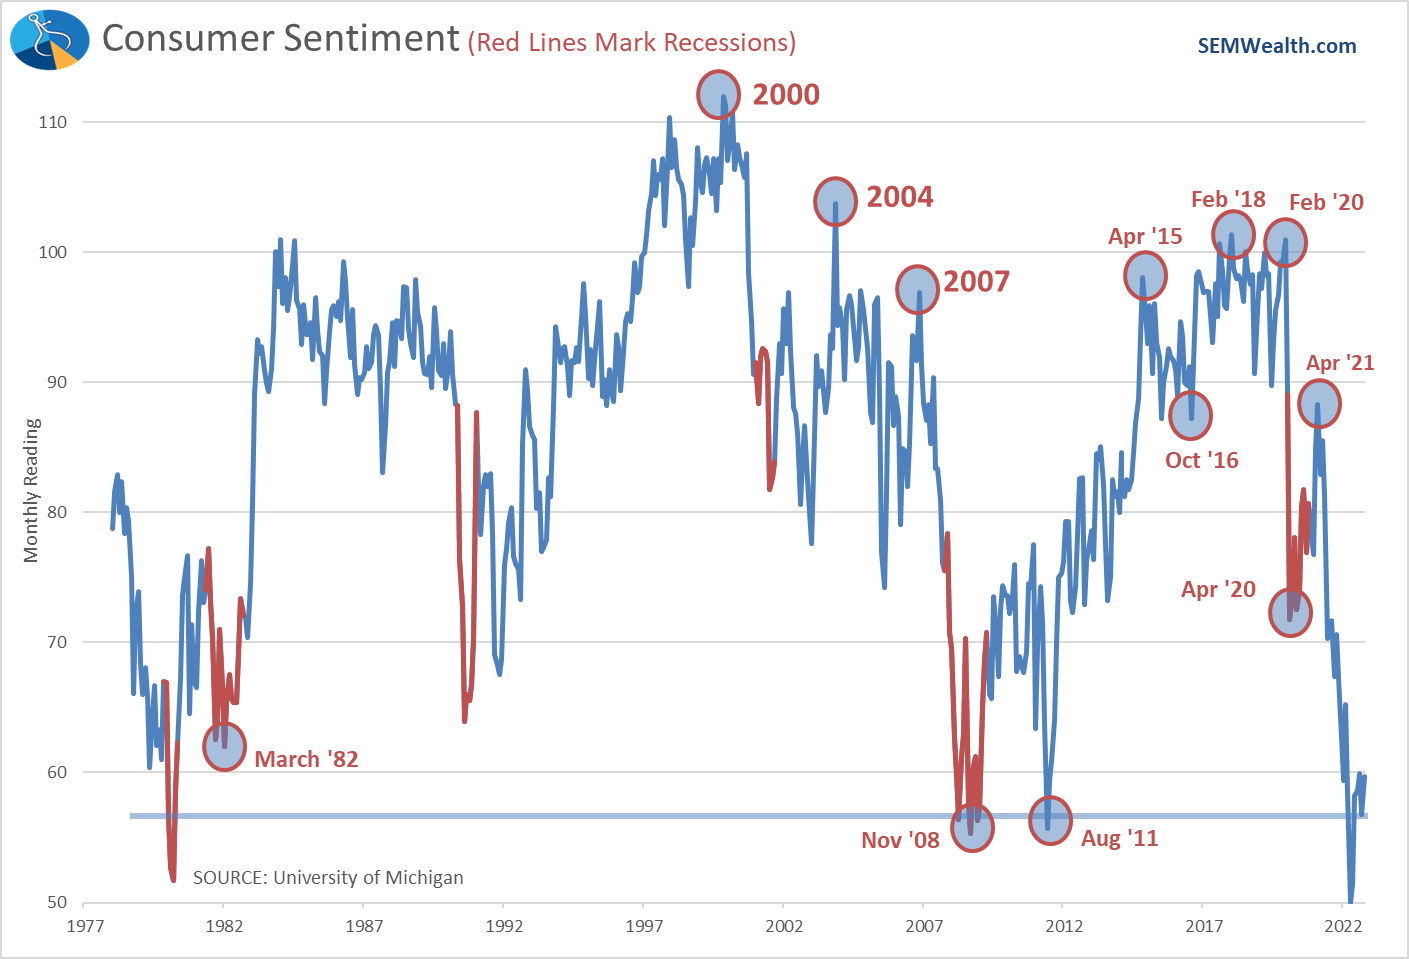
Weak Sentiment is a Problem
The problem is we probably didn't get enough money to people who actually needed it, which has made the problem worse for those living paycheck to paycheck. Sentiment remains near historic lows. I continue to predict now that "revenge travel" of 2022 is over (people making up for lost trips due to COVID), we will see a significant slowdown in consumer spending.
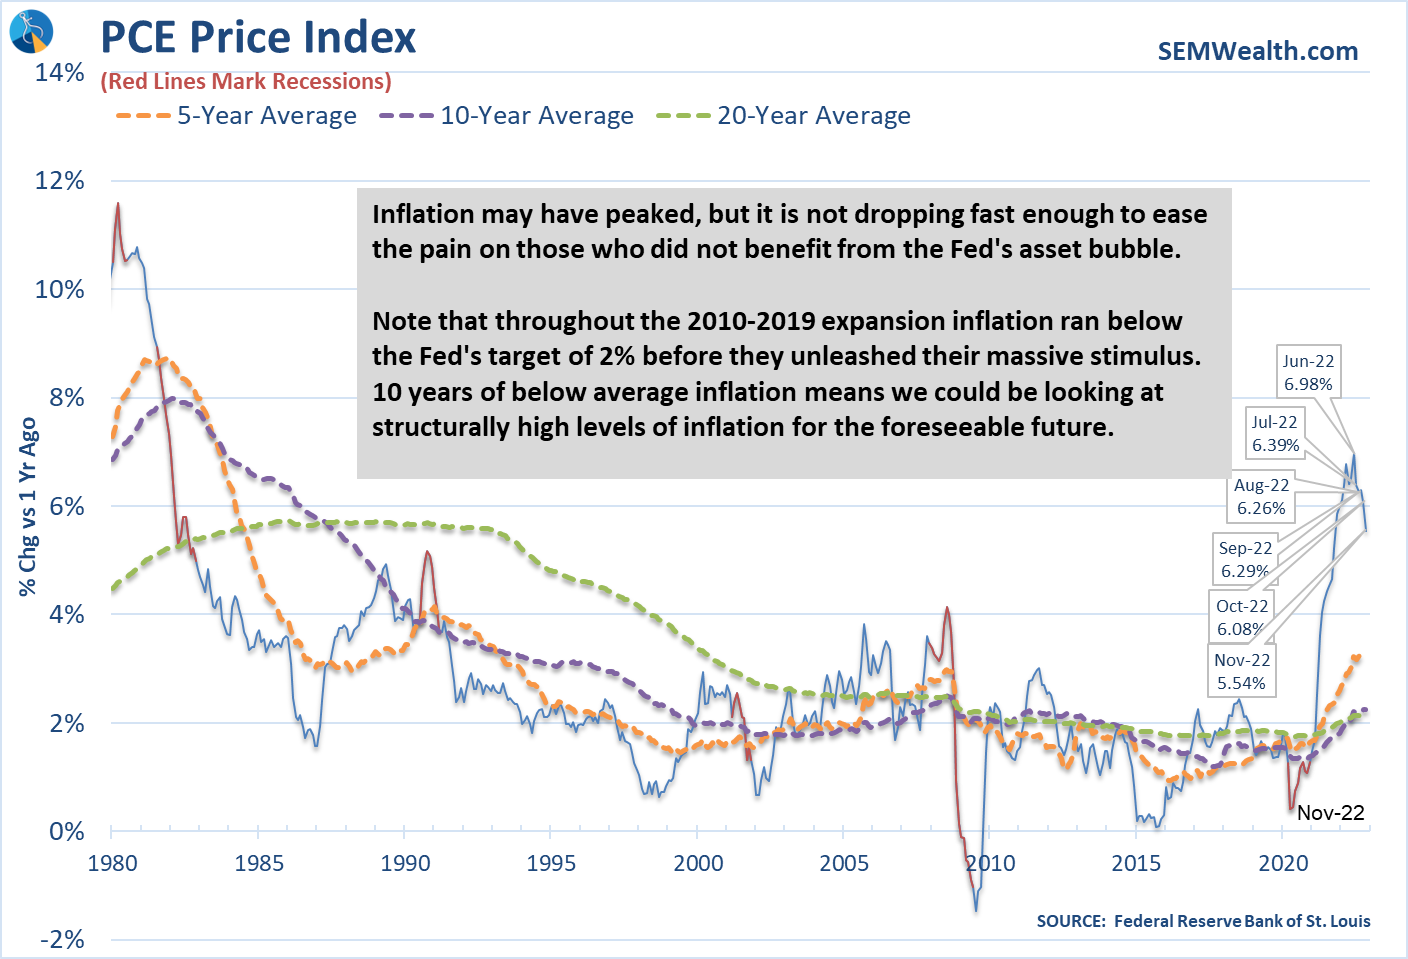
Inflation is Still Too High
Looking at inflation and the Fed's preferred inflation measure we can see the pace of inflation is indeed slowing down, but it is still significantly higher than anything we've seen in the past 30 years.
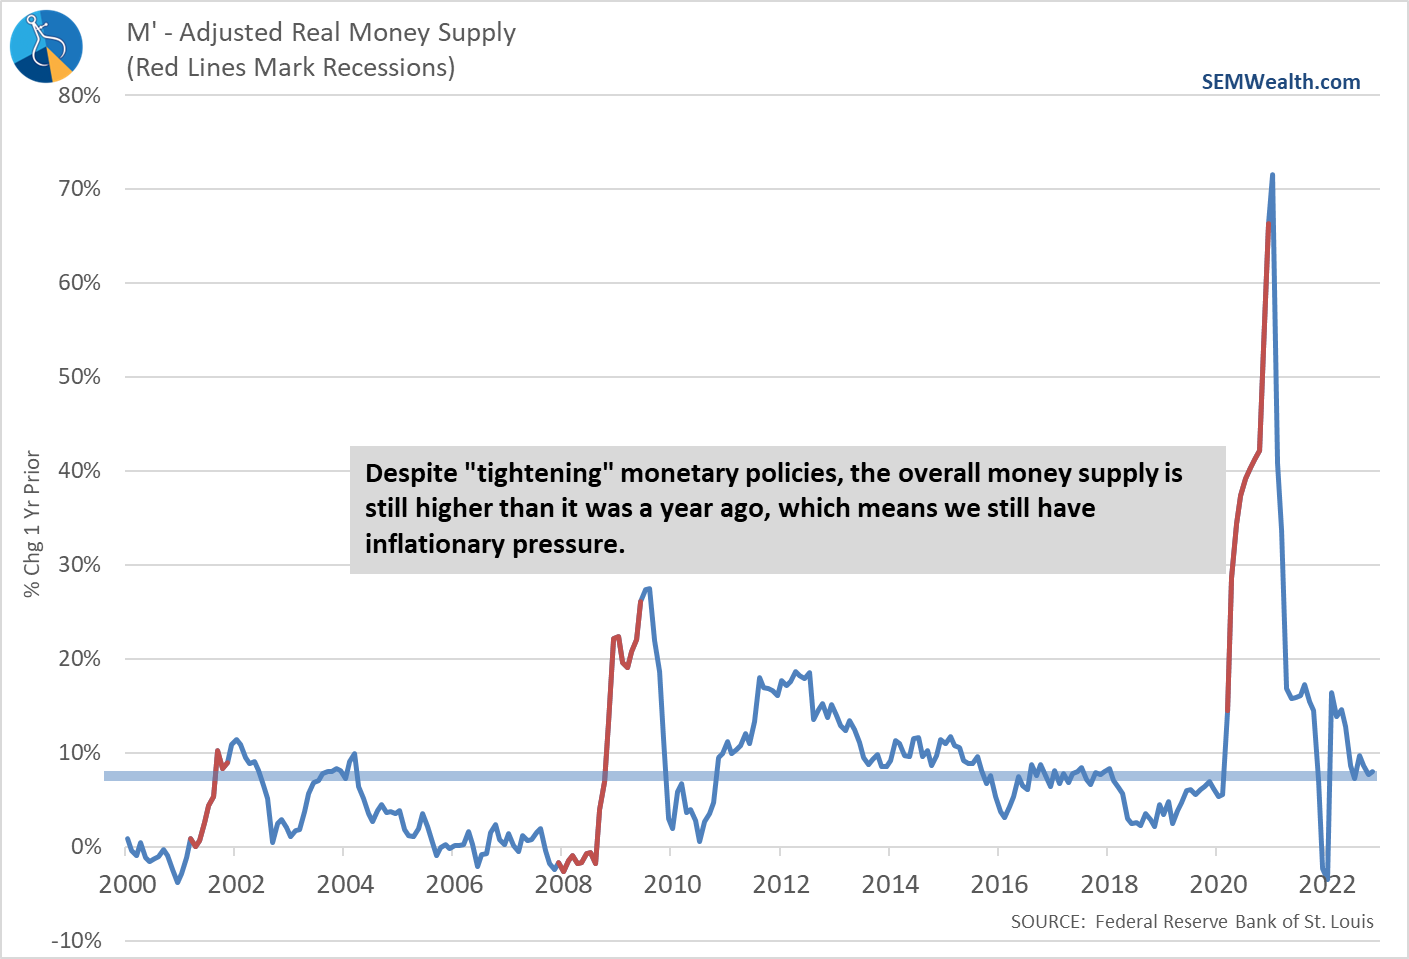
Has the Fed really Tightened?
One reason to believe we are still looking at stubbornly high inflation is the fact the Fed really hasn't done much to slow things down in terms of the money supply. The Fed "warned" about the need to fight inflation a year ago, yet the money supply is 8% higher today than it was back then.
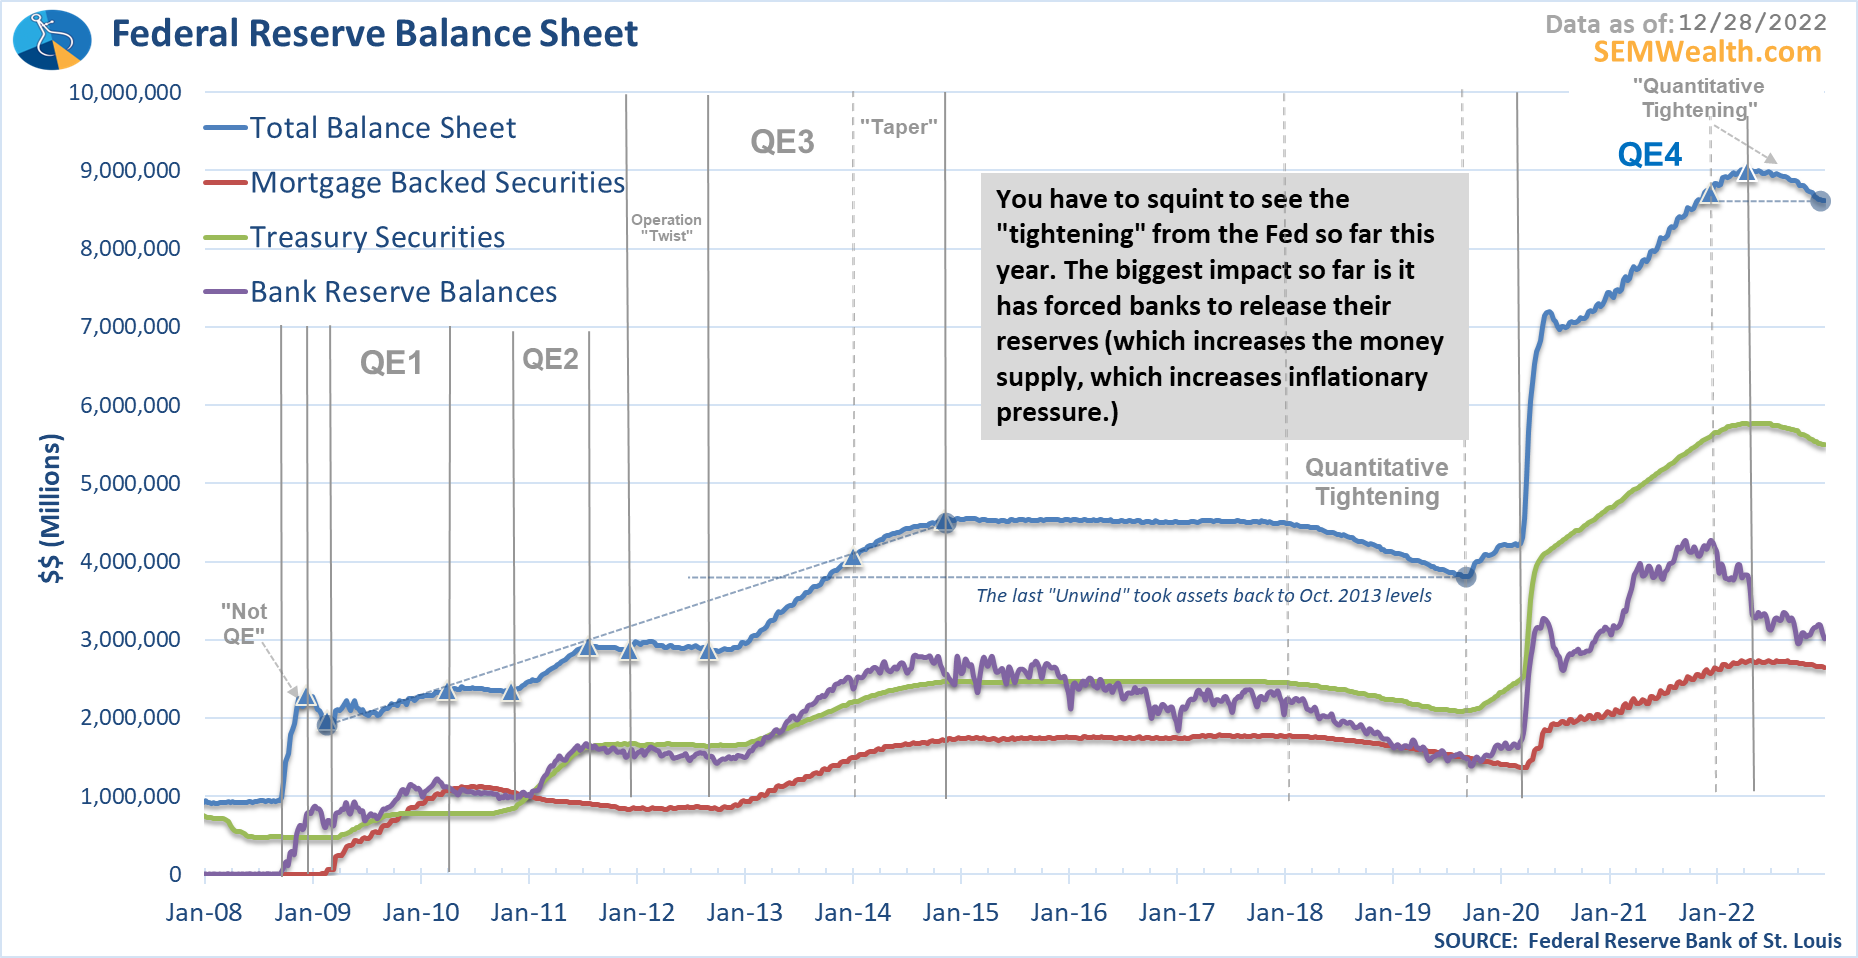
Prolonging pulling back the excess money means we will see inflation become much more ingrained in our economy. Looking at the Fed's balance sheet, it is hard to see a meaningful change. In a year, they've only unwound the last little bit of stimulus from late 2021.
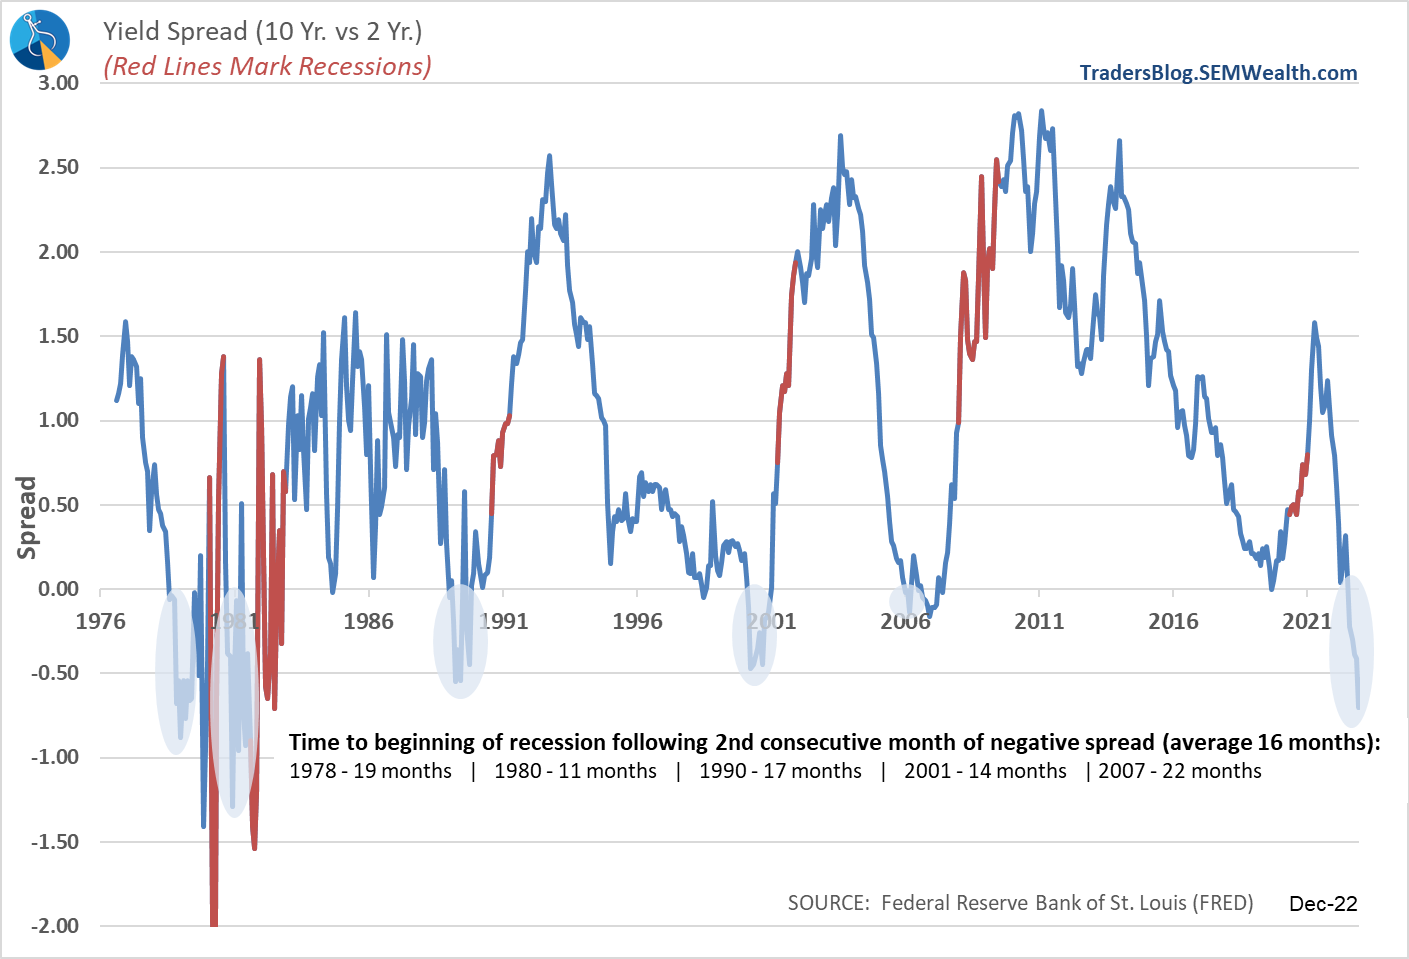
Bond Market Still Predicting Recession
Even with the recent moves in the bond market, Treasury yields are still predicting a recession.
Here's a look at our economic dashboard:
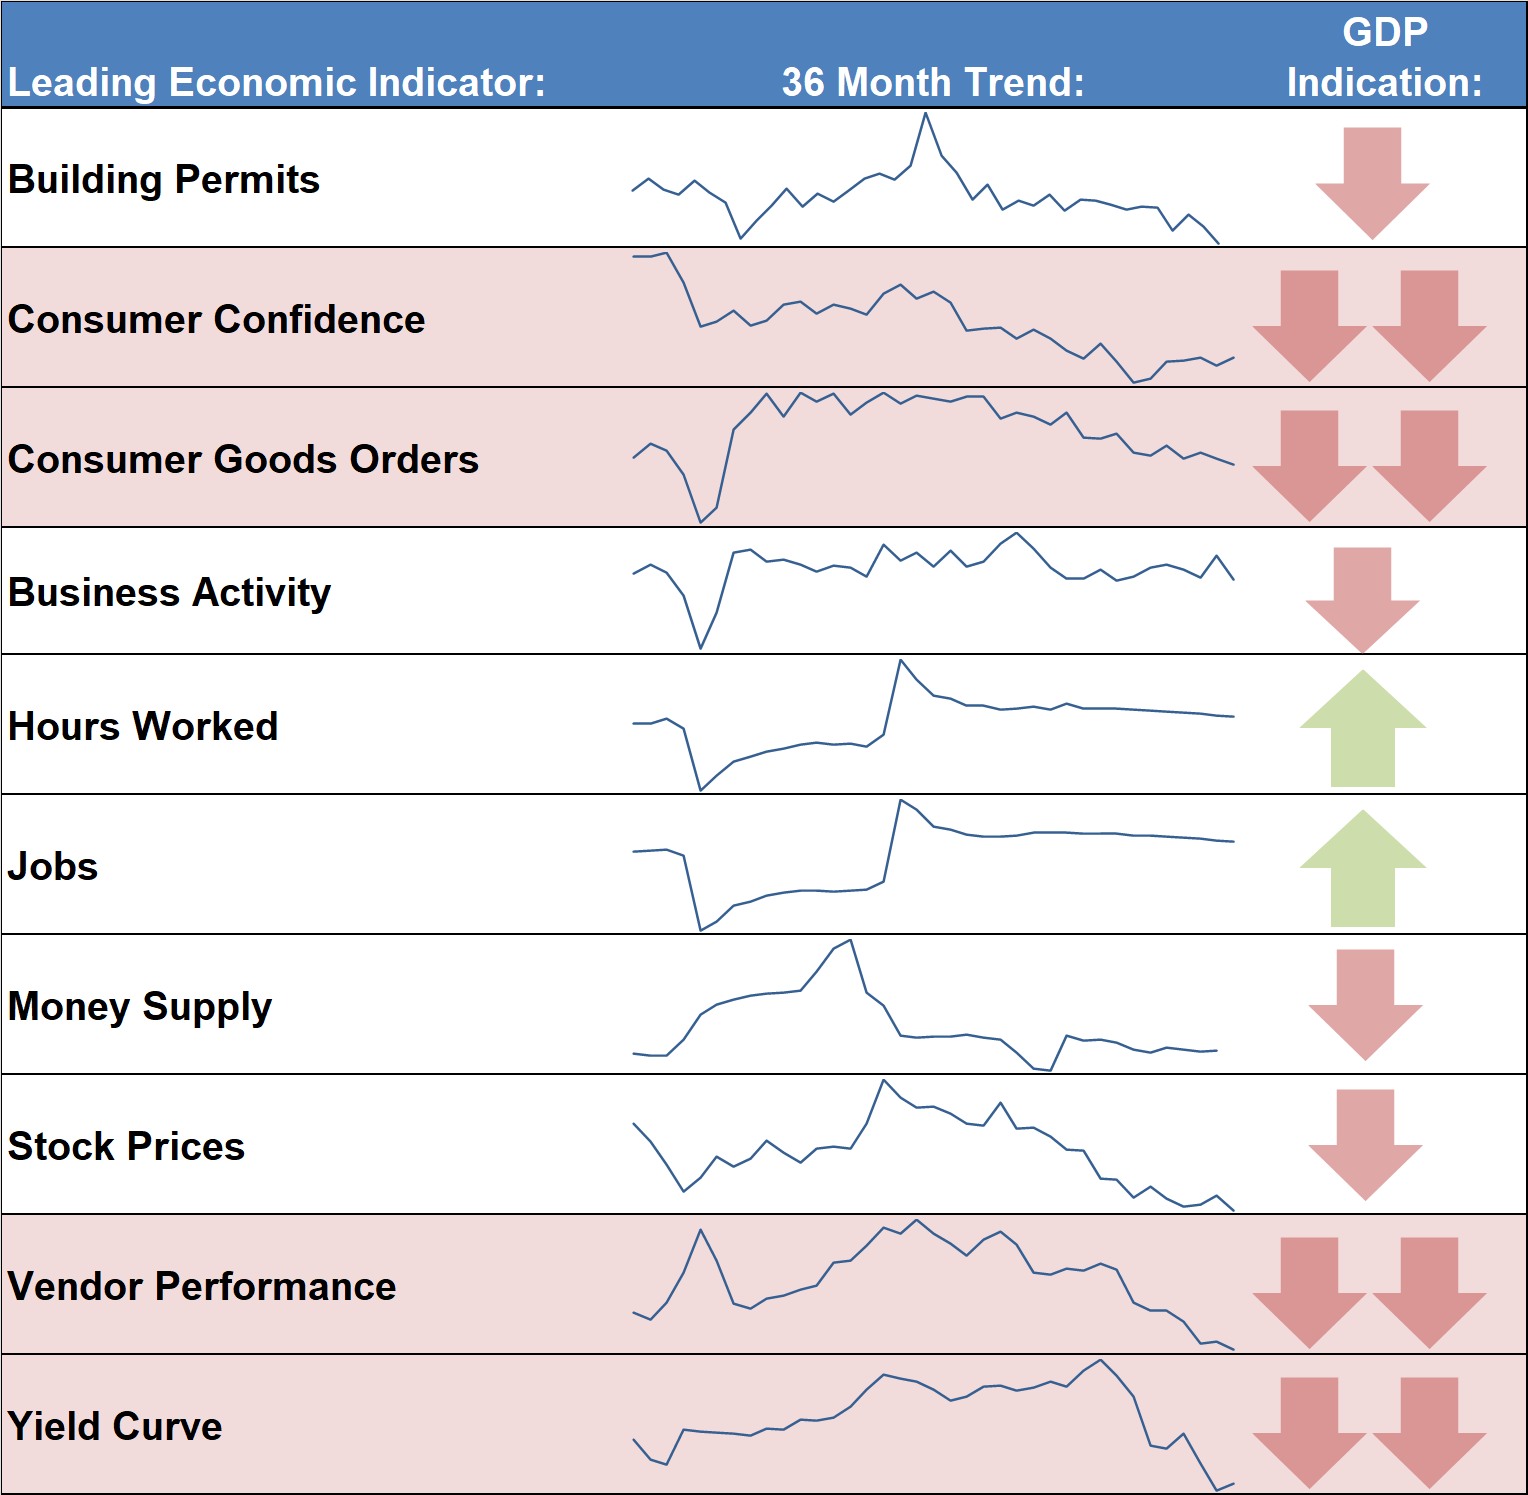
Does this look like a soft landing to you? Other than the labor market, everything is heading the wrong direction. In some cases, dreadfully so. While we would love to see the economy survive without a recession, the data argues otherwise. Again, SEM does not predict outright recessions. Instead our model identifies when the growth rate is likely to accelerate or decelerate. Here's the overall model signals:
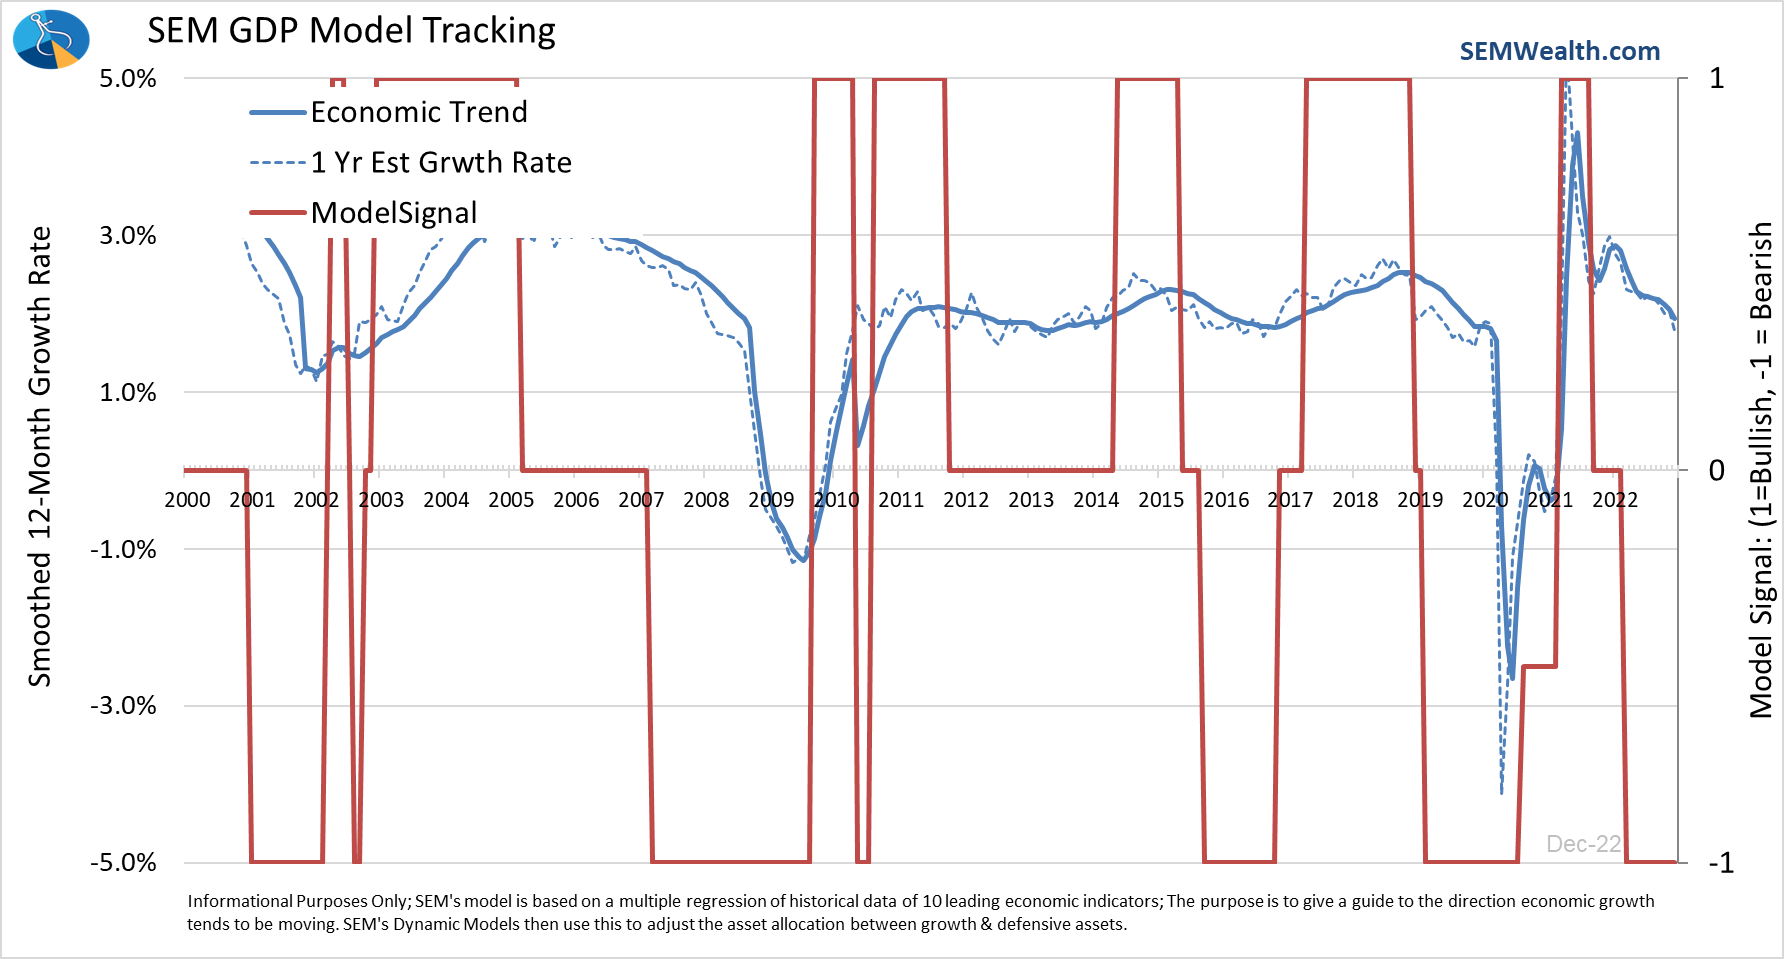
One thing to note – seeing the economy decline over a 12 month period is very rare. The only times in the history of our model this has happened was in 2008 & 2020. A normal recession sees 2-3 quarters of contracting economic activity, but a resumption of growth (albeit slower) following the contraction. Keep in mind when looking at the model – the AVERAGE annual growth rate is 3.1% going back to 1947. Over the past 30 years that rate has slowed to 2.5%. Any number in our model below 2.5% would be considered BELOW NORMAL.
What this means for stocks is BELOW NORMAL earnings growth. Wall Street is still predicting 12%+ earnings growth in 2023, which means they are ALL IN on the idea of a "soft landing". I hope they are right, but right now our model says they are wrong, which means if you have too much exposure to stocks, you should use every rally as a chance to "right-size" your risk.
More importantly whether or not you are in the right portfolio depends first and foremost on your financial plan. If you don't have a financial plan or aren't sure the last time your plan was updated, let us know and we can provide one free of charge.
Some Core Changes
One of the things I appreciate most with SEM's style of management is how the various management styles compliment each other. Many times all 3 styles agree on the direction, which was pretty much the case from March to October last year. At the end of October one of our "trend" models inside AmeriGuard and Cornerstone flipped back to a "buy". The "core" of these models stayed pretty much where they were – overweight large cap and value.
With the latest quarterly trend check, the core systems inside AmeriGuard made some small changes – reducing large cap value and large cap blend in favor of small caps and (drum roll, please) international. For many advisors, this may be the first time you've seen SEM have international exposure in our "core" systems. We sold international at the beginning of 2017. The strategies still remain "partially bearish" with 1/2 of the trend models in short-term bonds, it is noteworthy to see this rotation given the positioning of our economic model.
Market Charts
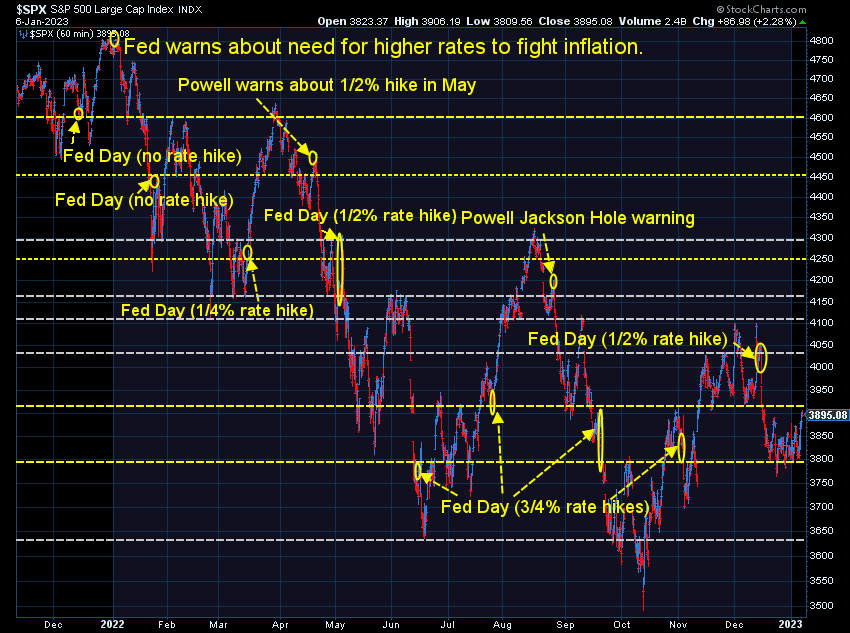
Stocks dropped heavily after the last Fed rate hike. They've been trying to consolidate since then in a 1000 point range for the S&P 500. This week they may try to break out, but we shouldn't take that as a sign the bear market is over. This chart illustrates how many "bottoms" we've already had over the past year.
This is the chart that I think all investors and advisors need to understand. Despite being 19% from their highs, STOCKS ARE NOT UNDERVALUED. The P/E ratio remains above average. Wall Street STILL EXPECTS 13% GROWTH in 2023. Maybe that will happen, but our economic model says they are wrong. Earnings estimates will need to be lowered, which means stock prices need to come down – a lot.
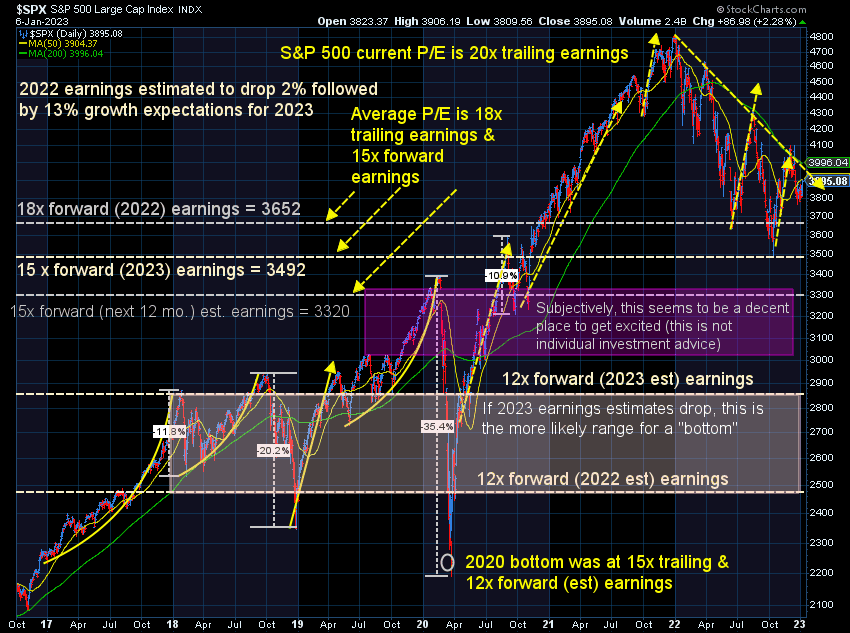
Subjectively, I continue to look at the 3000-3300 area as a time I'd be excited about stocks. That's 15-23% lower from here. As the chart shows, if the recession lasts longer or goes deeper than expected, the "bottom" is likely much lower.
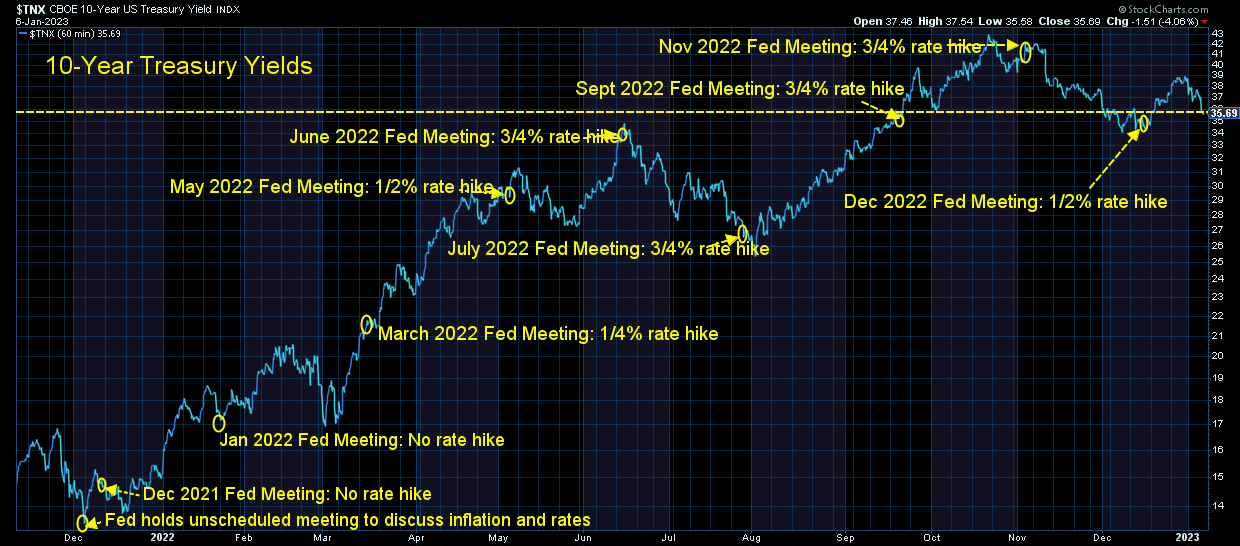
Turning to bonds, yields dropped significantly following the jobs report. The "soft landing" crowd believes growth has slowed enough the Fed will not have to raise rates as quickly as thought. Maybe they are right, but as mentioned earlier, if the Fed waits too long, the higher rates of inflation become more "normal", which makes it harder to reduce it down to their target level of 2%. This makes it harder on the economy (and corporate earnings) to grow at a "normal" level.
Long-term yields are attempting to end their uptrend, which would help take pressure off of the economy (and corporate earnings). In a "normal" economy we would see bond yields fall as the economy slows, but obviously that didn't happen when inflation was running hot at the same time growth was slowing.
The key question the first half of the year will be whether or not the slowdown in growth will be enough to stop inflation (and thus the Fed) without hurting corporate earnings. I've outlined what our economic model says. It could be wrong, but a data driven models allow us to not have to be "right" about our predictions, which is a comfortable place to be.
Tread carefully. Do not let the excitement of the latest bear market rally prevent you from making wise decisions.


