
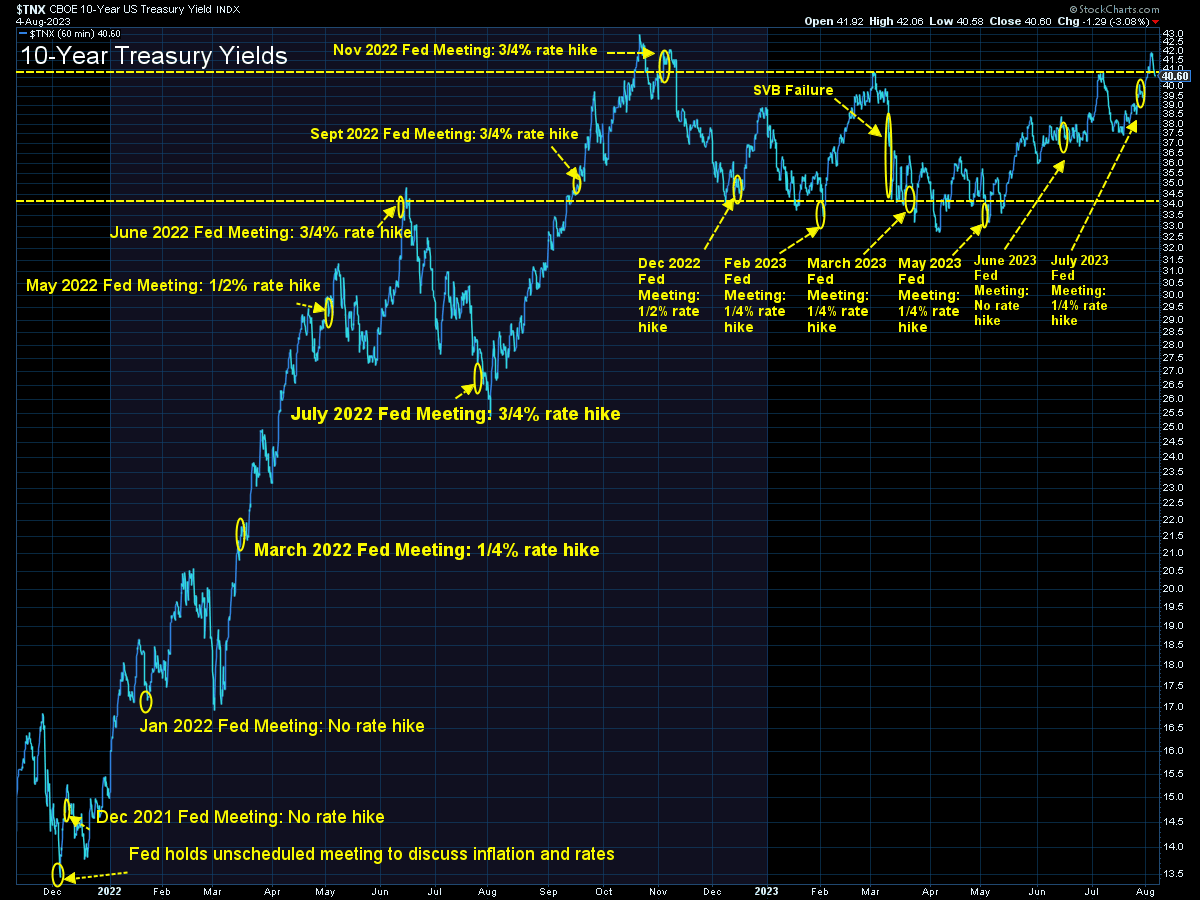
The 'new economy' we discussed last week took a hit. A weaker than expected jobs report sent stocks higher for most of the day on Friday. This followed the largest sell-off since April of this year after Fitch downgraded the US credit rating. Interest rates on Treasury Bonds shot above 4% on the 10-year bond and hit their highest level since November of last year. Amazon, Apple, Microsoft, and many other big name companies are reporting record profits.
It's hard to make sense of what is going on, which is the best time to turn to the data. As we do following the monthly Payrolls report each month, we provide an update to our quantitative economic model below. This week's headline spoils the ending – Still Slowing. If you want to see the details keep reading.
Our dashboard tells the story. We've actually seen a slight weakening in most of the components. While all the components are part of the "leading indicator" index and help to tell the story of what we should expect in the economy, we've sorted it in order of the "prediction" score, or how successful it has been in the past of predicting the economic direction by itself.
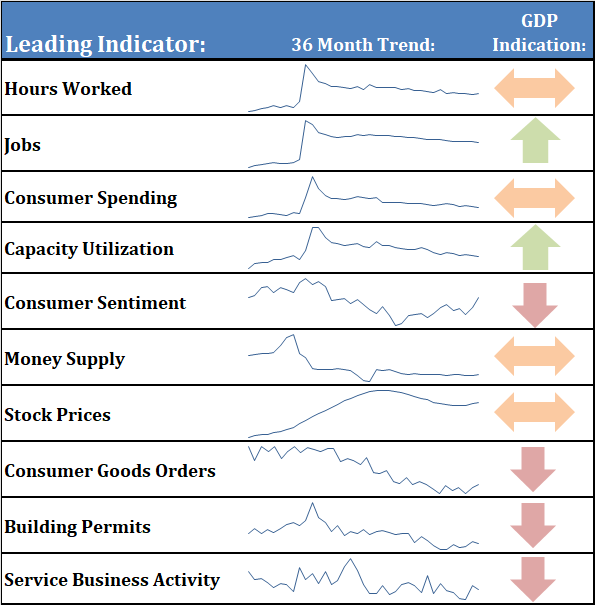
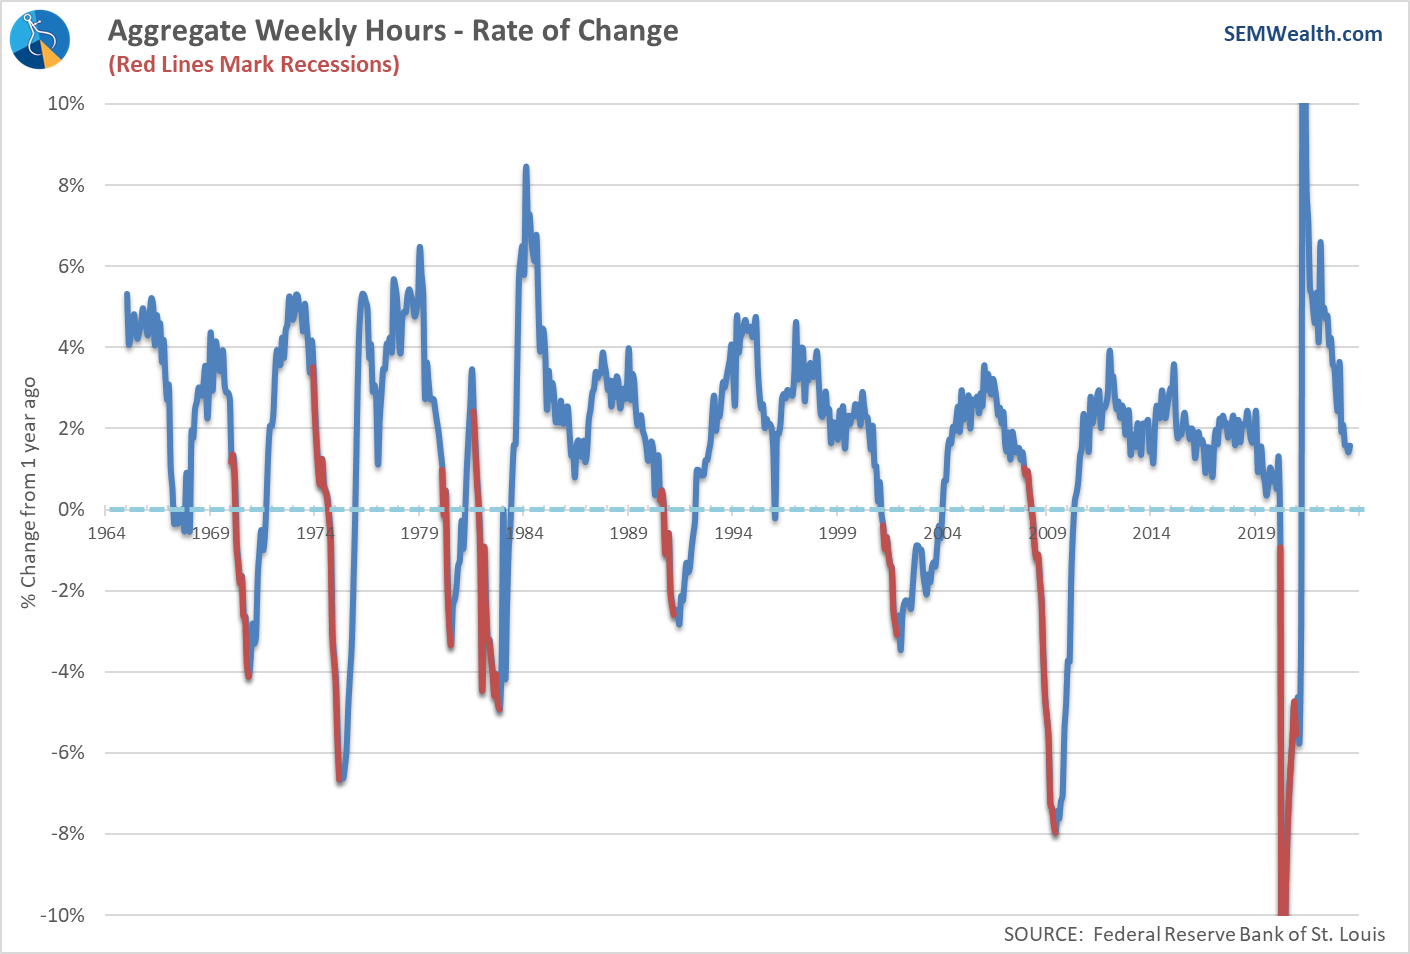
Hours Worked continues to weaken as the first sign of too many employees at US companies.
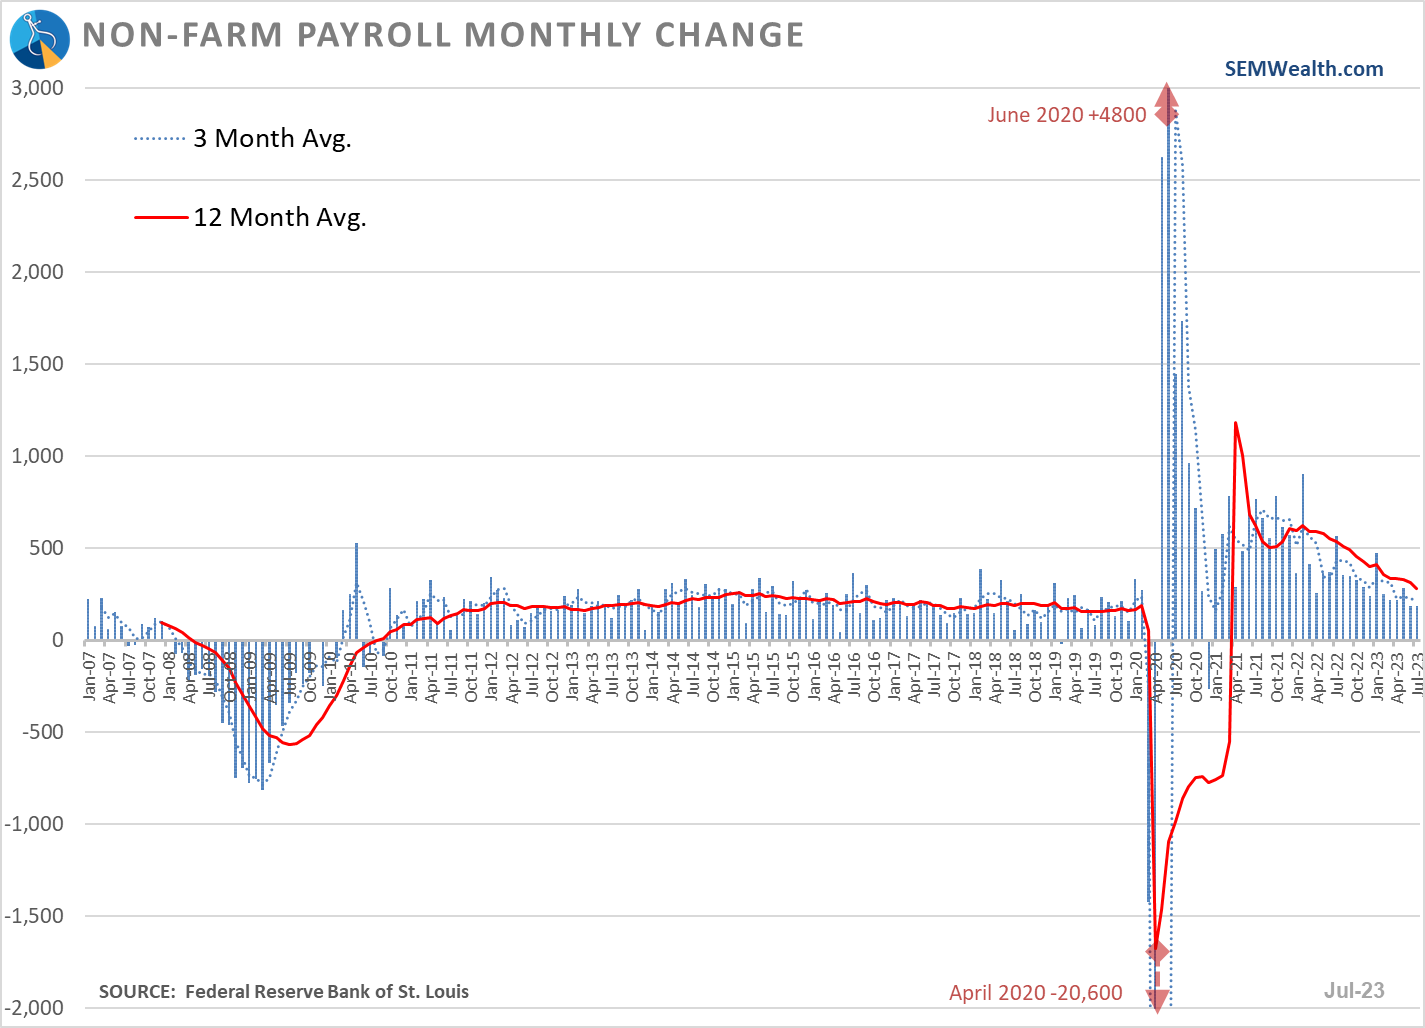
The number of (estimated) new jobs remains steady, but the pace has slowed quite a bit.
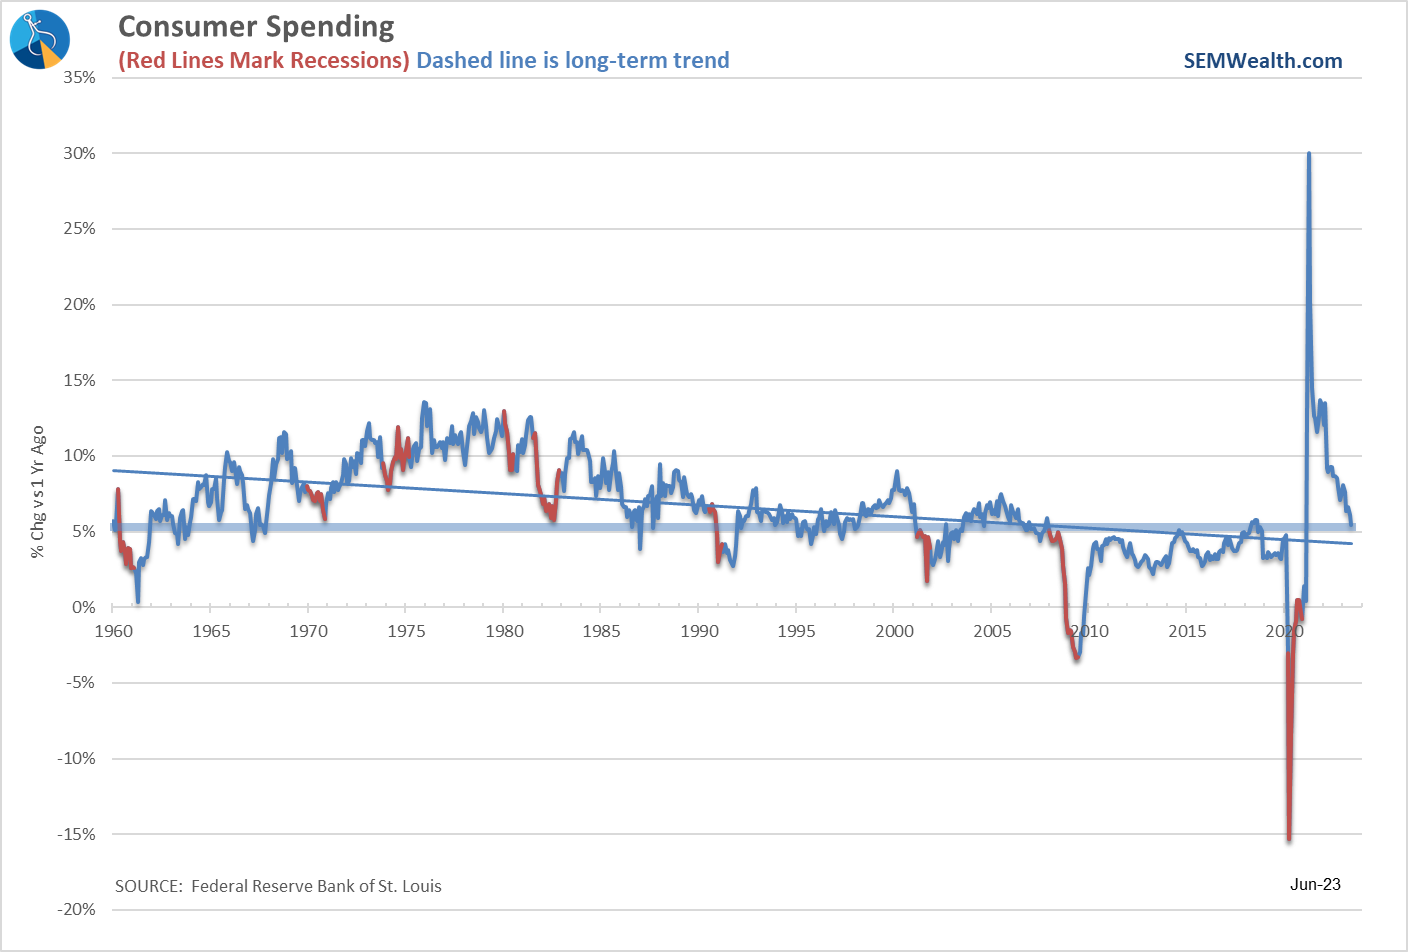
Consumer Spending, as we mentioned last week remains strong, but the pace of increases has slowed over the past few months.
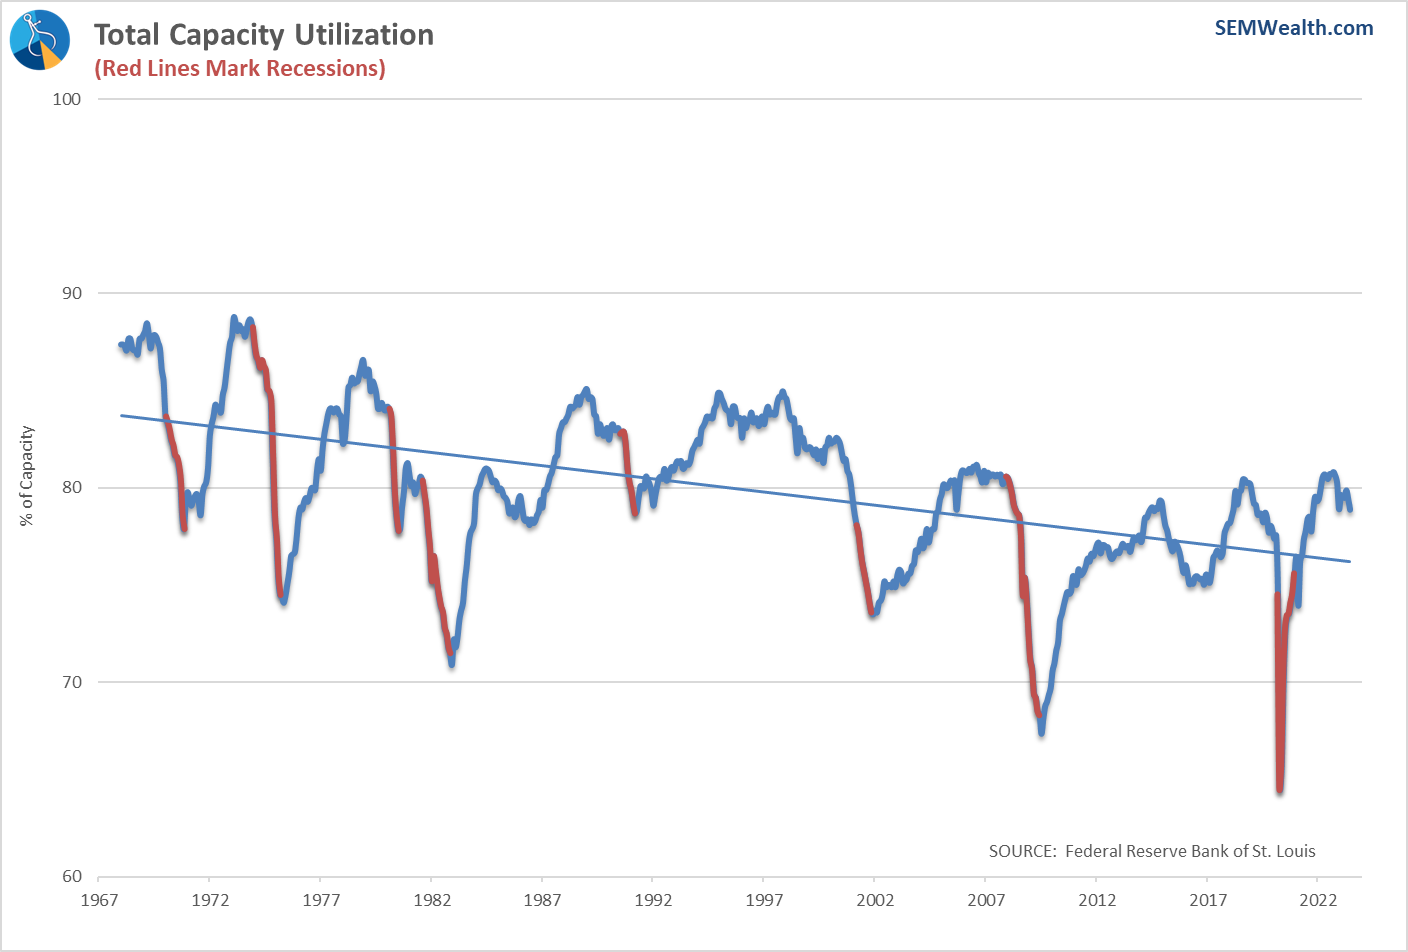
Capacity Utilization has slipped, but is still well above the lows and at a level where we aren't immediately worried about the economy (yet).
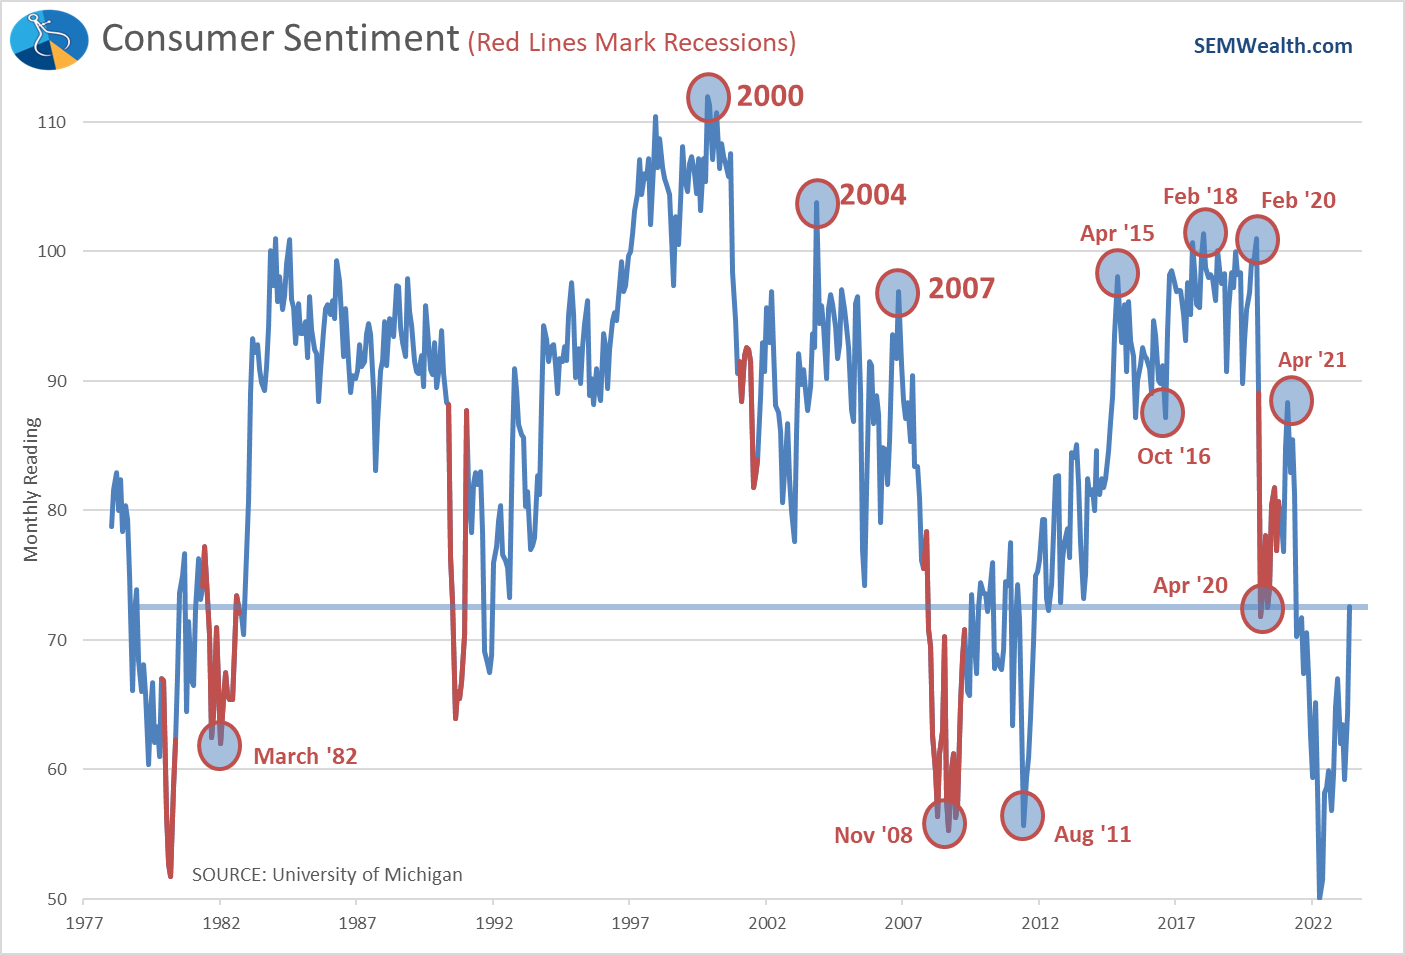
Consumer Sentiment jumped last month, but it still remains at a level which is not constructive to strong growth.
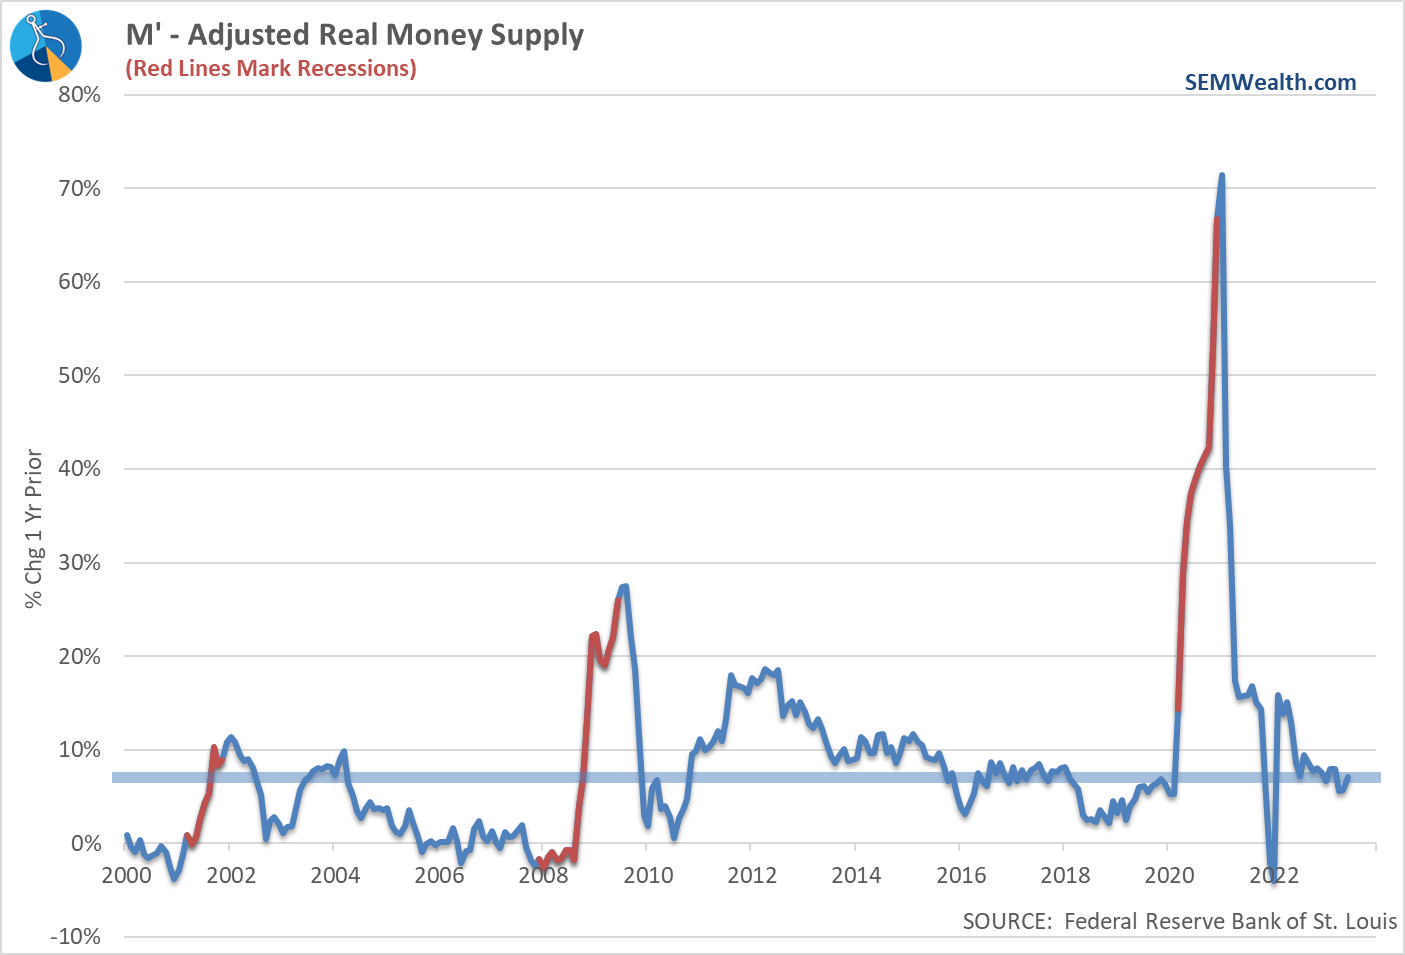
The Fed continues to pull back the Money Supply which is starting to show up with reduced lending and other early signs of financial stress.
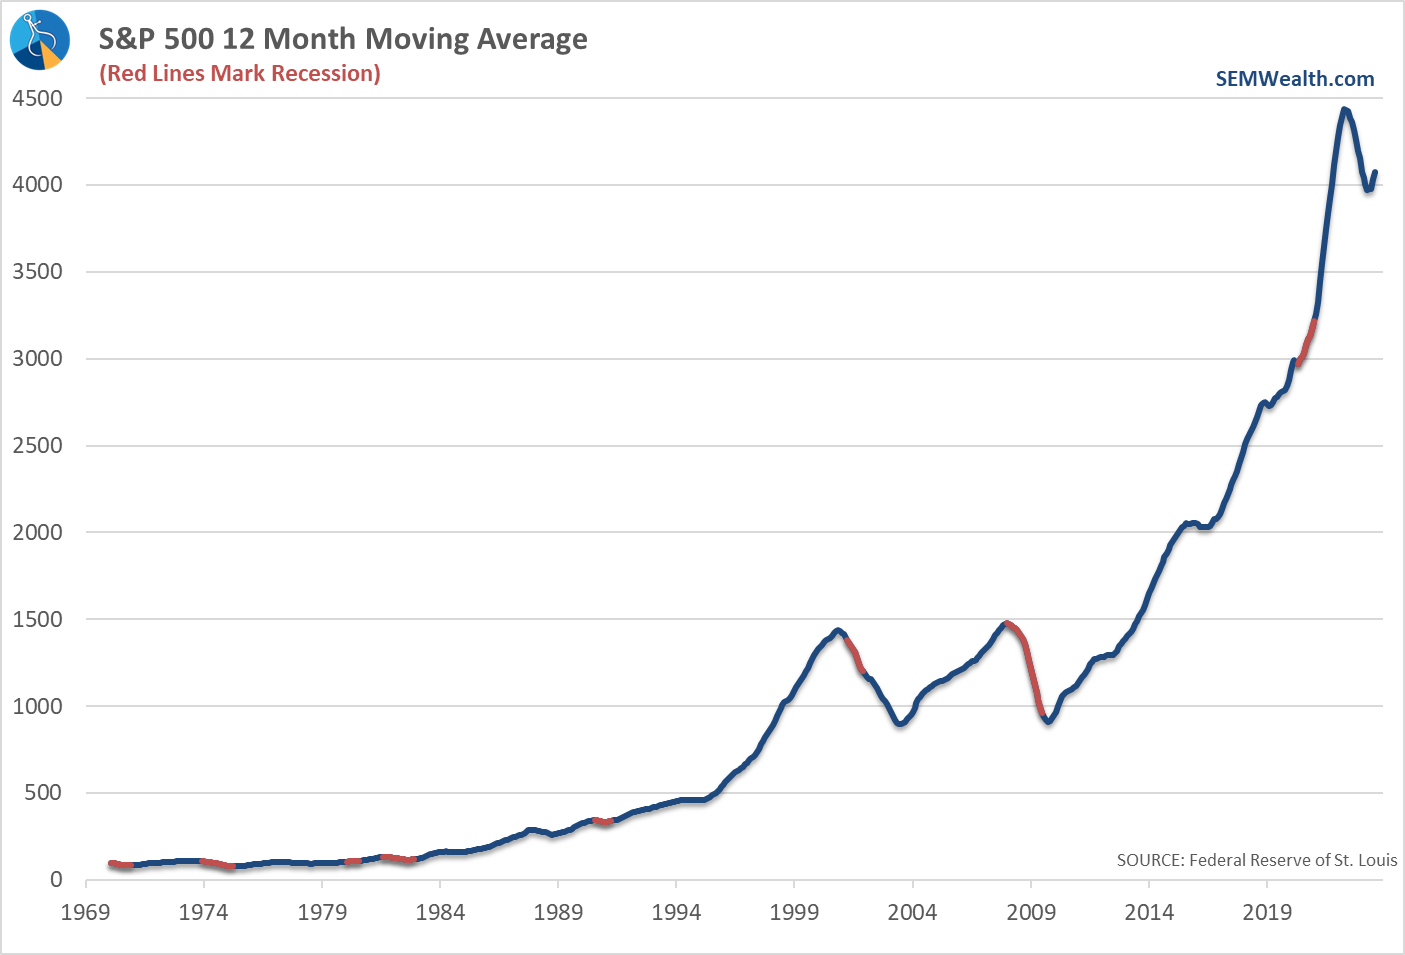
Stock Prices have obviously bounced, but at least according to our models have reached a price where we could expect a slowdown/drop.
Consumer Goods Orders remain in 'contraction' territory.
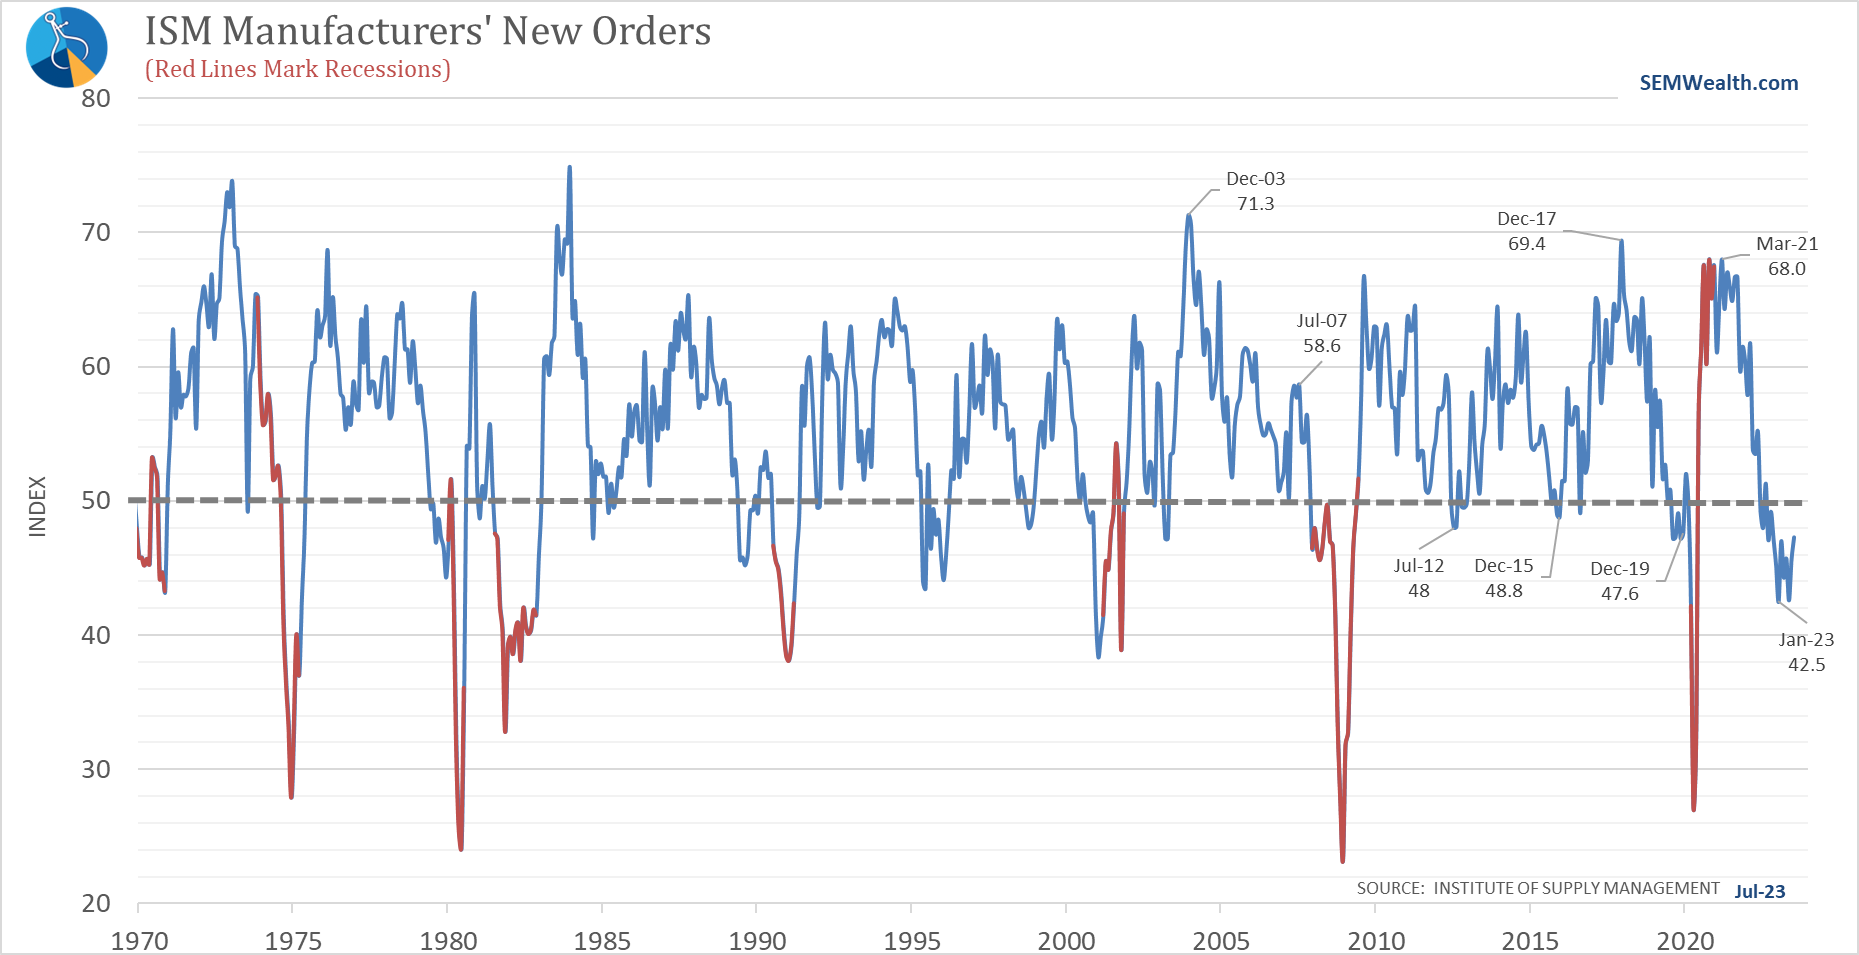
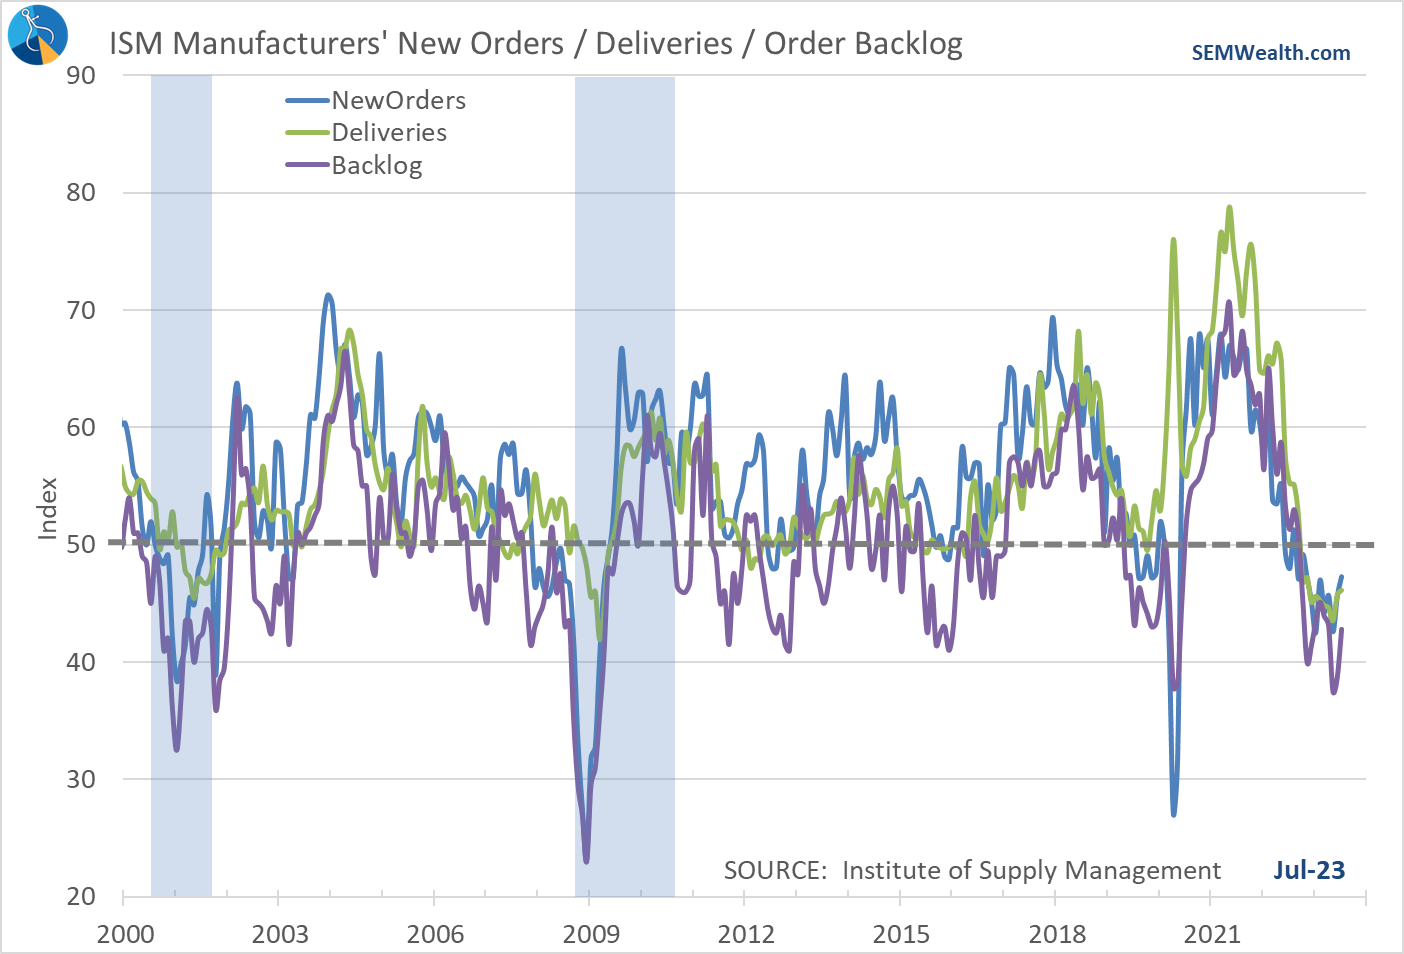
The leading indicators of orders inside the ISM Index point to continued weakness in the months ahead.
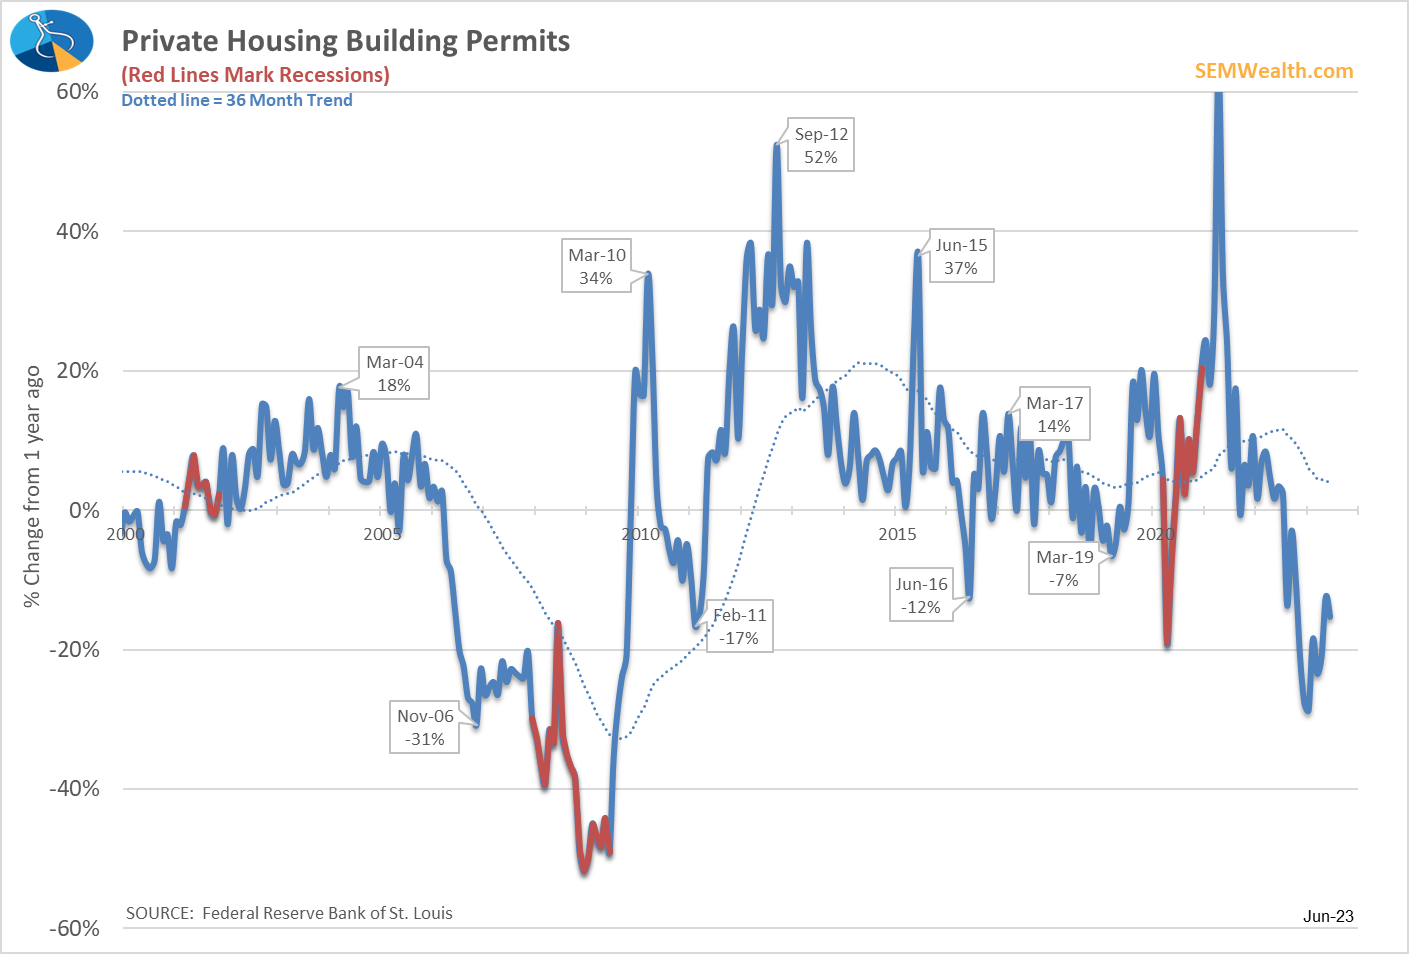
Building Permits continue to run well below where they were a year ago.
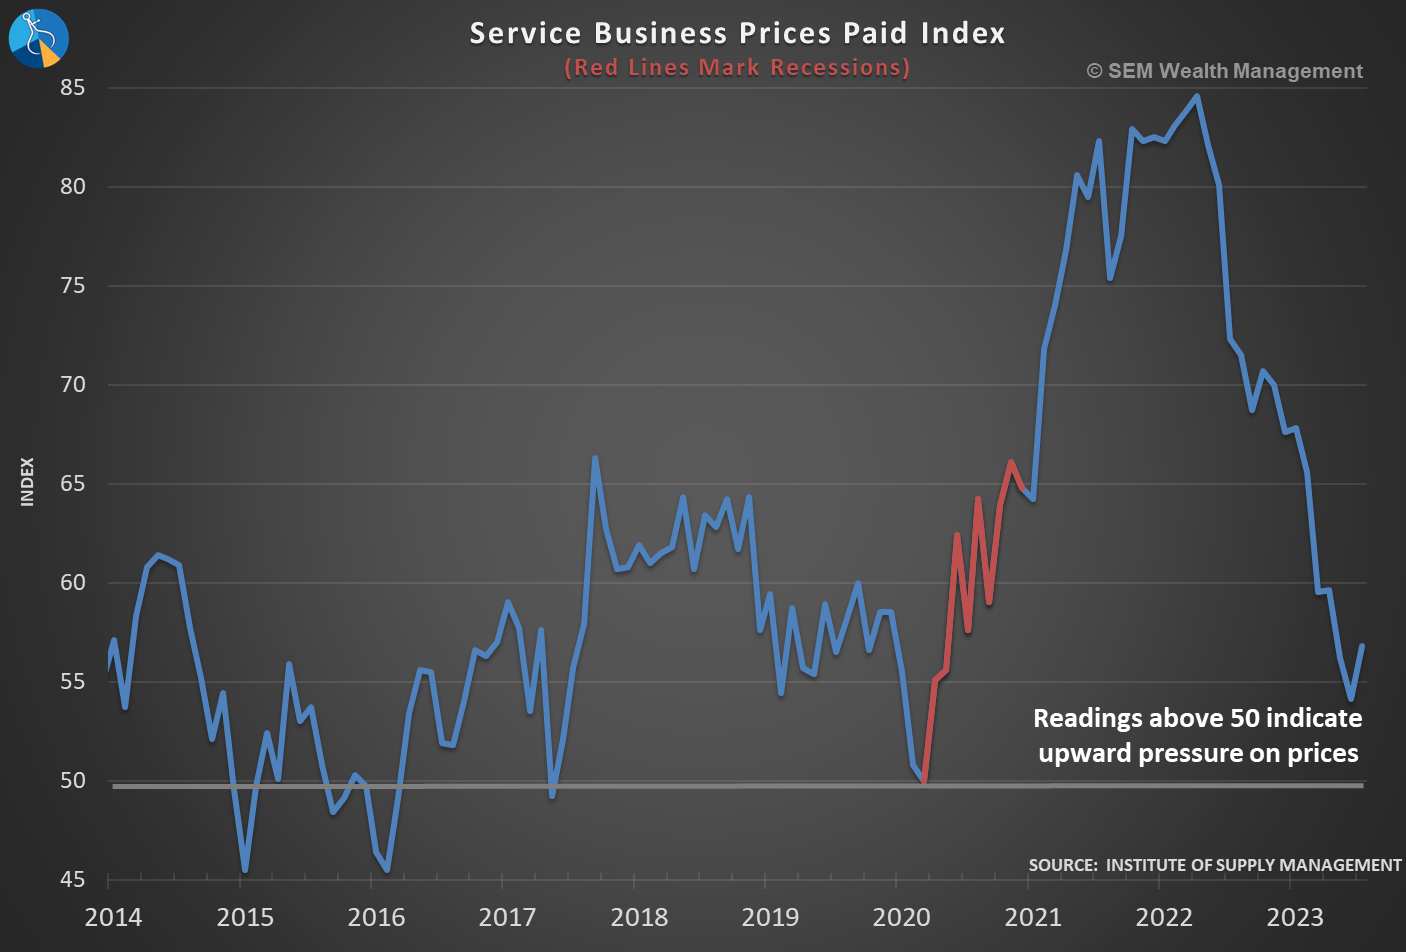
Finally, Service Business Activity while still in 'expansion' levels has fallen enough to wave a warning flag for the economy.
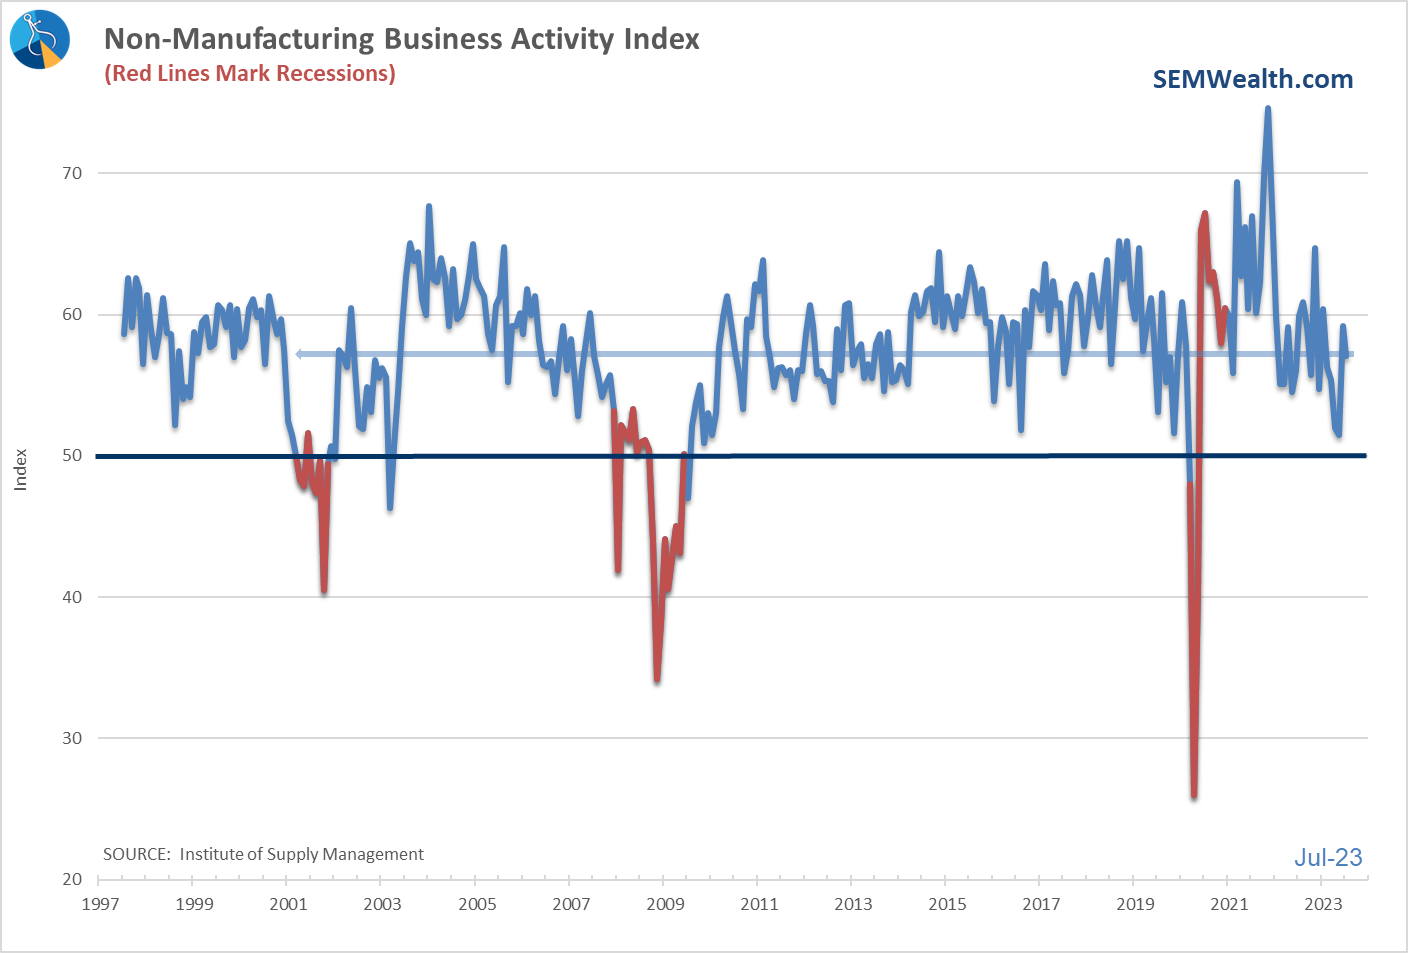
More importantly, the upward pressure on Service Business Prices remains high, something that could throw a wrench in the Fed's plans and those banking on the Fed to stop hiking rates (along with the big spike in oil prices the past month and continued increases in real estate prices)
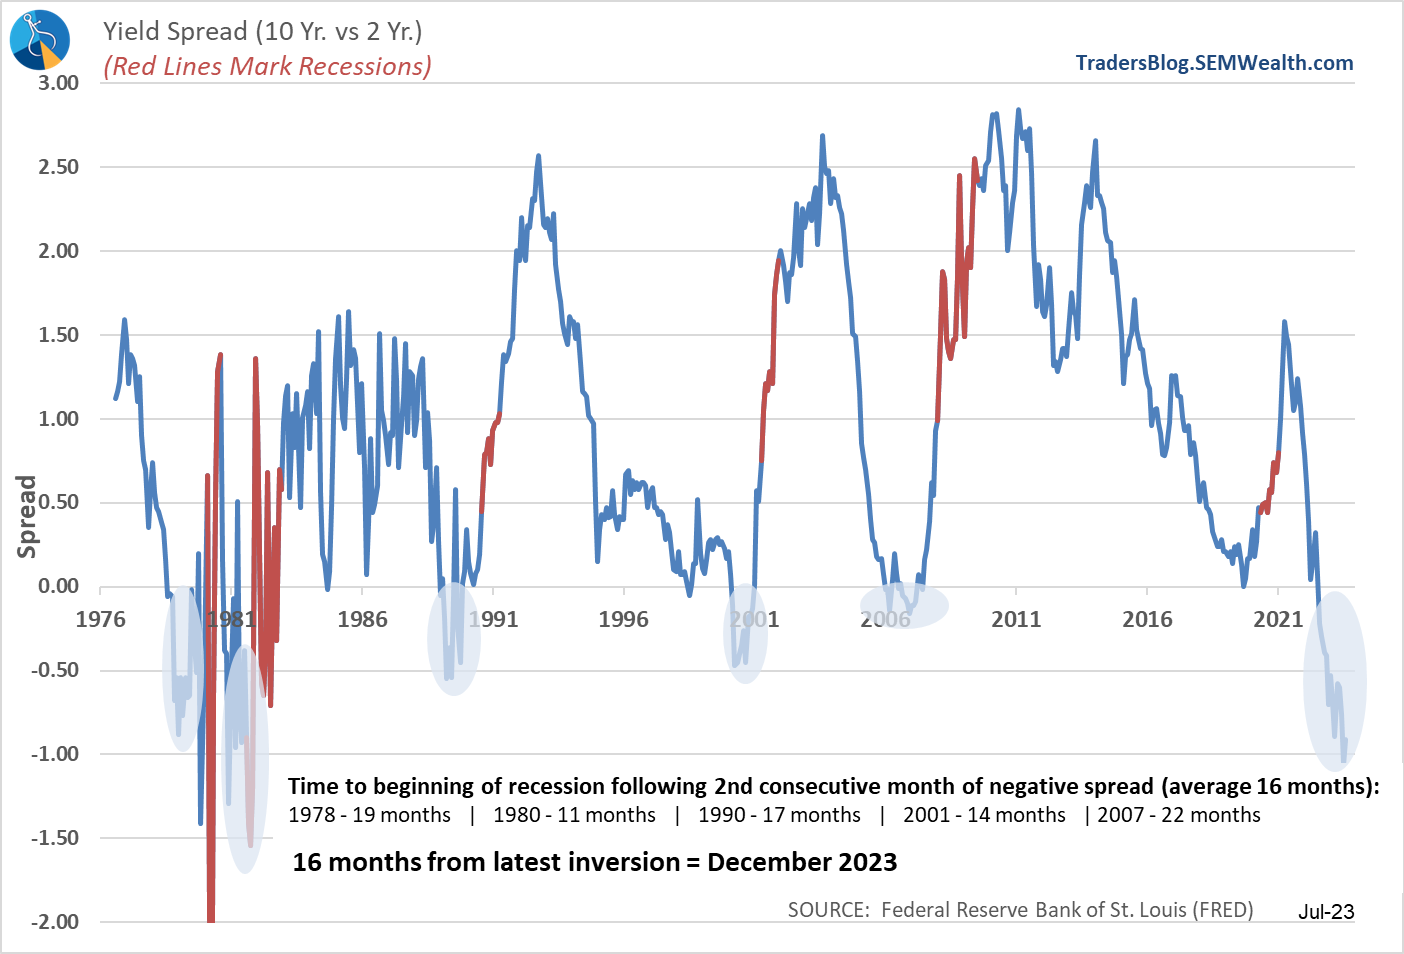
The bond market is still pointing to a recession and remains far more concerned about it than the stock market (obviously). Long-time readers know that I trust the bond market's direction far more than the stock market's as bond traders/investors are looking at the ability of a company to pay them back while stock market traders/investors are just hoping to be able to sell at a higher price. The deeper inversion of the yield curve and the spike in rates last week does not give me confidence the market will be able to continue marching higher without some sort of correction.
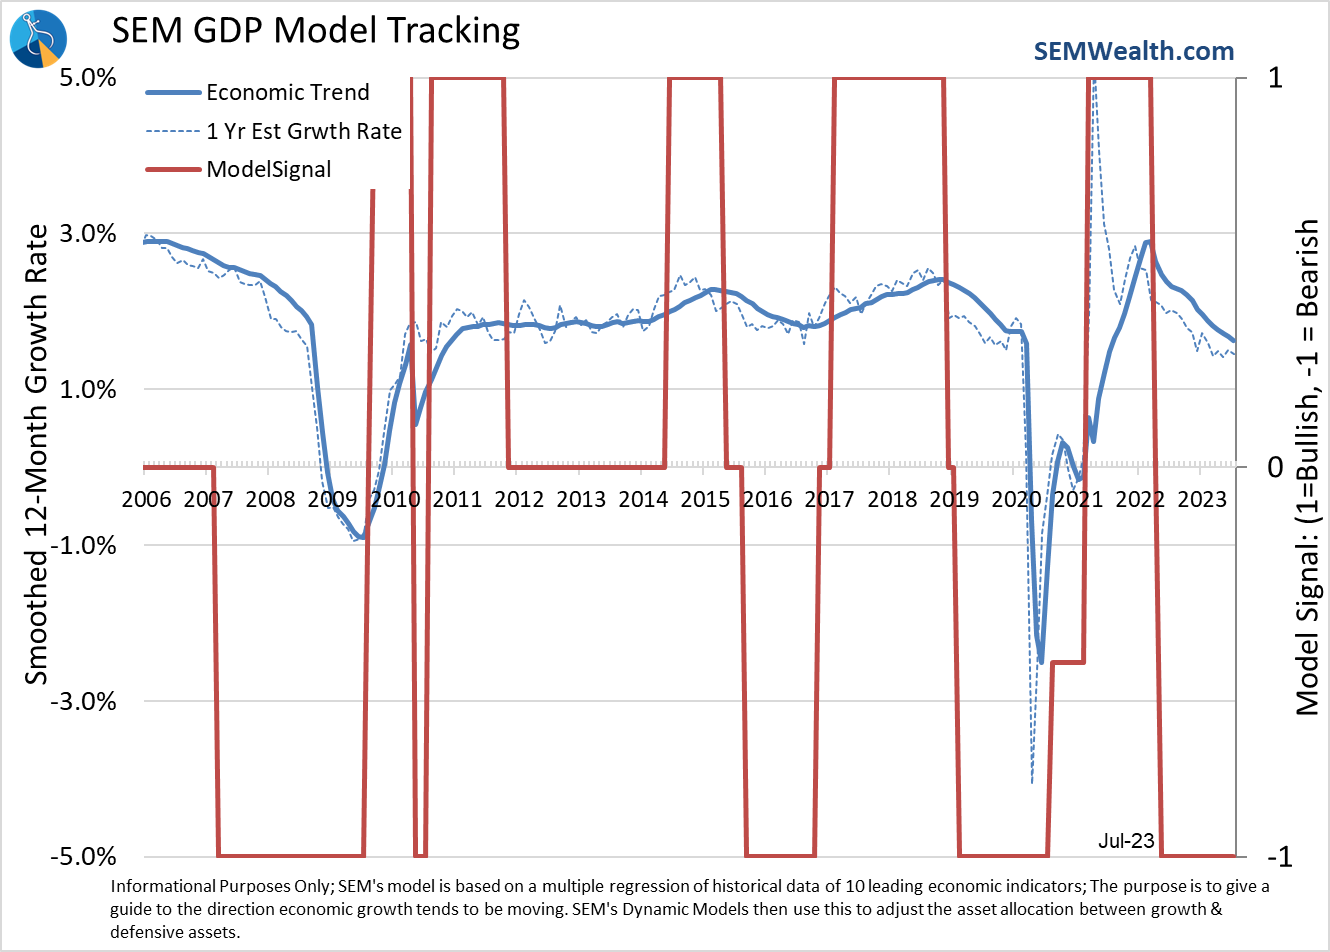
Turning to our model, it remains in "bearish" mode as it has been since April 2022. This doesn't mean it is predicting a recession, but rather that the overall economic data is SLOWING, which should eventually hit corporate sales and earnings. While the pandemic along with unprecedented stimulus to fight it may be causing a disconnect in some sectors, nothing has changed overall with the economy.
Consumers drive spending. If they become concerned it filters through to jobs, manufacturing orders, housing, and everything else. The indicators are designed to monitor those and for now it says caution is warranted.
Our model says the economy is slowing. Profit margins appear to have peaked and have declined the last few quarters. A slowing economy should lead to slower sales. At the same time the 'risk free' interest rates (3-month Treasury bills/money markets) have gone from 2.4% a year ago to 5.3% today. You would think the "equity risk premium" would be increasing, which should lead to LOWER valuation multiples for stocks. Instead we've seen multiples hit the highest levels since the 2021 meme-stock bubble.
It seems like the market will never go down, which is the time we get worried the most. We do not make bets or changes in our investments based on 'feelings'. Instead we trust the data (more in the section below).
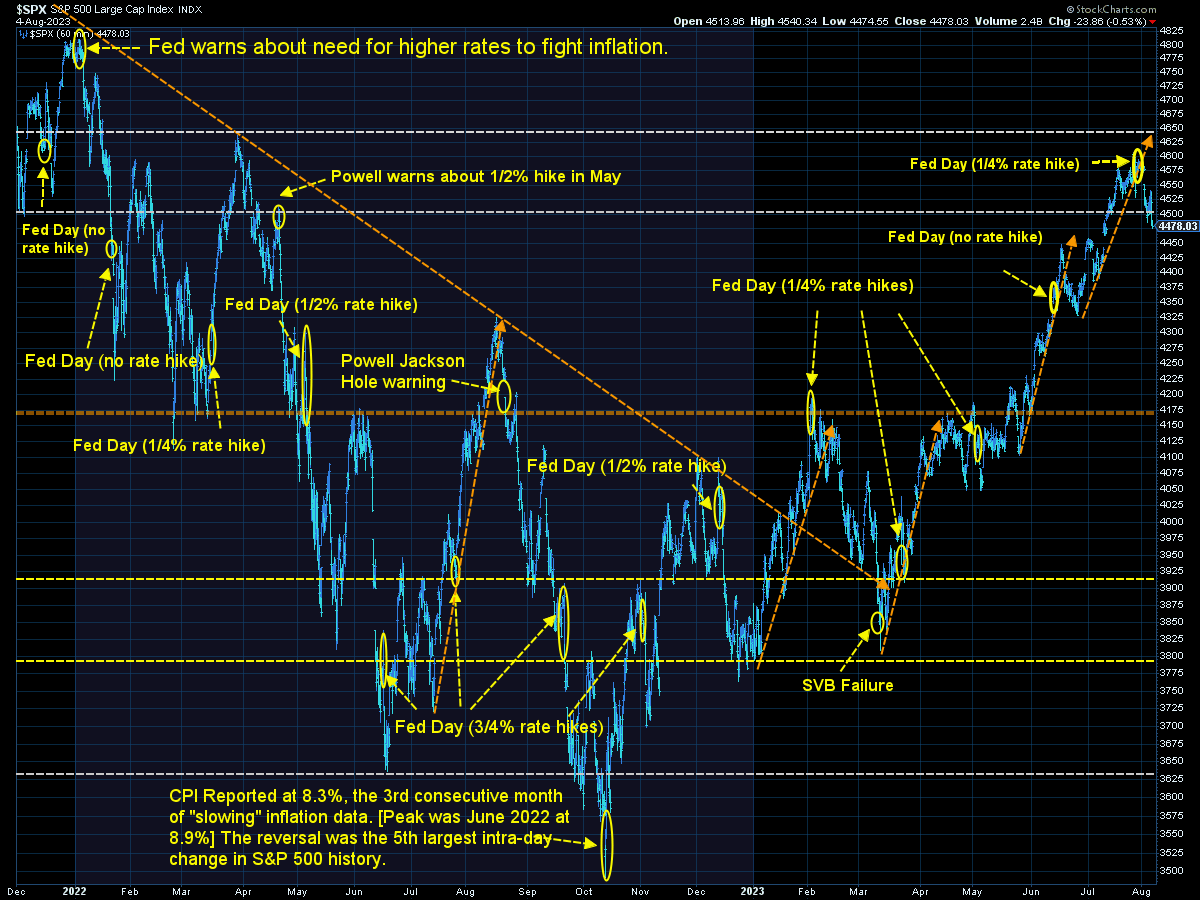
The S&P 500 has been moving in multiples of 100 points, which is usually driven by derivatives activity (which are priced in round numbers). The S&P jumped quickly from 4400 to 4600 and then tried to hold 4500. If we don't see a rally early in the week to retake the 4500 level, it could get interesting.
SEM Market Positioning
While all of the things above are certainly on our radar, we remain heavily invested. The key difference between our advice to readers and our own investments is we have a quantitatively based plan to leave the party when things start to look shaky (and we take those moves without broadcasting them in the blog)
There were no changes (again) last week in any of our models. We remain mostly invested in high yield bonds in Tactical Bond, Income Allocator, and Cornerstone Bond. We remain "bearish" in the Dynamic models (reduced risk exposure based on our economic model), and right in between minimum and maximum exposure in our 'strategic' models.