
At least across the southern part of the United States, this is the time of year few people enjoy being outside (unless you can be near or in the water). I heard somebody describe it as the 'dog days of August' which made me wonder about the origin of the term.
The Farmer's Almanac defines the 'dog days' of Summer as the 40 days ending August 11. The origin of the term comes from astrology and the appearance of a group of stars named Canis Major or "Greater Dog". Thus the days often shift around a bit, but since ancient times the appearance of the "Dog Star" has typically meant hot, humid, and often volatile weather along with periods of drought.
We're certainly in the midst of the 'dog days' for the markets as well.
There wasn't a lot of news last week. The 'highlight' was supposed to be the latest release of the Consumer Price Index (CPI) data. Depending on which headline you read or data you focused on it was either good or bad news. Our economic model (as well as the Federal Reserve) prefers the Core PCE Index to measure inflation, so we typically do not pay much attention to it.
With that disclaimer, my brief assessment of the CPI data was it doesn't help those arguing for an end to the Fed's inflation fight.
Overall, inflation ticked up a bit to 3.2%. The "Core" (excluding food & energy) index was down just slightly to 4.7%. Services inflation, which includes 'shelter' remains high at 6.1%.
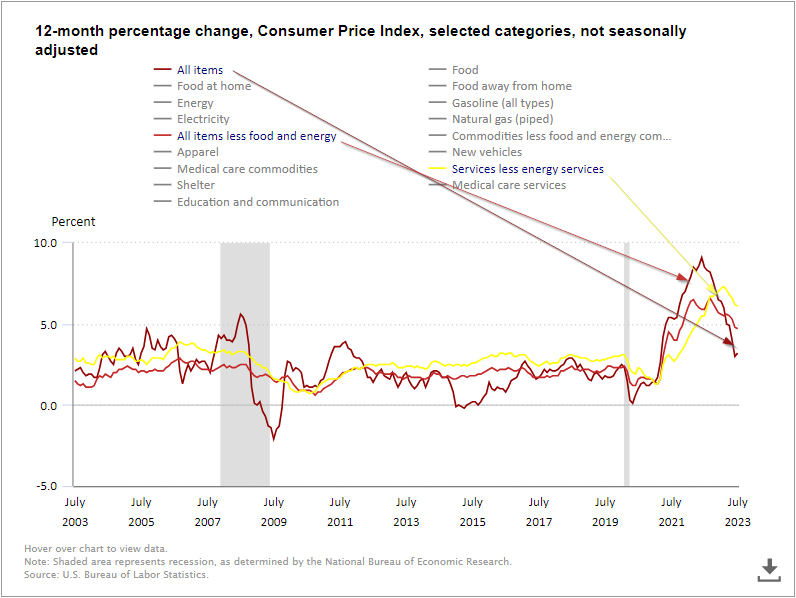
Energy prices have again been going up which will likely filter down to the rest of the economy, which could make the Fed's job much harder. We've also witnessed housing prices going back up despite higher interest rates, which will keep the pressure on inflation. Worse for stocks though is it appears from some of the big brand earnings reports so far this quarter revenue growth is slowing after they tried to pass through more price increases to the end consumer.
The 'dog days' of the market make it difficult to make much of an assessment of the reaction to news items. This week, other than the minutes from the Federal Reserve's last meeting being released, there is again little important information on the agenda.
The summer months are usually the worst for stocks (which is where the 'sell in May and go away' adage was born.)
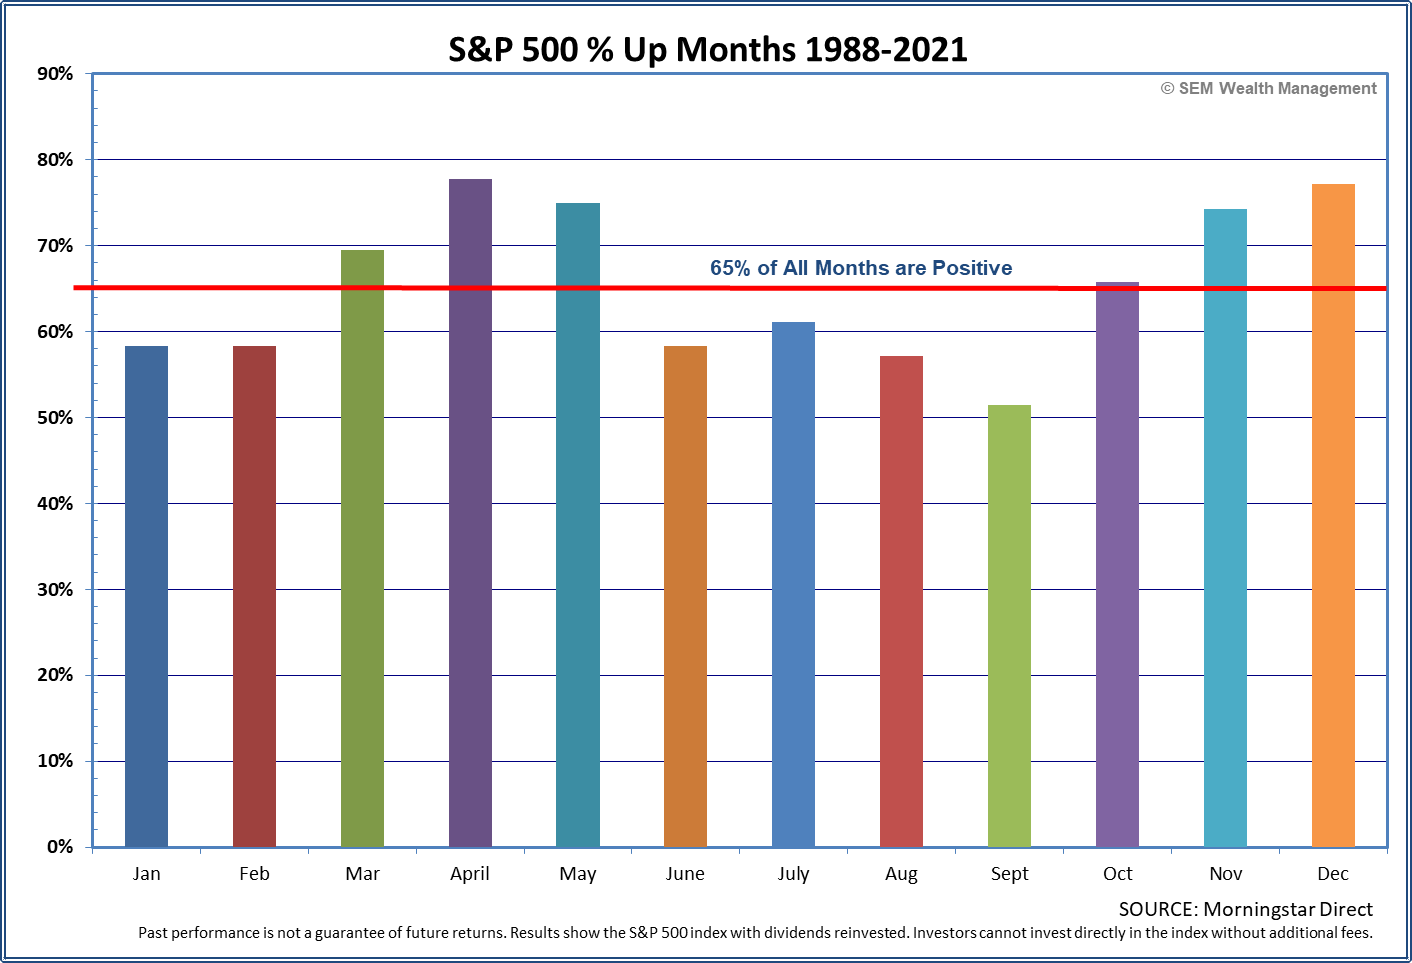
July is actually one of the best months. August is on average negative although we can see some big returns (including a 6% jump in 2000 and a 7% gain in 2020).
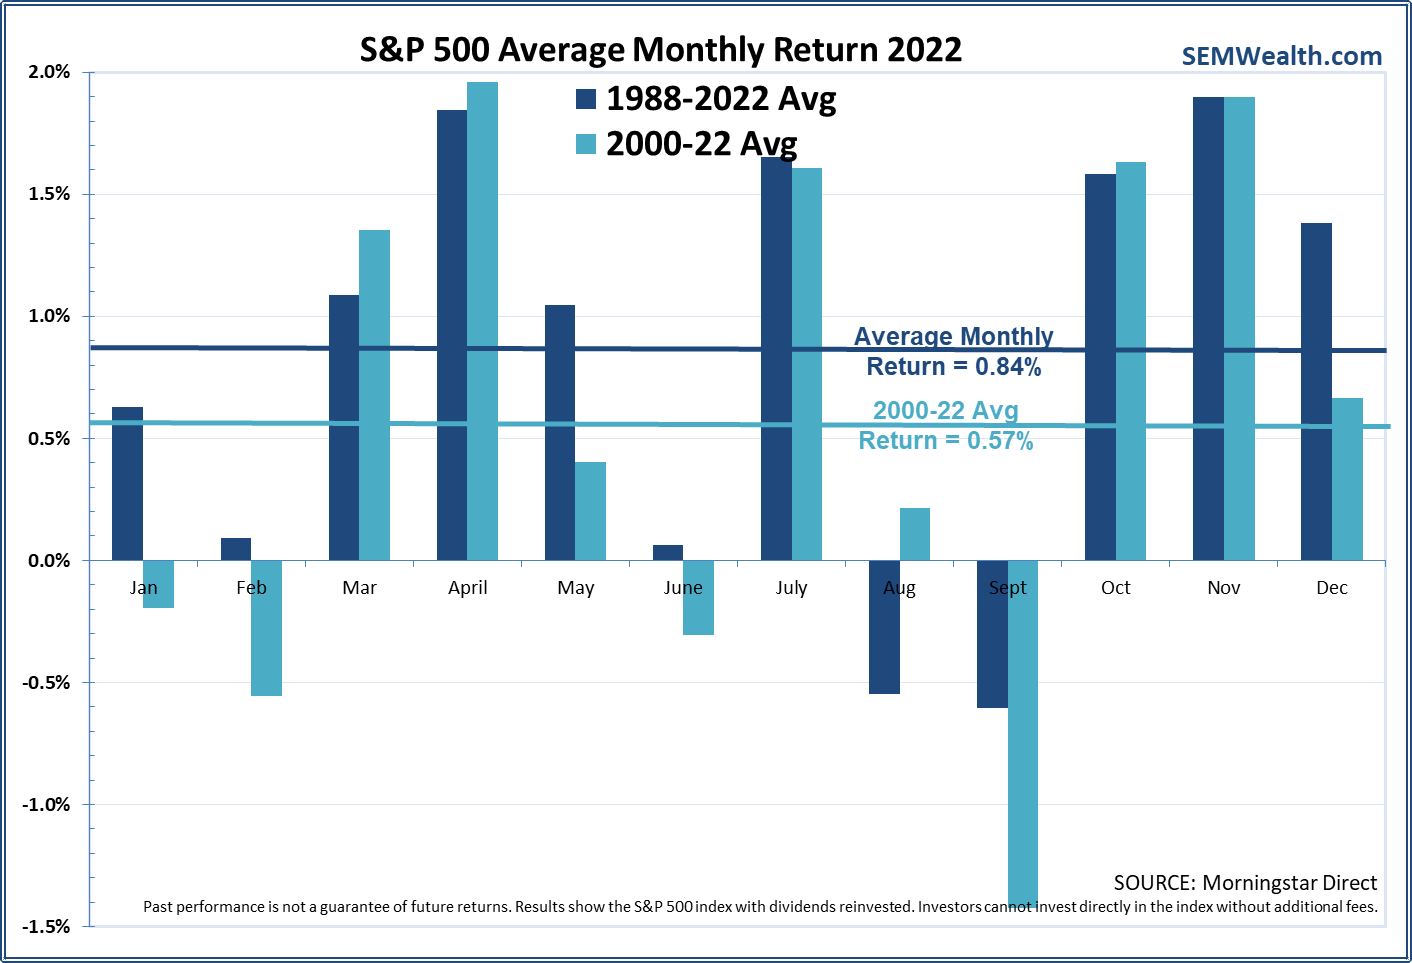
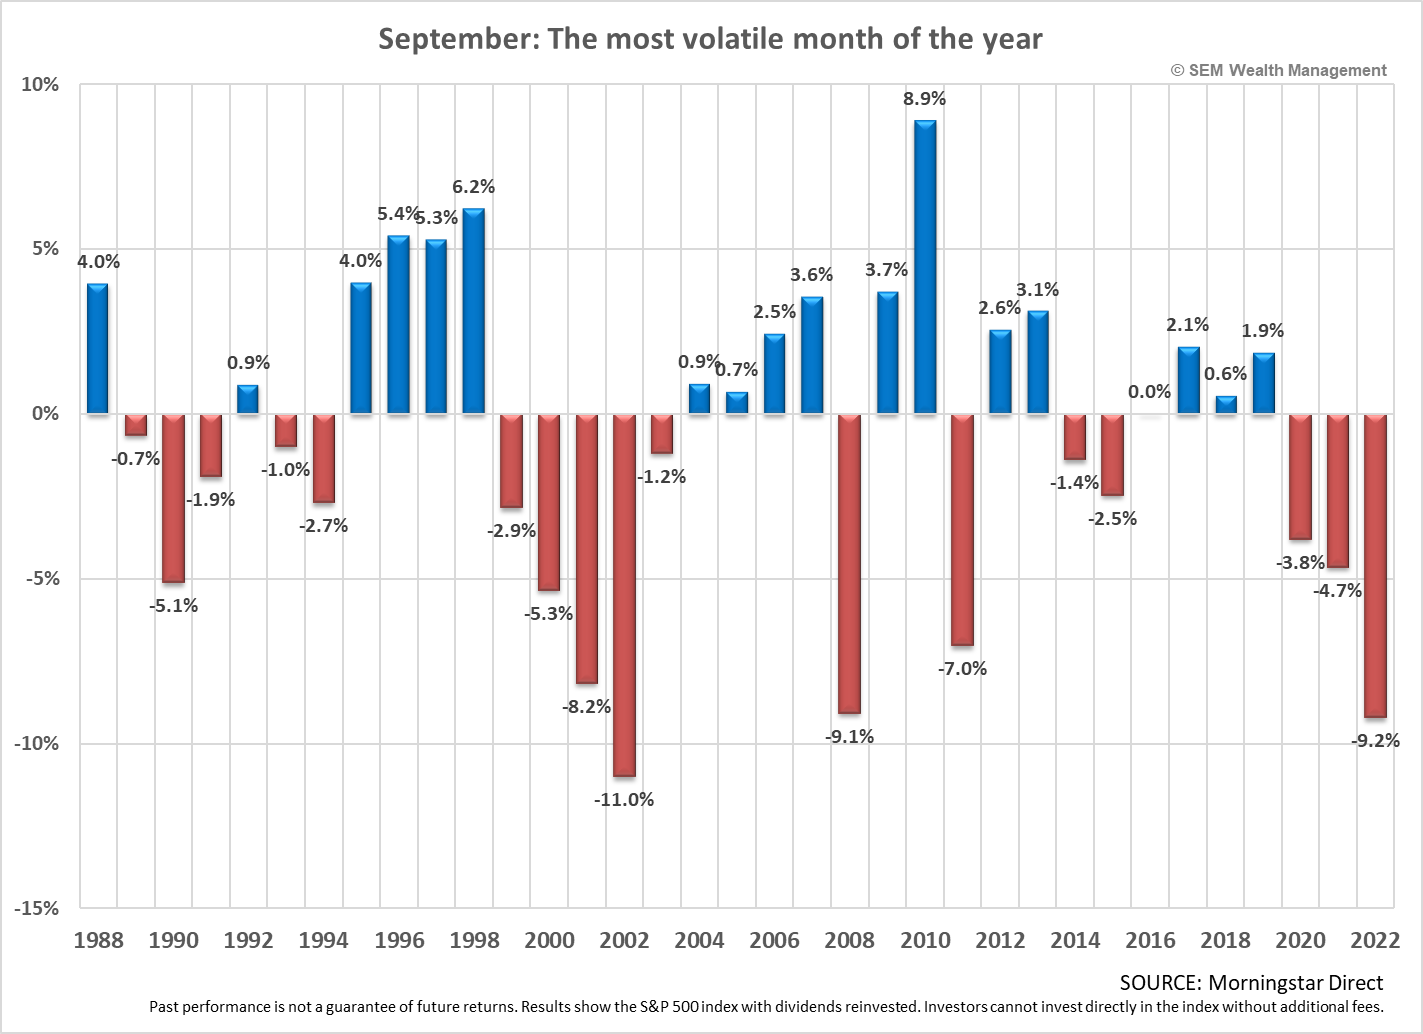
After the 'dog days', September is by far the worst month of the year by a long shot, but we can still see some nice returns at times.
We've been seeing an increasing amount of clients (and advisors) falling into the belief that the worst is over for stocks and now is a good time to take on more risk. The data says the opposite. For anybody believing this, I'd encourage you to take some time this week to read this article:

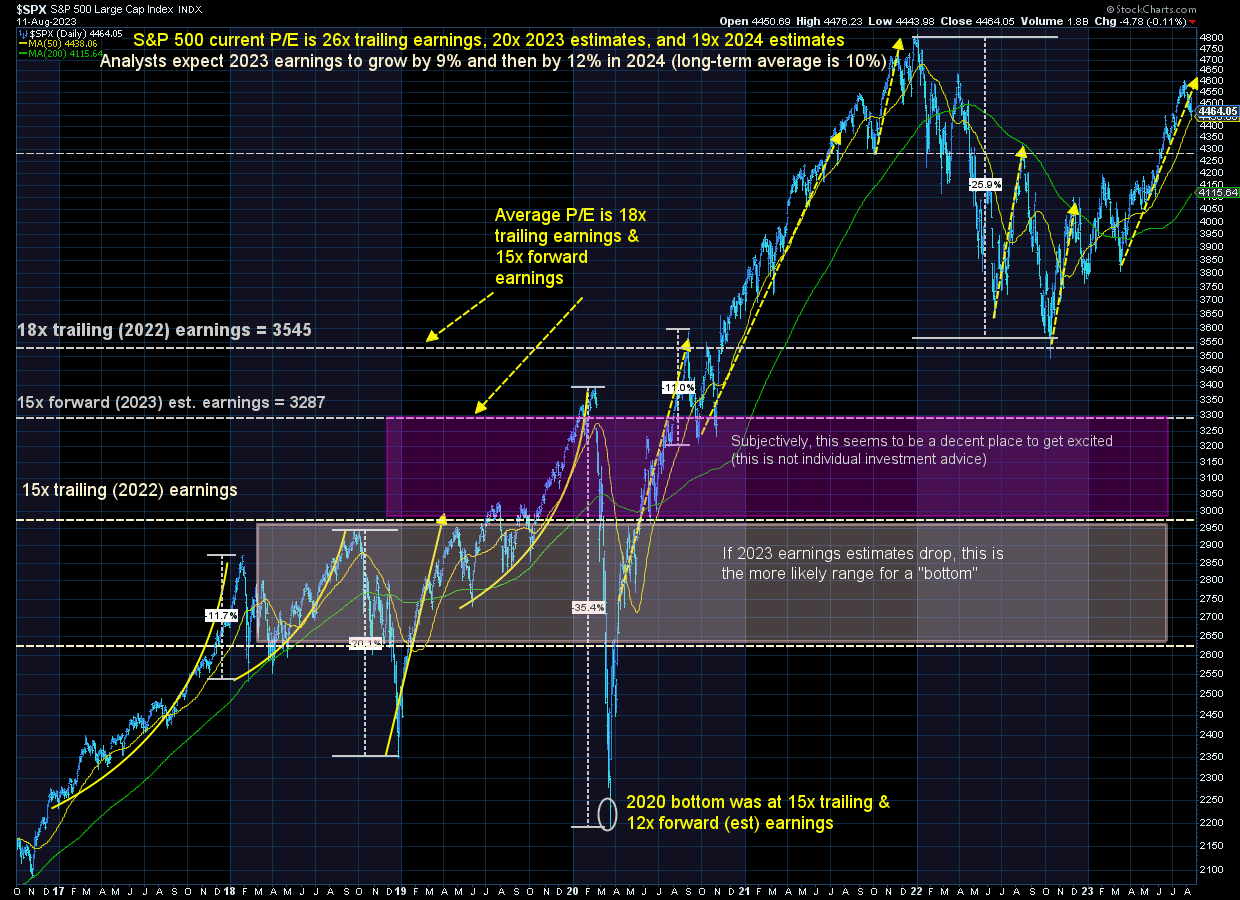
Stocks are close to historically high valuations. Interest rates are approaching the highest levels this century. Dividend yields are near historic lows. Profit margins are trending lower. Fundamentally all of this should means stocks are due for a big pullback.
That said, the markets often go up far longer than most of us believe is reasonable. A couple months ago I included some quotes from some successful investors discussing this. I could easily see stocks losing 20% going into the end of the year, but I could also see a 10%+ rally happening in stocks. Please be careful.
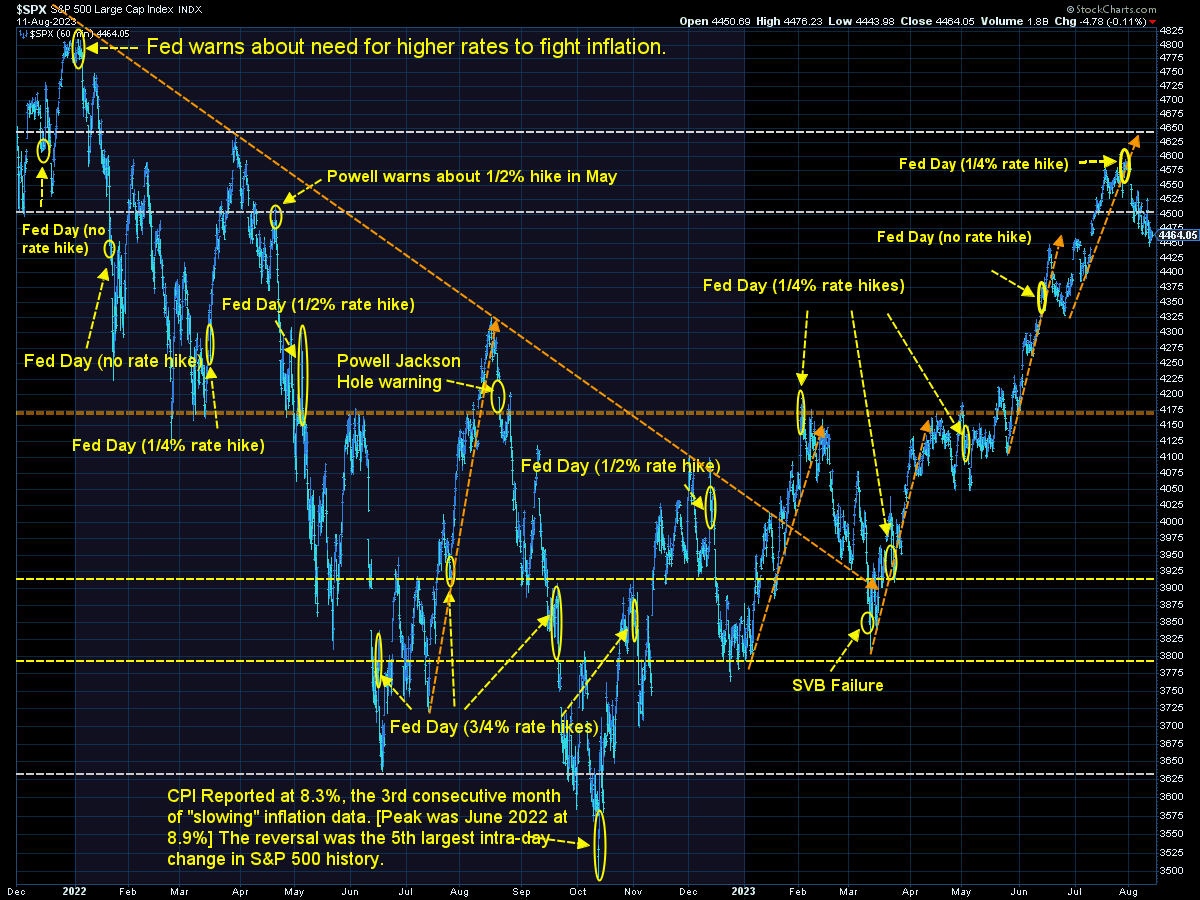
Looking at our charts, the S&P 500 seems to WANT to hold 4500, but it tried and failed multiple times the past two weeks. For those hoping to avoid a sell-off, they probably need to see it rally back above 4500 soon.
From a longer-term perspective, stocks are well above reasonable levels to enter with NEW long-term money.
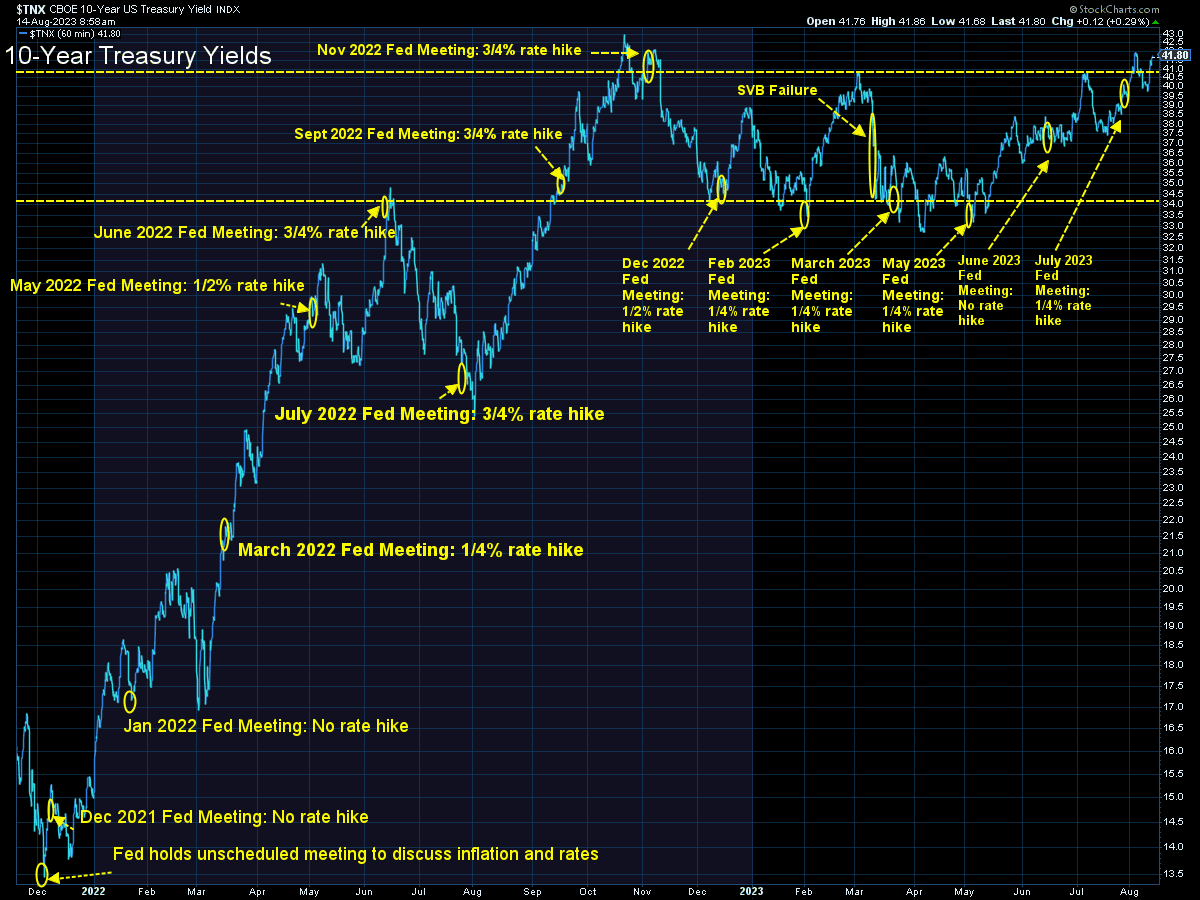
On the interest rate side, the bond market was not happy with the inflation data and rates are threatening to hit 10-year highs.
Our models are giving mixed signals (more in bold below). What is interesting is the sell-off in the S&P has had some positive internal characteristics, namely that the strength of the market on the downside appears to be widening.
SEM Market Positioning
While all of the things above are certainly on our radar, we remain heavily invested. The key difference between our advice to readers and our own investments is we have a quantitatively based plan to leave the party when things start to look shaky (and we take those moves without broadcasting them in the blog)
There were no changes (again) last week in any of our models. We remain mostly invested in high yield bonds in Tactical Bond, Income Allocator, and Cornerstone Bond. We remain "bearish" in the Dynamic models (reduced risk exposure based on our economic model), and right in between minimum and maximum exposure in our 'strategic' models.