Based on the January jobs report, our economy is heating up. In theory this is a good thing, but based on the fact the driver to the strong start to the year was the idea we were in a "Goldilocks" economy that is not a good thing. "Goldilocks" in economic terms means the economy is not 'too hot' (which causes inflation) and not 'too cold' (which is bad for everything). In today's market this meant a euphoric rally with the expectation the Federal Reserve would both be able to stop raising interest rates before any economic damage is done.
Stocks dropped following the report as the fear of more rate increases than expected were back on the table. Never mind the fact stocks rallied over 2% following the Fed's latest interest rate hike on Wednesday under the assumption rates would not be as high as expected (even though the Fed never said it and Chair Jerome Powell tried to make it clear the Fed would continue focusing on inflation for the 'foreseeable future'.)
I'll leave that guesswork to the 'experts' (who have been consistently wrong my whole career yet still get the attention of the media and investors). Instead we will focus on the data. Looking at the overall job growth you can see the spike in January above which landed back above the 12-month moving average and was the best performance since July 2022.

One thing to keep in mind is these are 'seasonally adjusted' ESTIMATES. The pandemic threw the seasonal adjustment models off so we will likely see adjustments to these numbers as things "normalize". Throughout the recovery we've seen a stark difference in the payroll survey, which is a survey of businesses and the household survey, which is based on a random survey of households. This chart shows the monthly change in the household survey. There's obviously a big difference between 590,000 and 89,000.
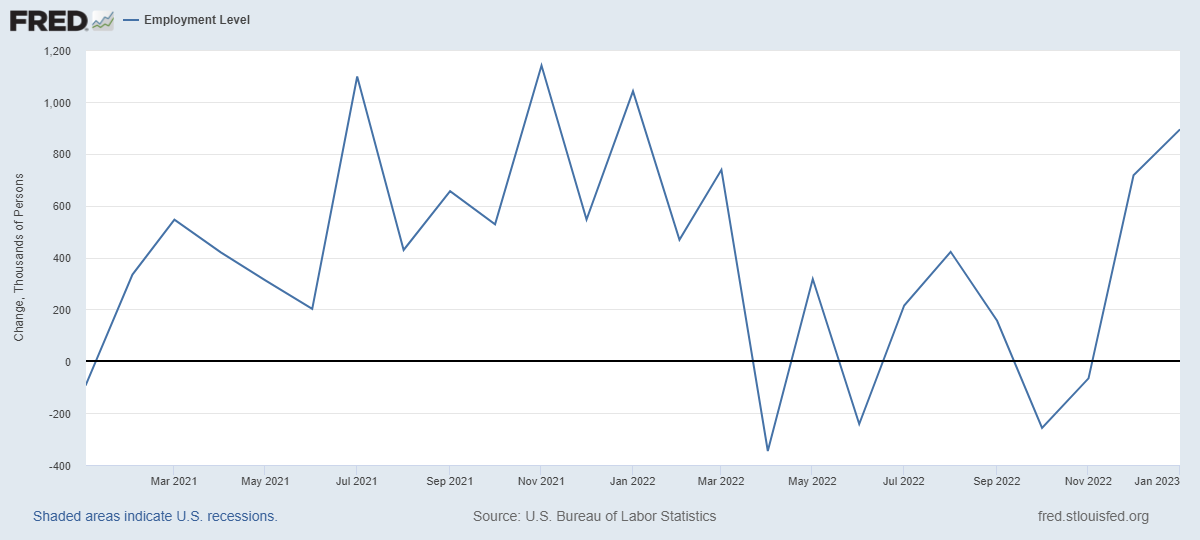
Whatever the 'normal' rate is, we can see the 1-year % change (which takes out seasonal factors) continues to be the strongest job market we've seen since the mid-1990s.

The reason a "hot" labor market is bad for stocks is because it can cause prolonged inflation pressures. This can make the Fed's job of controlling inflation that much more difficult. While wage inflation has come down, it was higher than expected and remains above 5%.

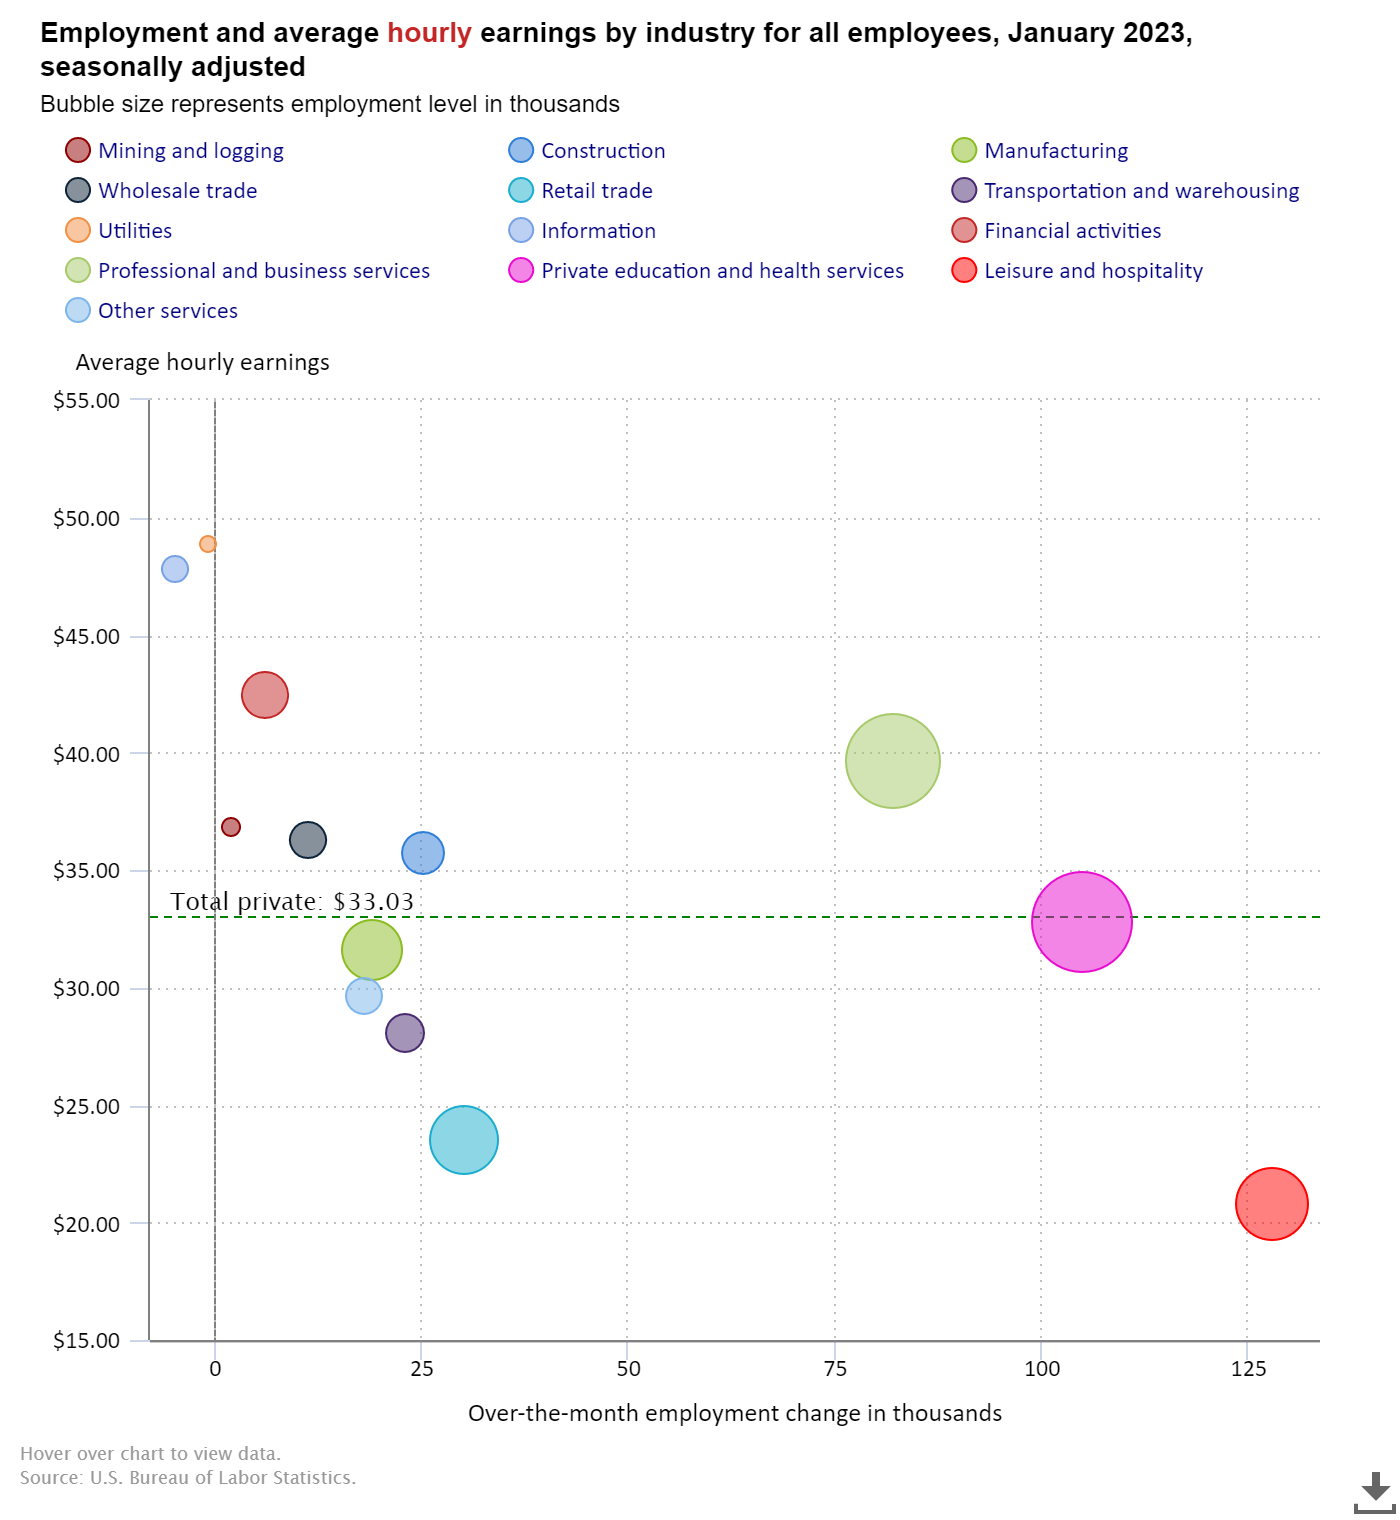
The good news (for those wanting to see the Fed stop raising interest rates) is the industry creating the most jobs remains leisure and hospitality, which are also the lowest paying jobs. However, the higher paying health services and professional/businesse services also saw strong job growth, which puts upward pressure on inflation.
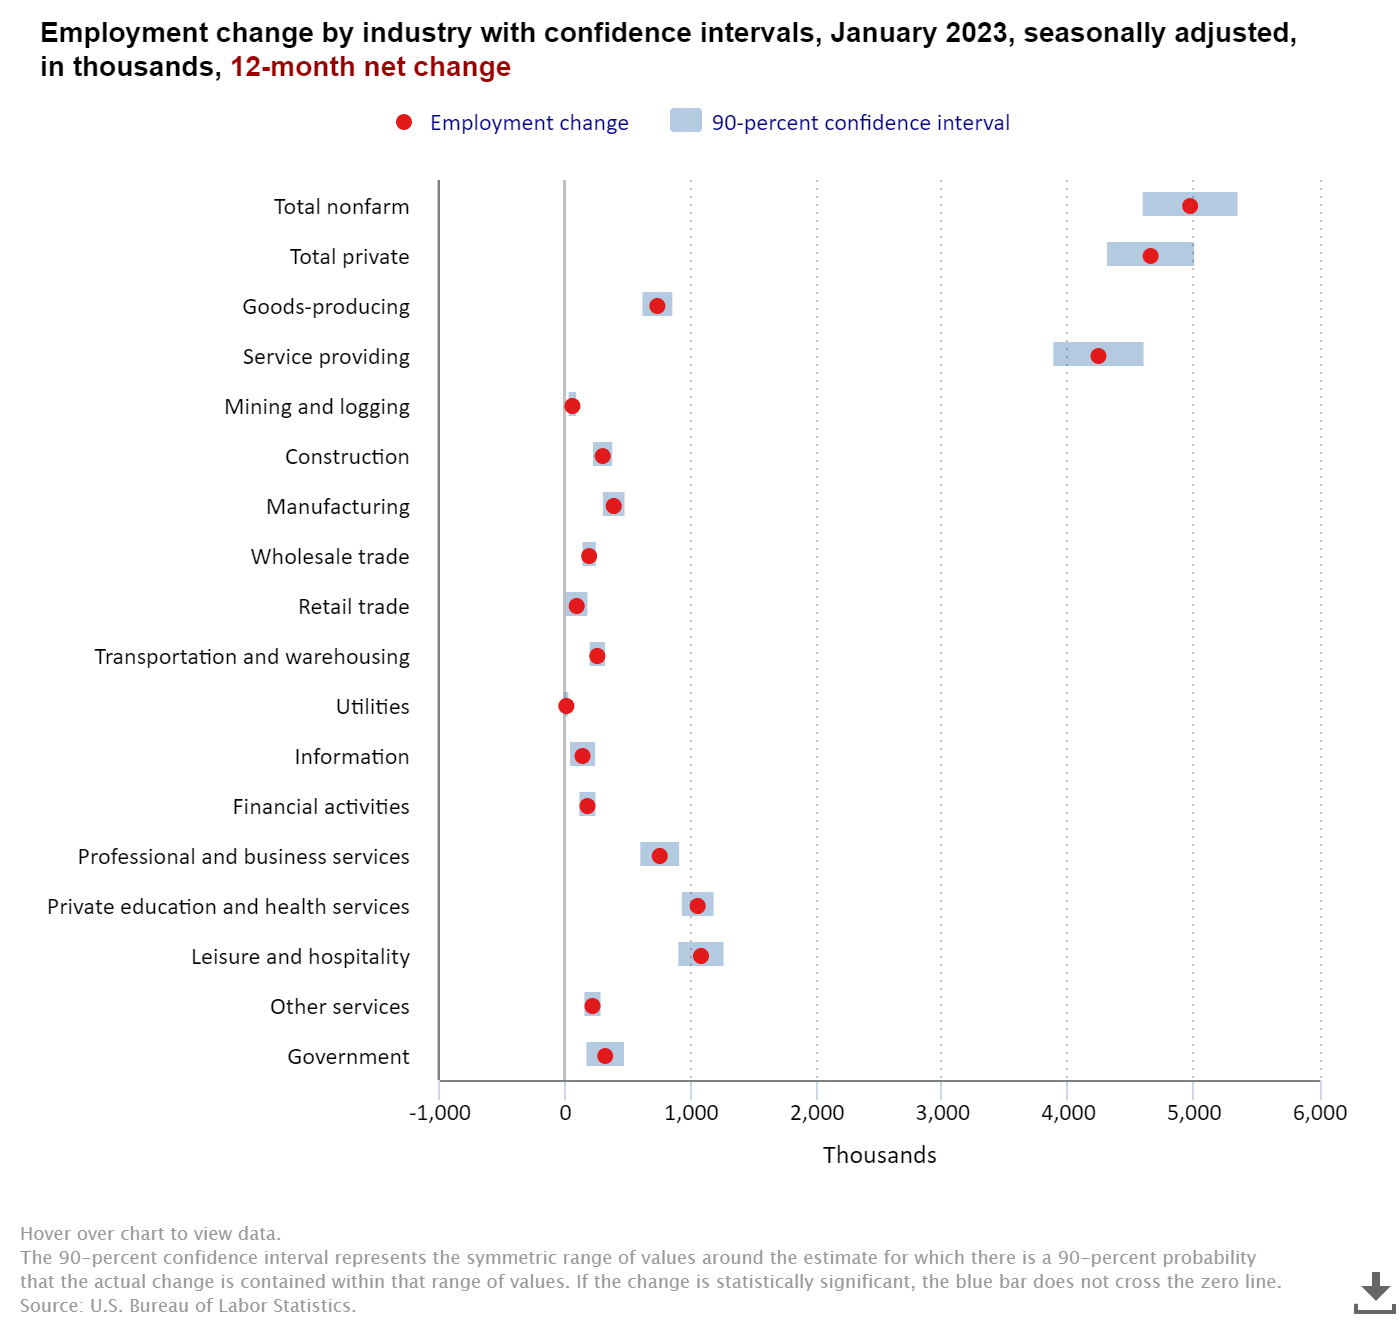
Zooming out to the last 12 months, we can see the bulk of the jobs came in the service providing sector. An interesting portion of this chart is the "confidence band", which reminds us of the RANGE of actual jobs we could see when the final numbers are reconciled 3 years from now. (I'm not bashing the way the government counts jobs, it's just the nature of trying to count jobs in a $20+ Trillion economy with over 100 million workers.)
The final piece of the payrolls report we use in our economic model is the Average Work Week Index. This index surged in January, which is another sign of an overheating labor market.

It's difficult to tell what is going on. Here is a look at our leading indicator dashboard. While all indicators have a strong history of helping us get a read on the overall economic direction, I've resorted it to show the strongest predictors at the top down to the weakest of them.

When you look at the dashboard this way, it is easy to see why we COULD see a "soft landing" (the Fed controls inflation without causing a recession.) Essentially, we have the very strong jobs market and continued strength in consumer spending fighting against an economy that has weakened significantly beneath the surface. Overall, there was the smallest of upticks for our model last month, but we remain "bearish" (declining growth rate).

Bearish to us does not mean an immediate recession, but instead an economic environment that is slowing. This typically leads to a slowdown in corporate earnings, which leads to a drop in stock prices. 2022 started with analysts expecting 12% earnings growth. Instead we ended up seeing a 2% drop in earnings (so far). This was the primary driver of the bad year for the stock market.
Now, analysts are expecting a 13% jump in earnings. Stocks have rallied with that assumption. Maybe they are right, but if they are wrong, we could see another big leg down in stocks.
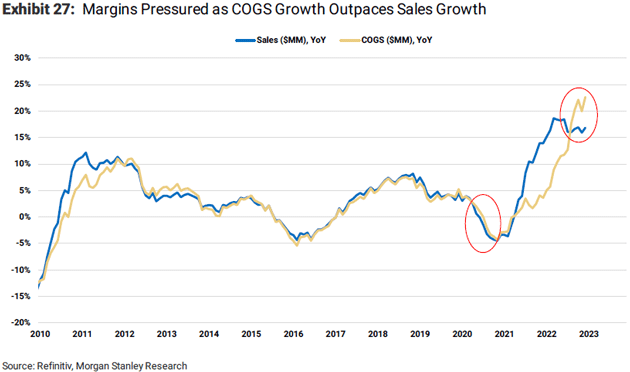
A couple of interesting charts I came across in my weekend reading. The first is from John Mauldin illustrating the margin pressure companies are facing. Revenue growth has flattened (and with retail sales appearing to rollover will begin to drop) while costs of goods sold (COGS) are skyrocketing. This certainly doesn't point to an environment where corporations are going to easily grow earnings by 13%.
The second chart is from Bloomberg. I described the rally in 2021 as "stupid". It made no logical sense seeing stocks which fundamentally shared the characteristics of companies on the verge of bankruptcy posting the highest returns. We learned after the fact this was driven by the "Reddit army" of retail "investors" driving the weakest companies higher. In 2022 most of those stocks lost 60-95% of their value, but in early 2023 they have seen returns from 20-80%. This chart shows the retail trading volume as a percentage of overall volume. It's tough to be a believer in this rally when the market is sending the companies with the weakest fundamentals higher.

Turning to our typical market charts.....
We saw a huge rally on Wednesday as the market took Chair Powell's as "dovish" (less concerned about inflation and more focused on economic growth). Given the Fed's track record, especially this Fed Chair and their inability to see turns in the economy I would be careful trusting any of their forecasts. The "too hot" jobs numbers led to a big drop on Friday, but for now the micro uptrend remains intact.

I continue to show this chart to anybody who argues the market is undervalued simply because it is 14% from its high. The market started 2022 at a P/E of 21. It is now 20. The median P/E this century is 18. A recessionary bear market typically brings P/E levels down to 12-15. The only justification for a P/E of 20 or higher is if we are expecting above average growth rates. If you truly believe earnings are going to grow at a 13% rate this year, stocks are fairly valued. If you believe the economic environment will make even 5% growth unachievable then stocks are way overvalued.

Following a brief drop in yields following the Fed meeting, the bond market has shifted their focus back to worrying about inflation running too high for too long. 10-year rates are back to 3.6% again this morning. This is another problem for those blindly buying stocks expecting the Fed to help boost earnings by 13%.

Finally, we've been talking about our 'broken economy' since the pandemic. Understanding what is happening is key to succeeding in the coming years. We posted a series of seven 30 second videos to our social media channels over the last two weeks breaking this down into simple terms. You can watch the replay of all 7 here:
Upcoming SEM Webinar

Are you tired of being bombarded by investment managers in the media offering their opinions on what the next year will look like? This isn't going to be one of those webinars! In this short webinar, I'll share some brief highlights about what really happened in 2022 as well as a few different paths the market may take in 2023.
When you sign-up for the webinar you have a chance to leave any questions you'd like me to answer at the end of the webinar. You'll also have a chance to ask questions during the live webinar as well. If you can't make the live webinar, still sign-up so you can ask your questions and be notified when the replay is available.


