When helping clients, advisors, and students understand the market I often say, "the market is a forward looking mechanism". Essentially today's prices are the present value of all future income streams. This requires a lot of projections (guessing) about what will come in the future. Interest rate levels and inflation estimates also enter the equation, which requires more projections (guessing).
When it gets down to it, the trajectory of the market is based on how everyone FEELS about the future. This leads to wide swings in expectations as our emotions will tend to get the best of us based on what is happening. I show this slide often as it contains what is my favorite quote to explain the market.
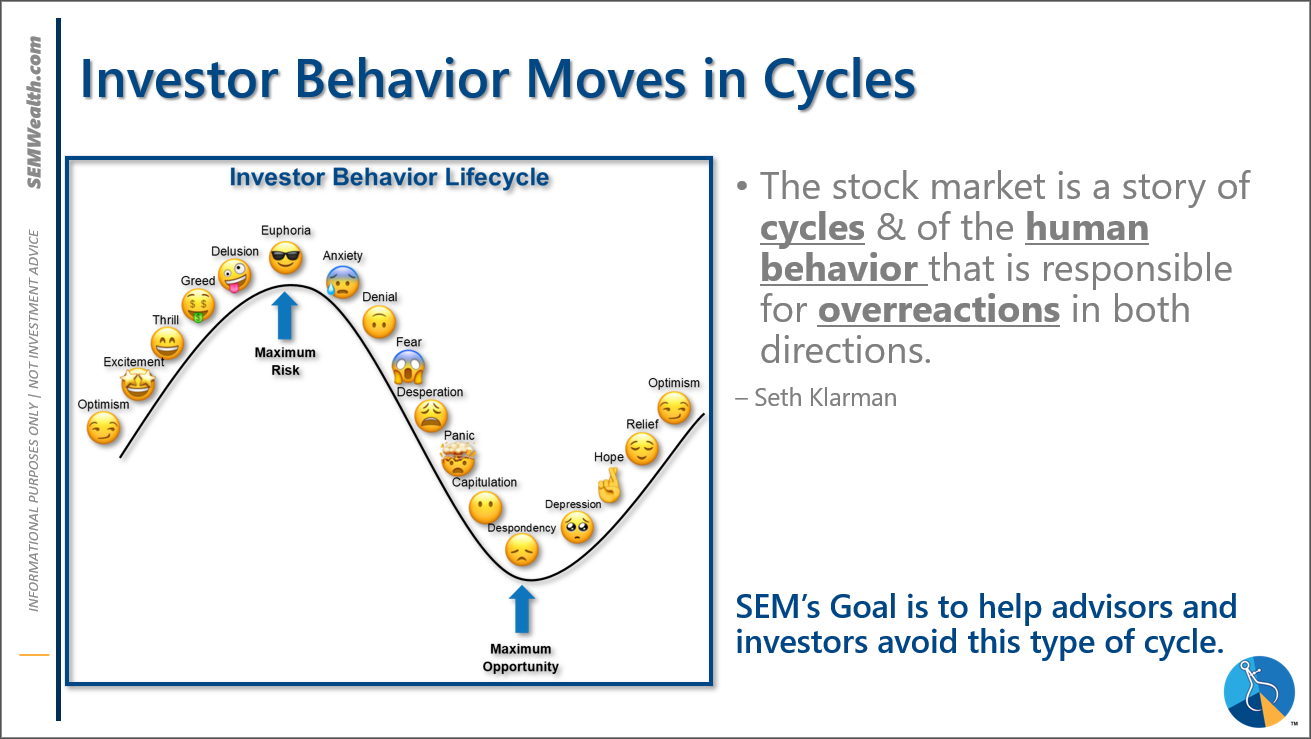
Over the long-term so long as the economy is growing, stocks should go up. The problem is mathematically they can only go up at the rate of economic growth + dividend yields + inflation. This puts us right around an average 8-10% growth rate. The human behavior cycle above leads to times where the market is overly optimistic before the 'disappointment' leads to the market becoming overly pessimistic.
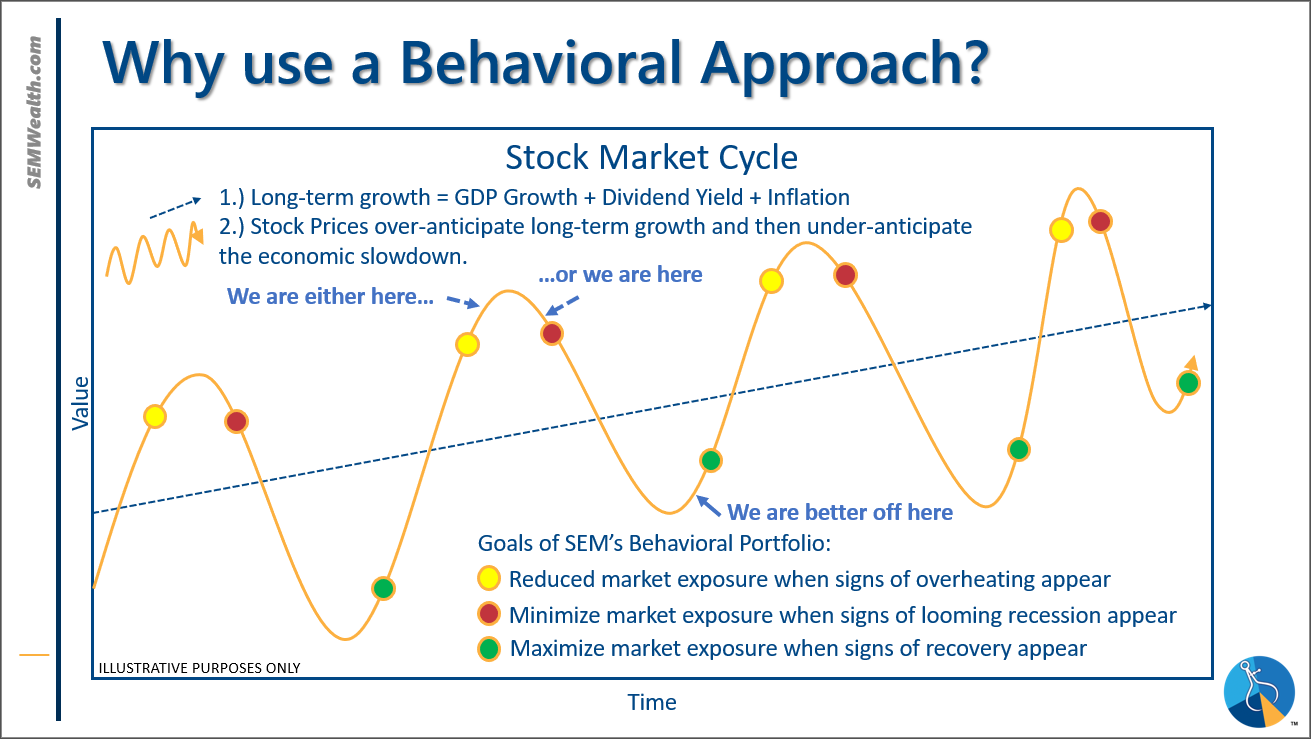
This means the 'edge' is not being the best at forecasting (guessing) the future, but instead measuring the swings in investor behavior. Part of that is understanding what the 'base case' is for the market outlook. If the future ends up better than the base case you'll see a strong rally. If it isn't, you'll have a sell-off. Somebody asked me this week what is causing the sell-off in stocks.
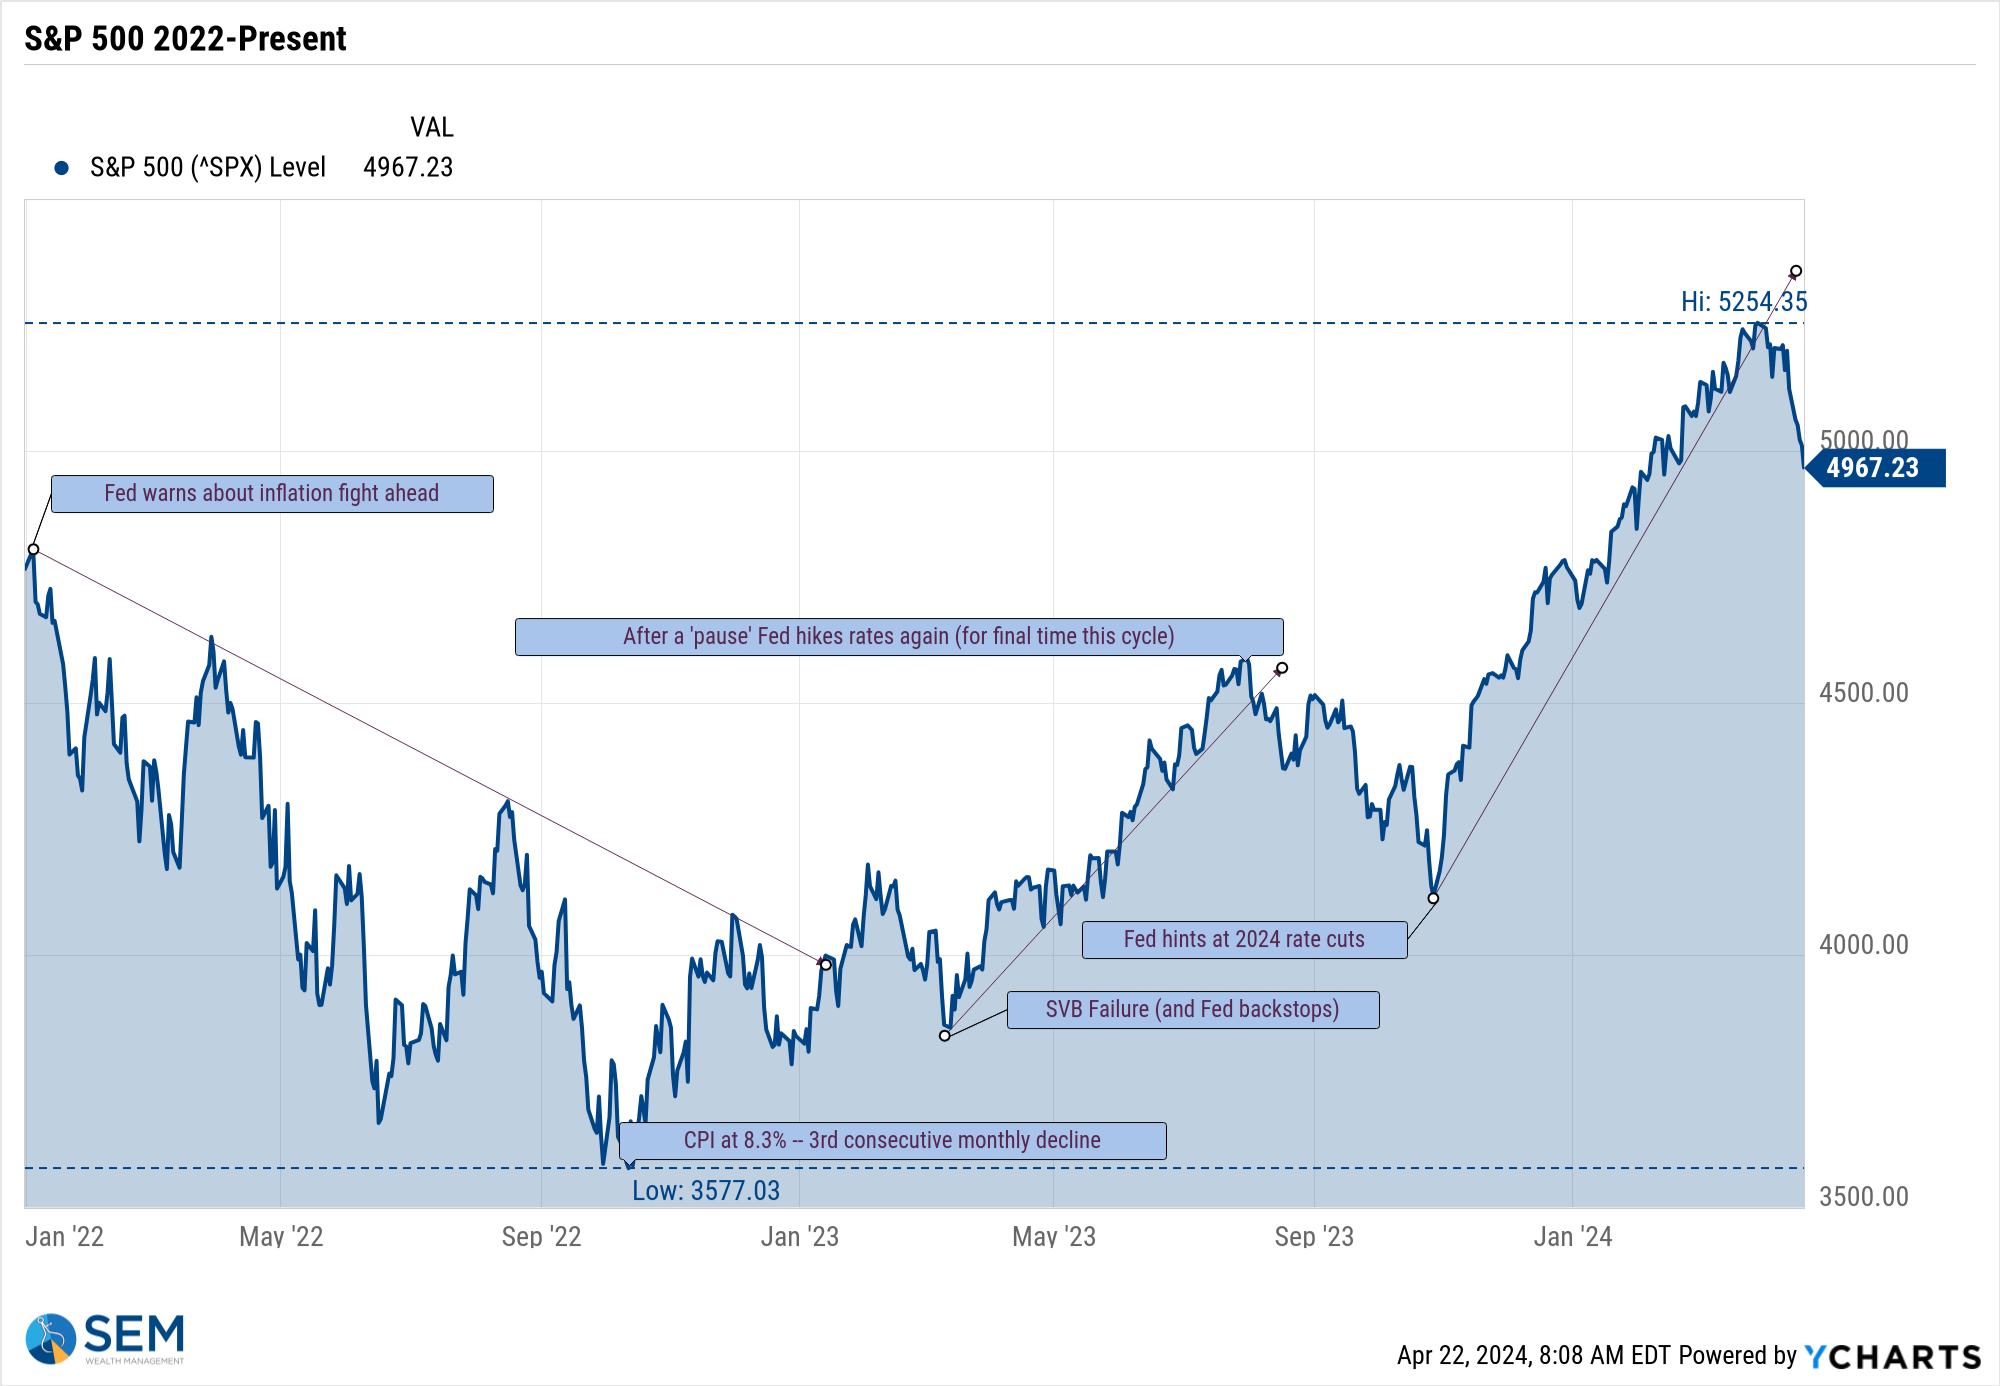
My answer...........first off, we need to understand this is a very minor sell-off. A 5-7% drop in stocks typically happens 3-5 times a year. We're just past the 5% level. A 10% drop occurs on average once a year. We saw that last happen in August - October 2023. That correction ended as the Fed hinted they would be looking to cut rates in 2024. This sparked a furious rally to end the year which continued throughout the first quarter of 2024.
When we started the year I created this list of what could cause the rally to continue and what would spark a sell-off. Essentially it is a list of whether or not the baked in expectations in January remain in place. Here is the current list. A lot of the checkmarks in the left column have turned into question marks. About the only thing we know right now is the economy remains strong (click here for our latest economic update.)
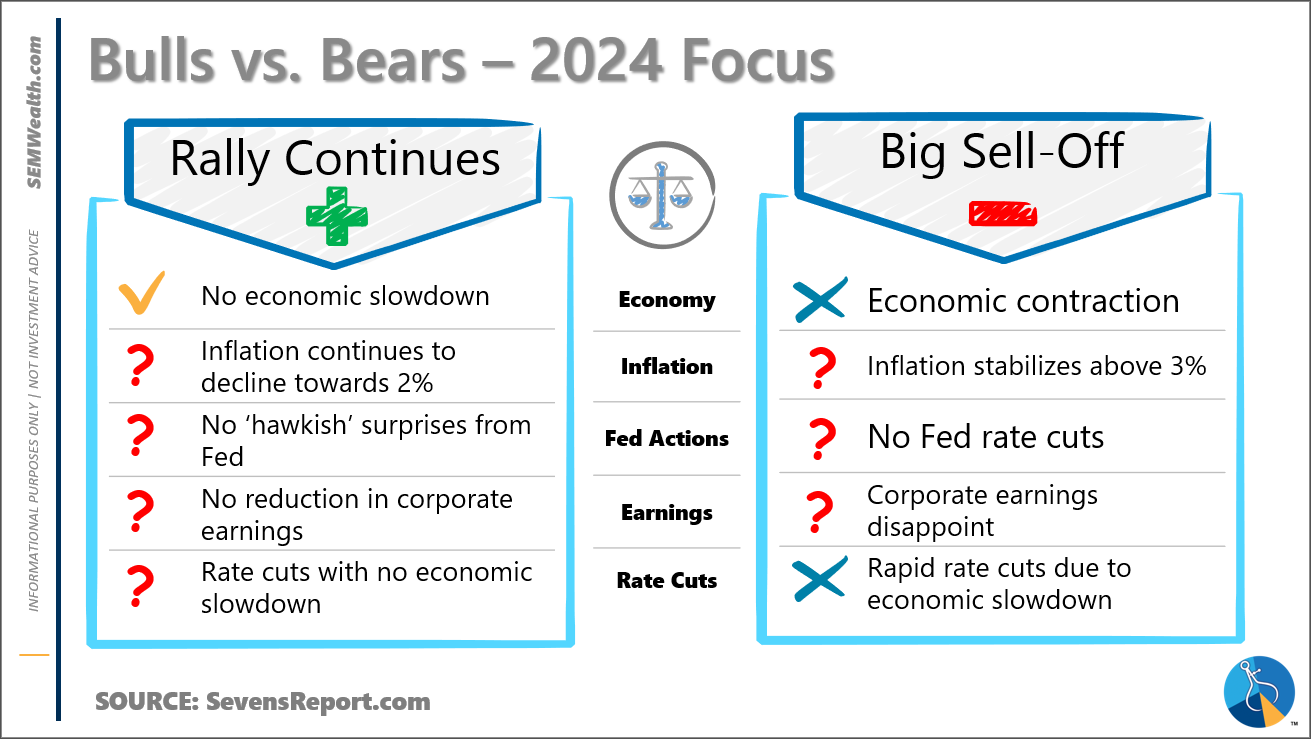
For the sell-off to stop we need to have inflation ease, the Fed to confirm they still are going to cut rates in June, and/or corporate earnings outlooks to improve. We also could see the market somewhat stabilize while we wait for those things to change and let time alleviate the extreme overbought conditions we saw just three weeks ago. With the economy strong there is not enough of a catalyst to cause much more than a NORMAL market correction.
This doesn't mean the coast is clear. The 'Market Charts' and 'SEM Market Positioning' sections below discuss this a bit more, including a change in our Tactical positioning.
Market Charts
The problem with steep uptrends is a small adjustment to expectations can cause them to end. There is not a lot of 'support' (where there was a high volume of demand at a certain price) to look for something to reverse the sell-off. Most people knew the market was overextended but bought anyway. This can lead to a rush of profit taking to not give up the gains that probably shouldn't have happened anyway.
The only real 'support' is the peak from the post-SVB 'bailout' rally that ended last August. That's still 7% below Friday's closing level. We do not necessarily have to get down there to see the sell-off ending. If like the last correction we see the Fed again become more forceful in their discussion of rate cuts the market could easily reverse again.
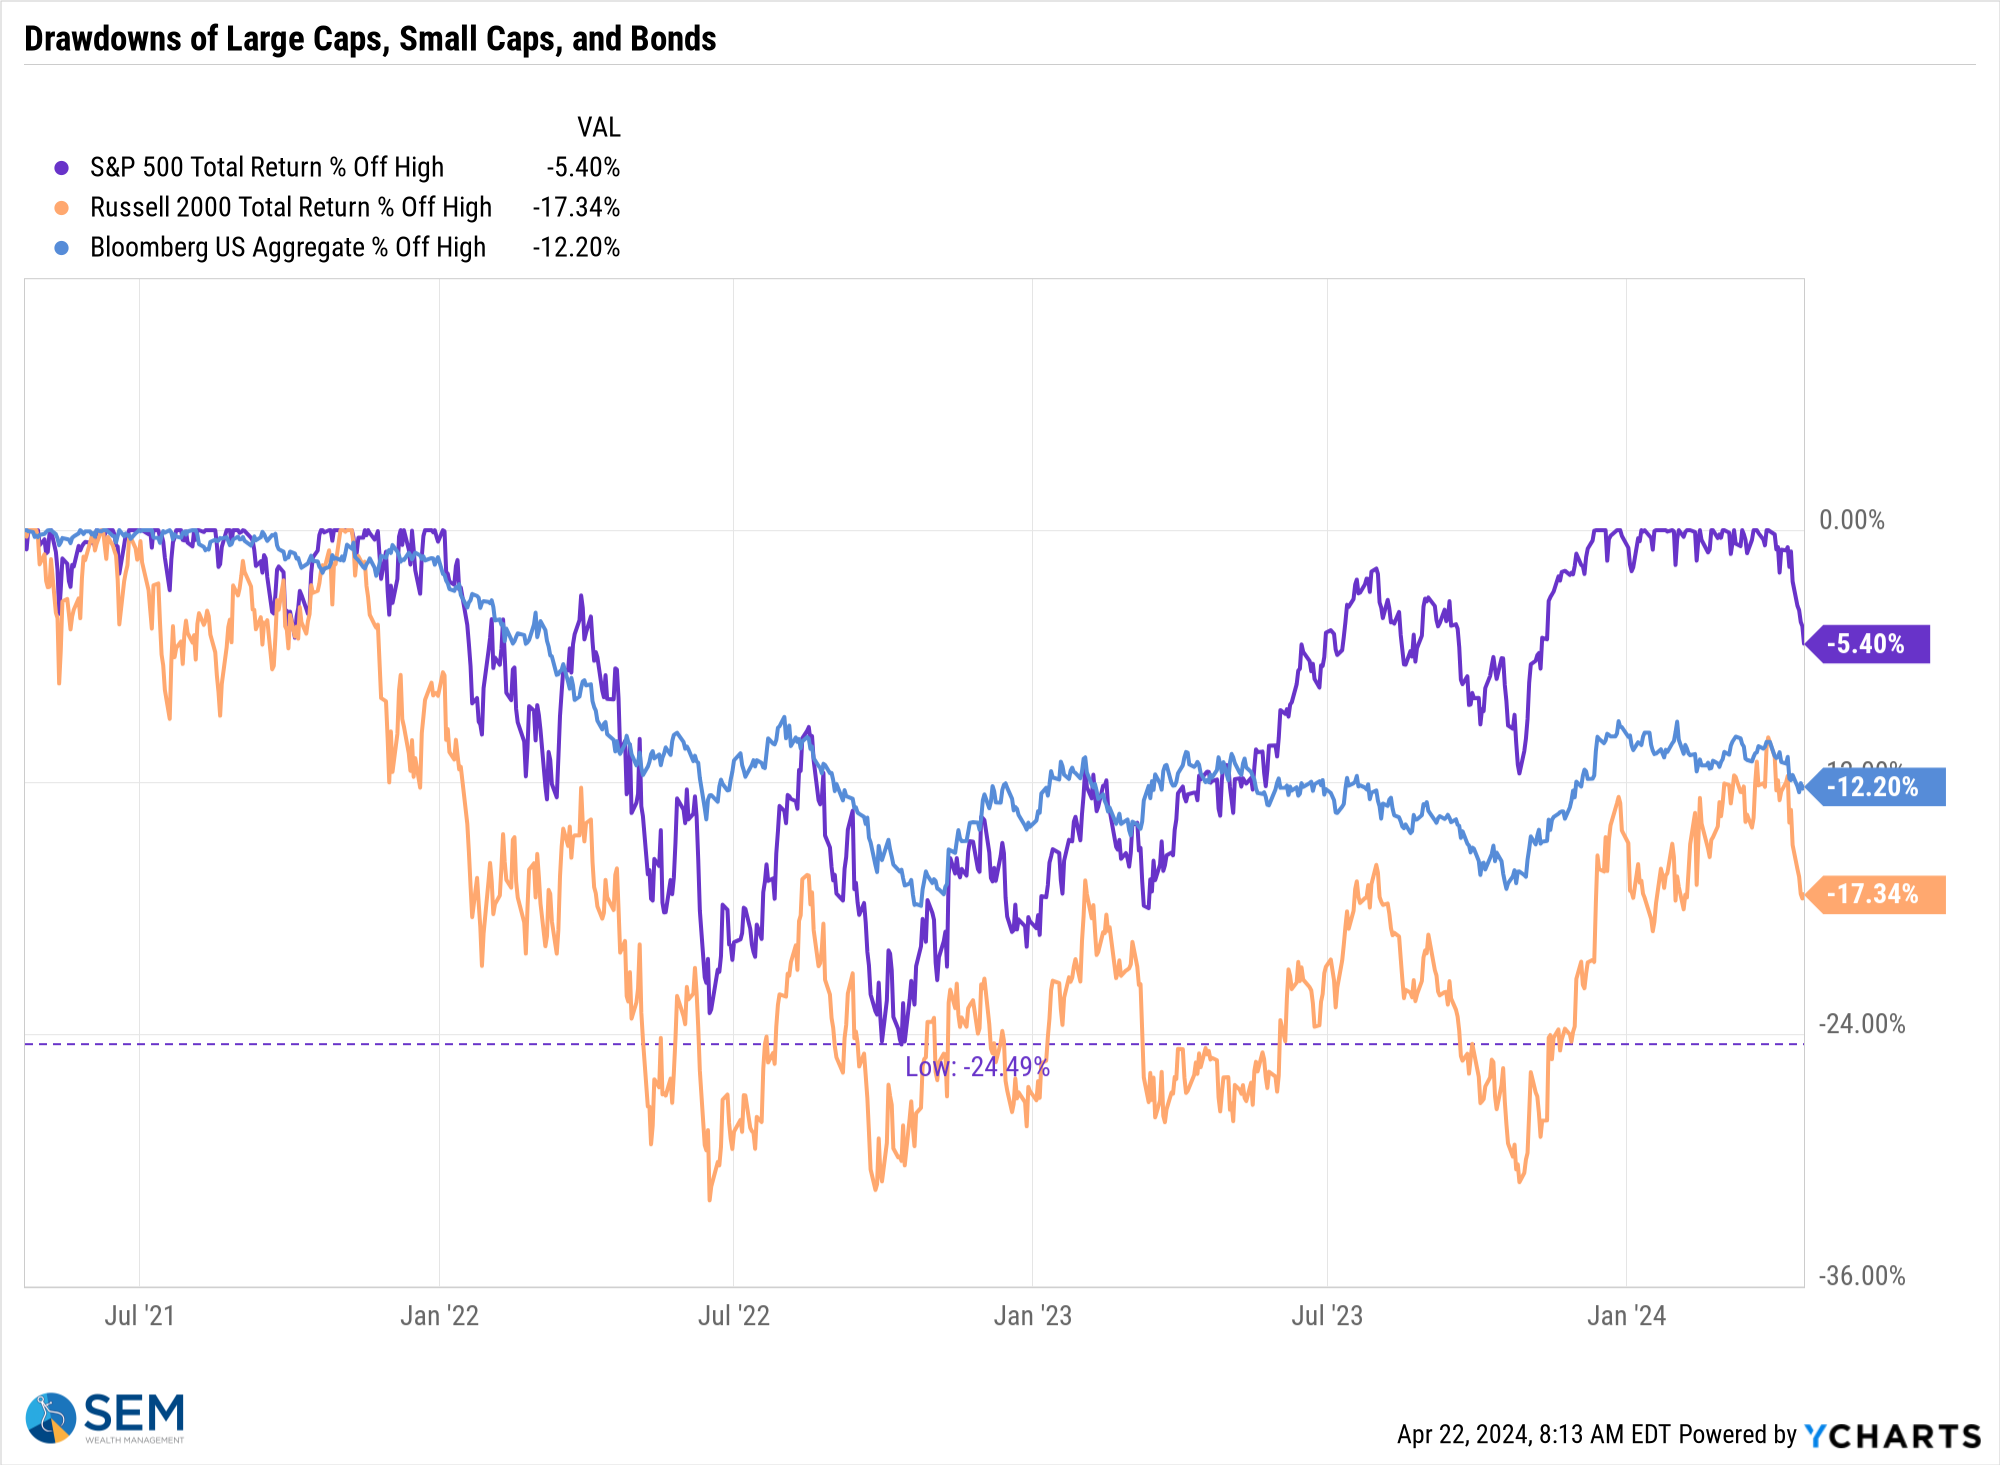
The drawdown chart is helpful in looking at how far we are off the highs. While small caps and bonds never recovered their 2022 losses, the S&P is now in the 'normal' 5-7% category referenced above.
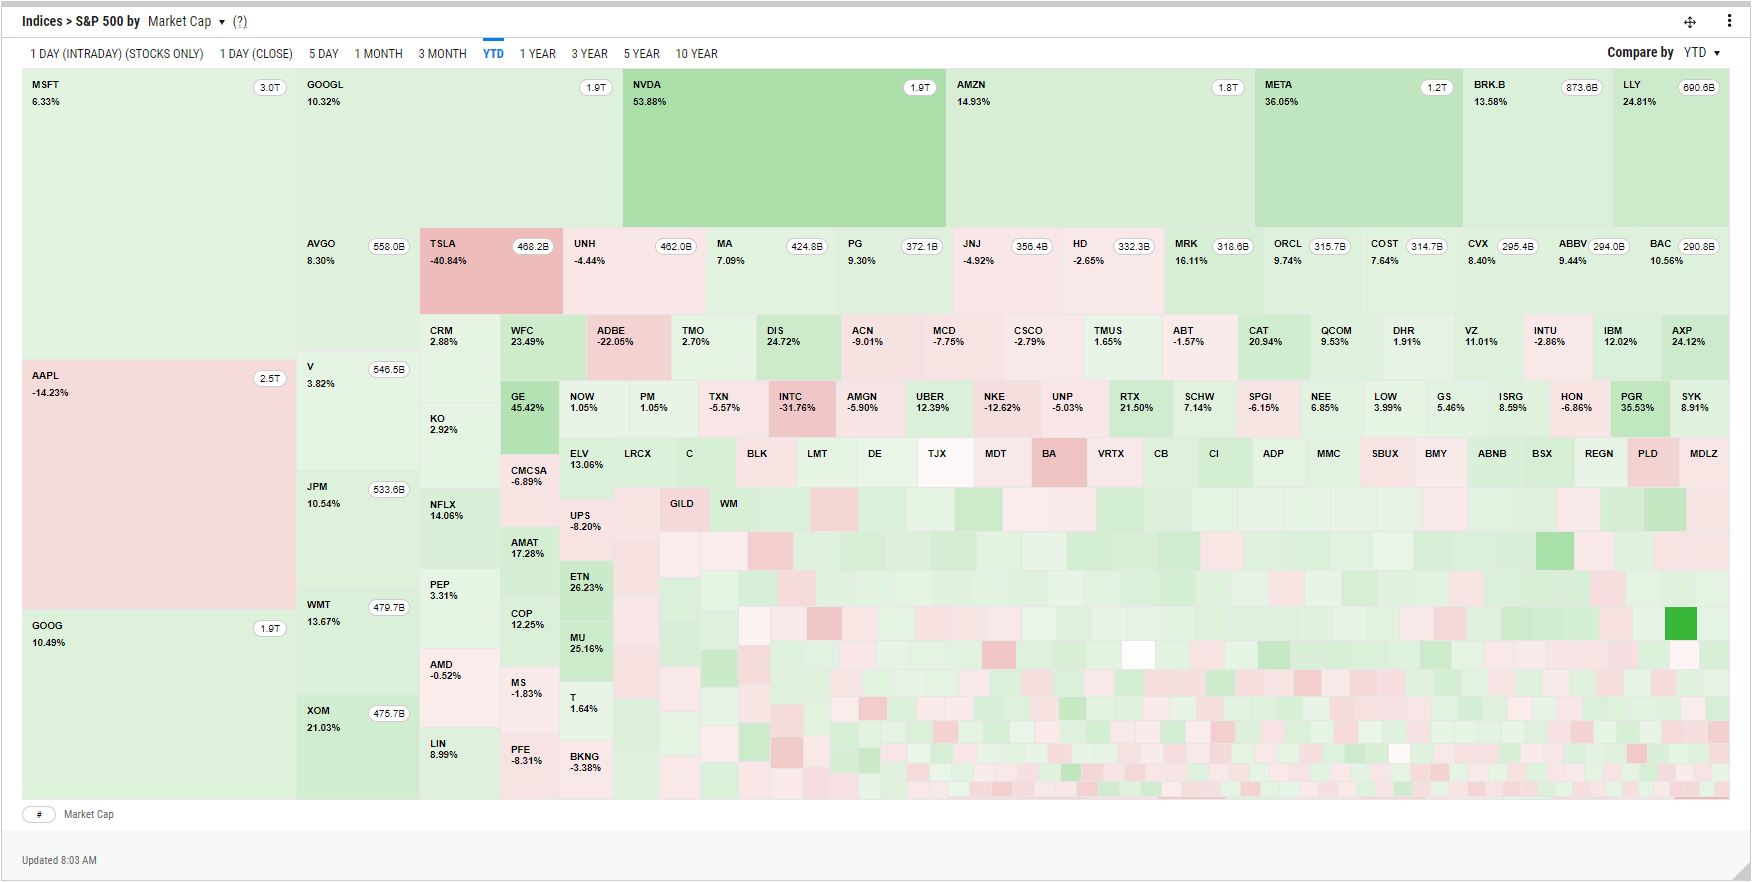
The S&P is holding onto positive 2024 returns. Other than Apple, Tesla, United Health Care, and Home Depot, the top 30 stocks are still mostly higher. This heat map of the S&P 500 illustrates how the smallest of the components are all now mostly negative on the year. (The size of the box represents the weight of each stock in the index.)
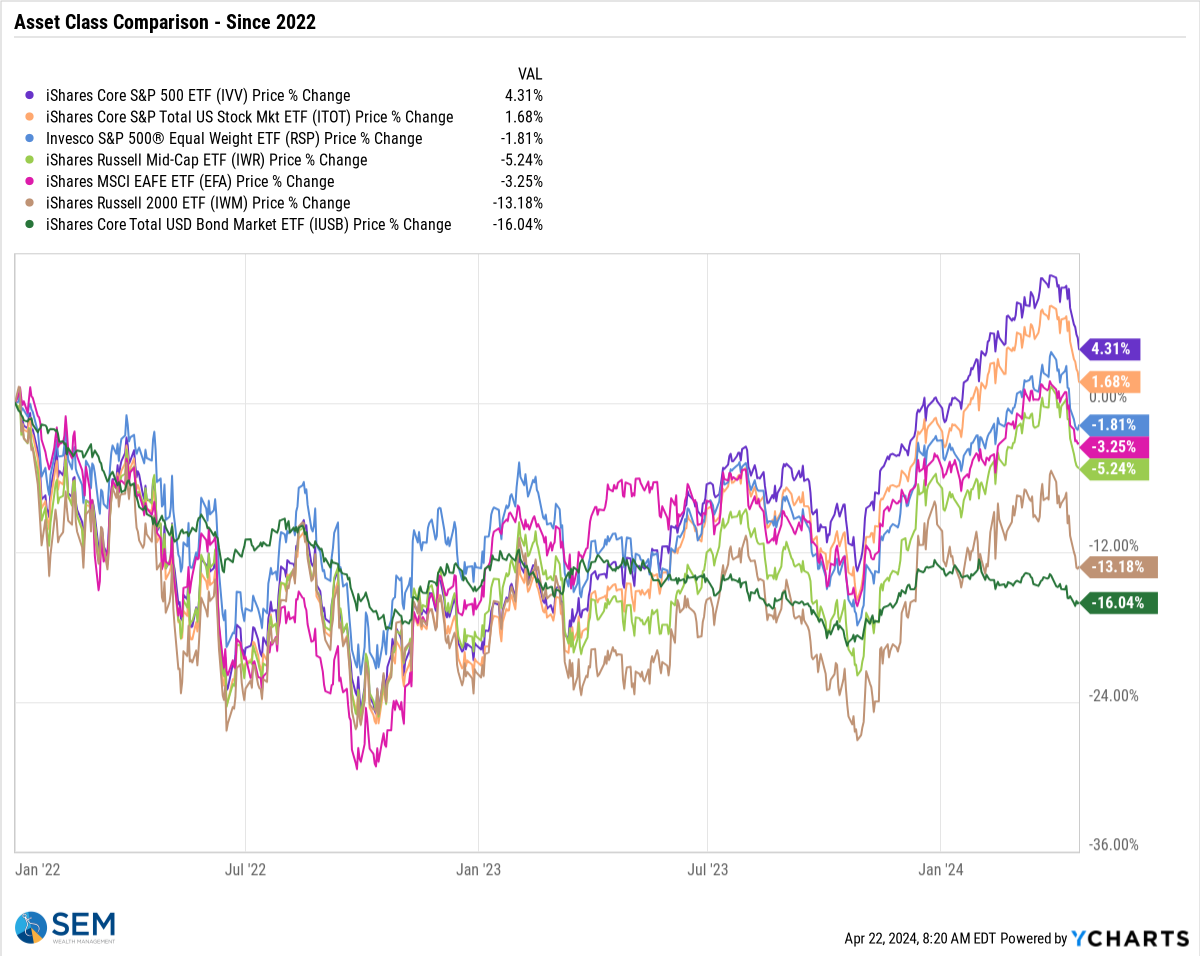
This has brought the 'equal weight' S&P back below the 2021 peak. Interestingly enough, the worst performing asset class over this time is bonds, which are down 16% from their 2021 peak.
Speaking of bonds, the trend of the 10-year Treasury yield is again troublesome. We may get a short-term break, but the trend is up until something changes it (such as the Fed being more forceful in their language about interest rate cuts).
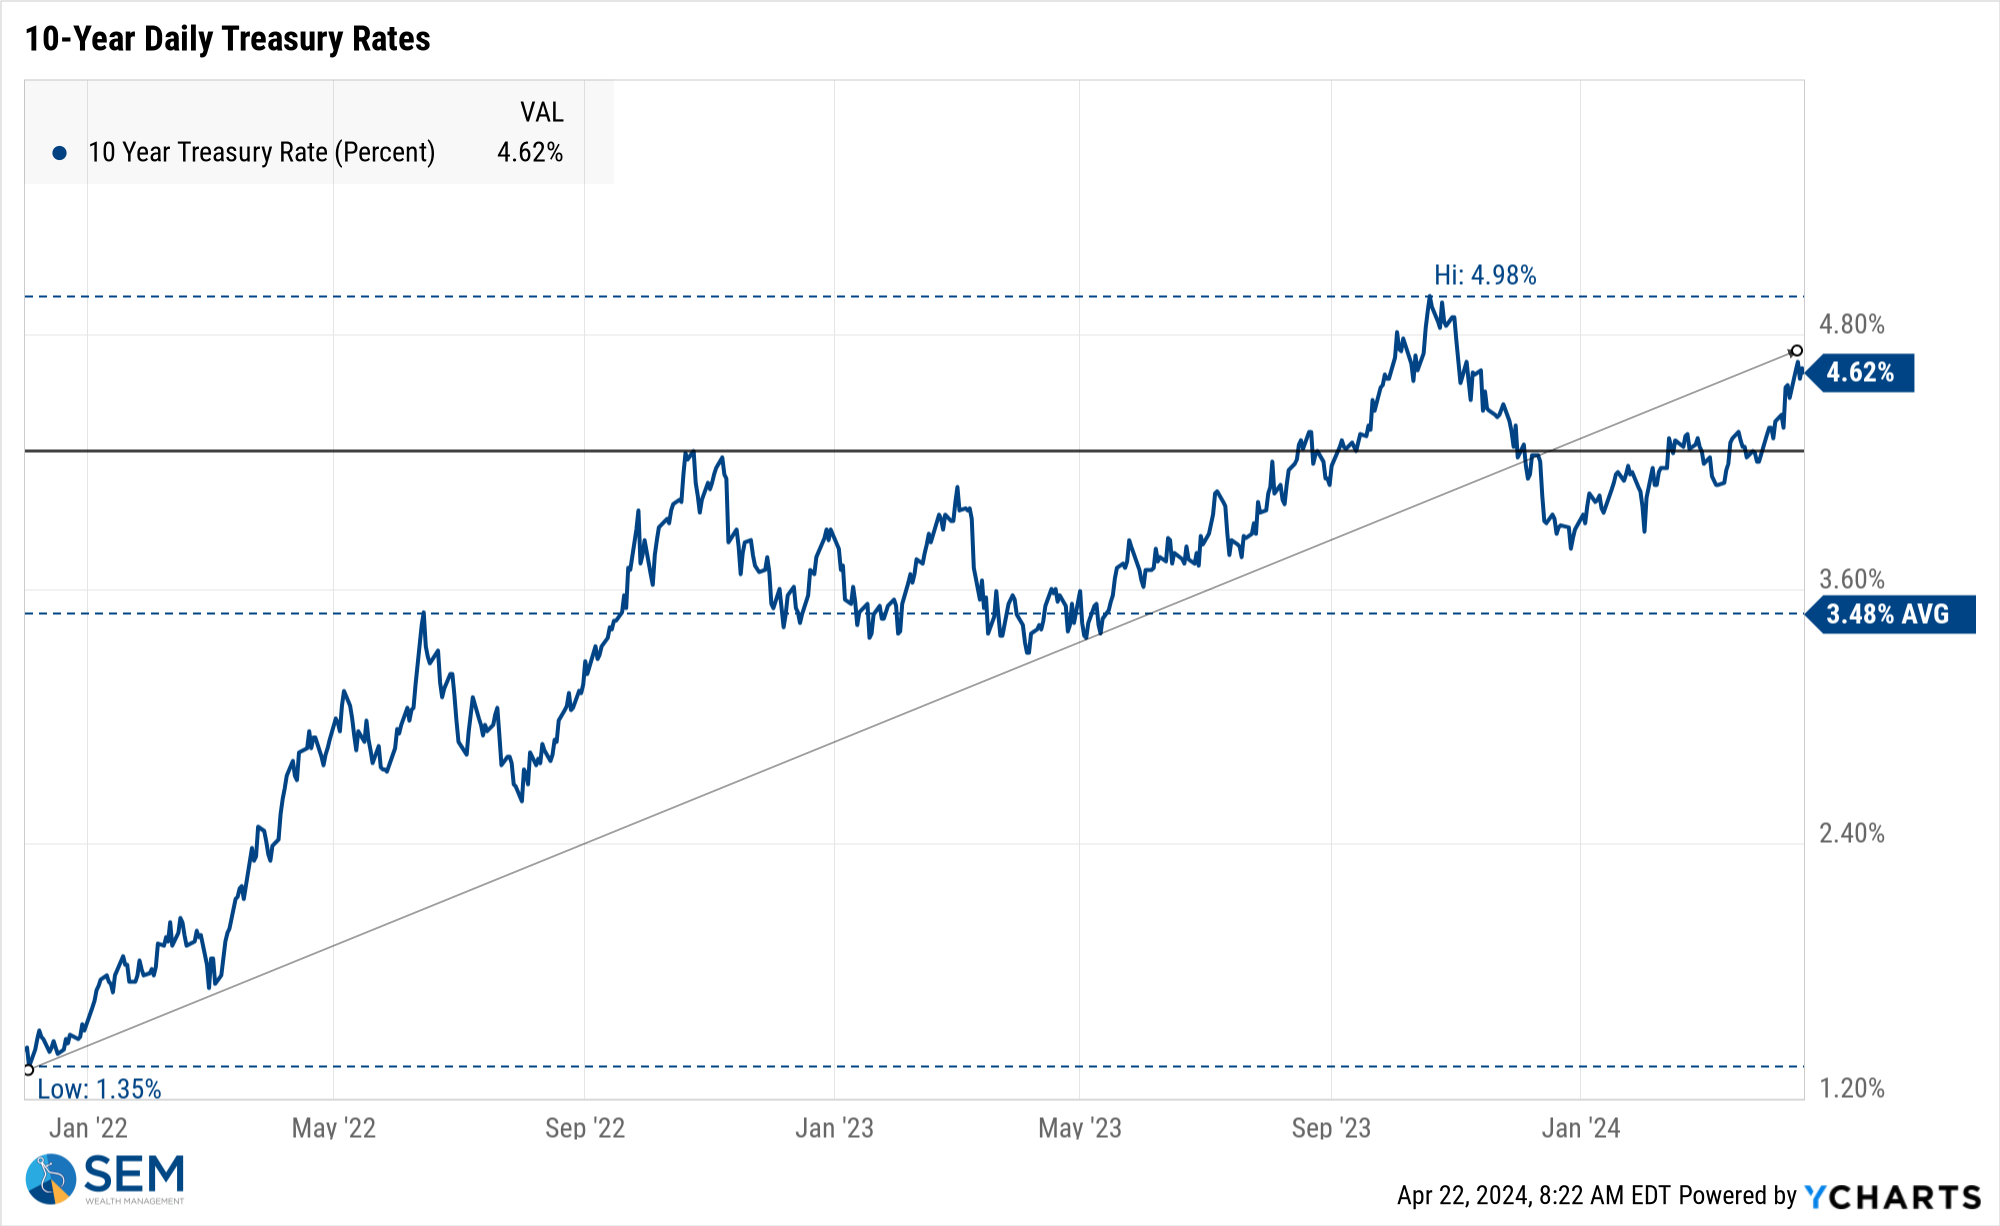
All rates other than the 3-Month Treasury Bill (which tracks the Fed Funds Rate closely) are up significantly since the start of the year. As I've said often, the bond market is much more concerned about inflation than the Fed and has taken matters into their own hands by hiking rates to help control it.

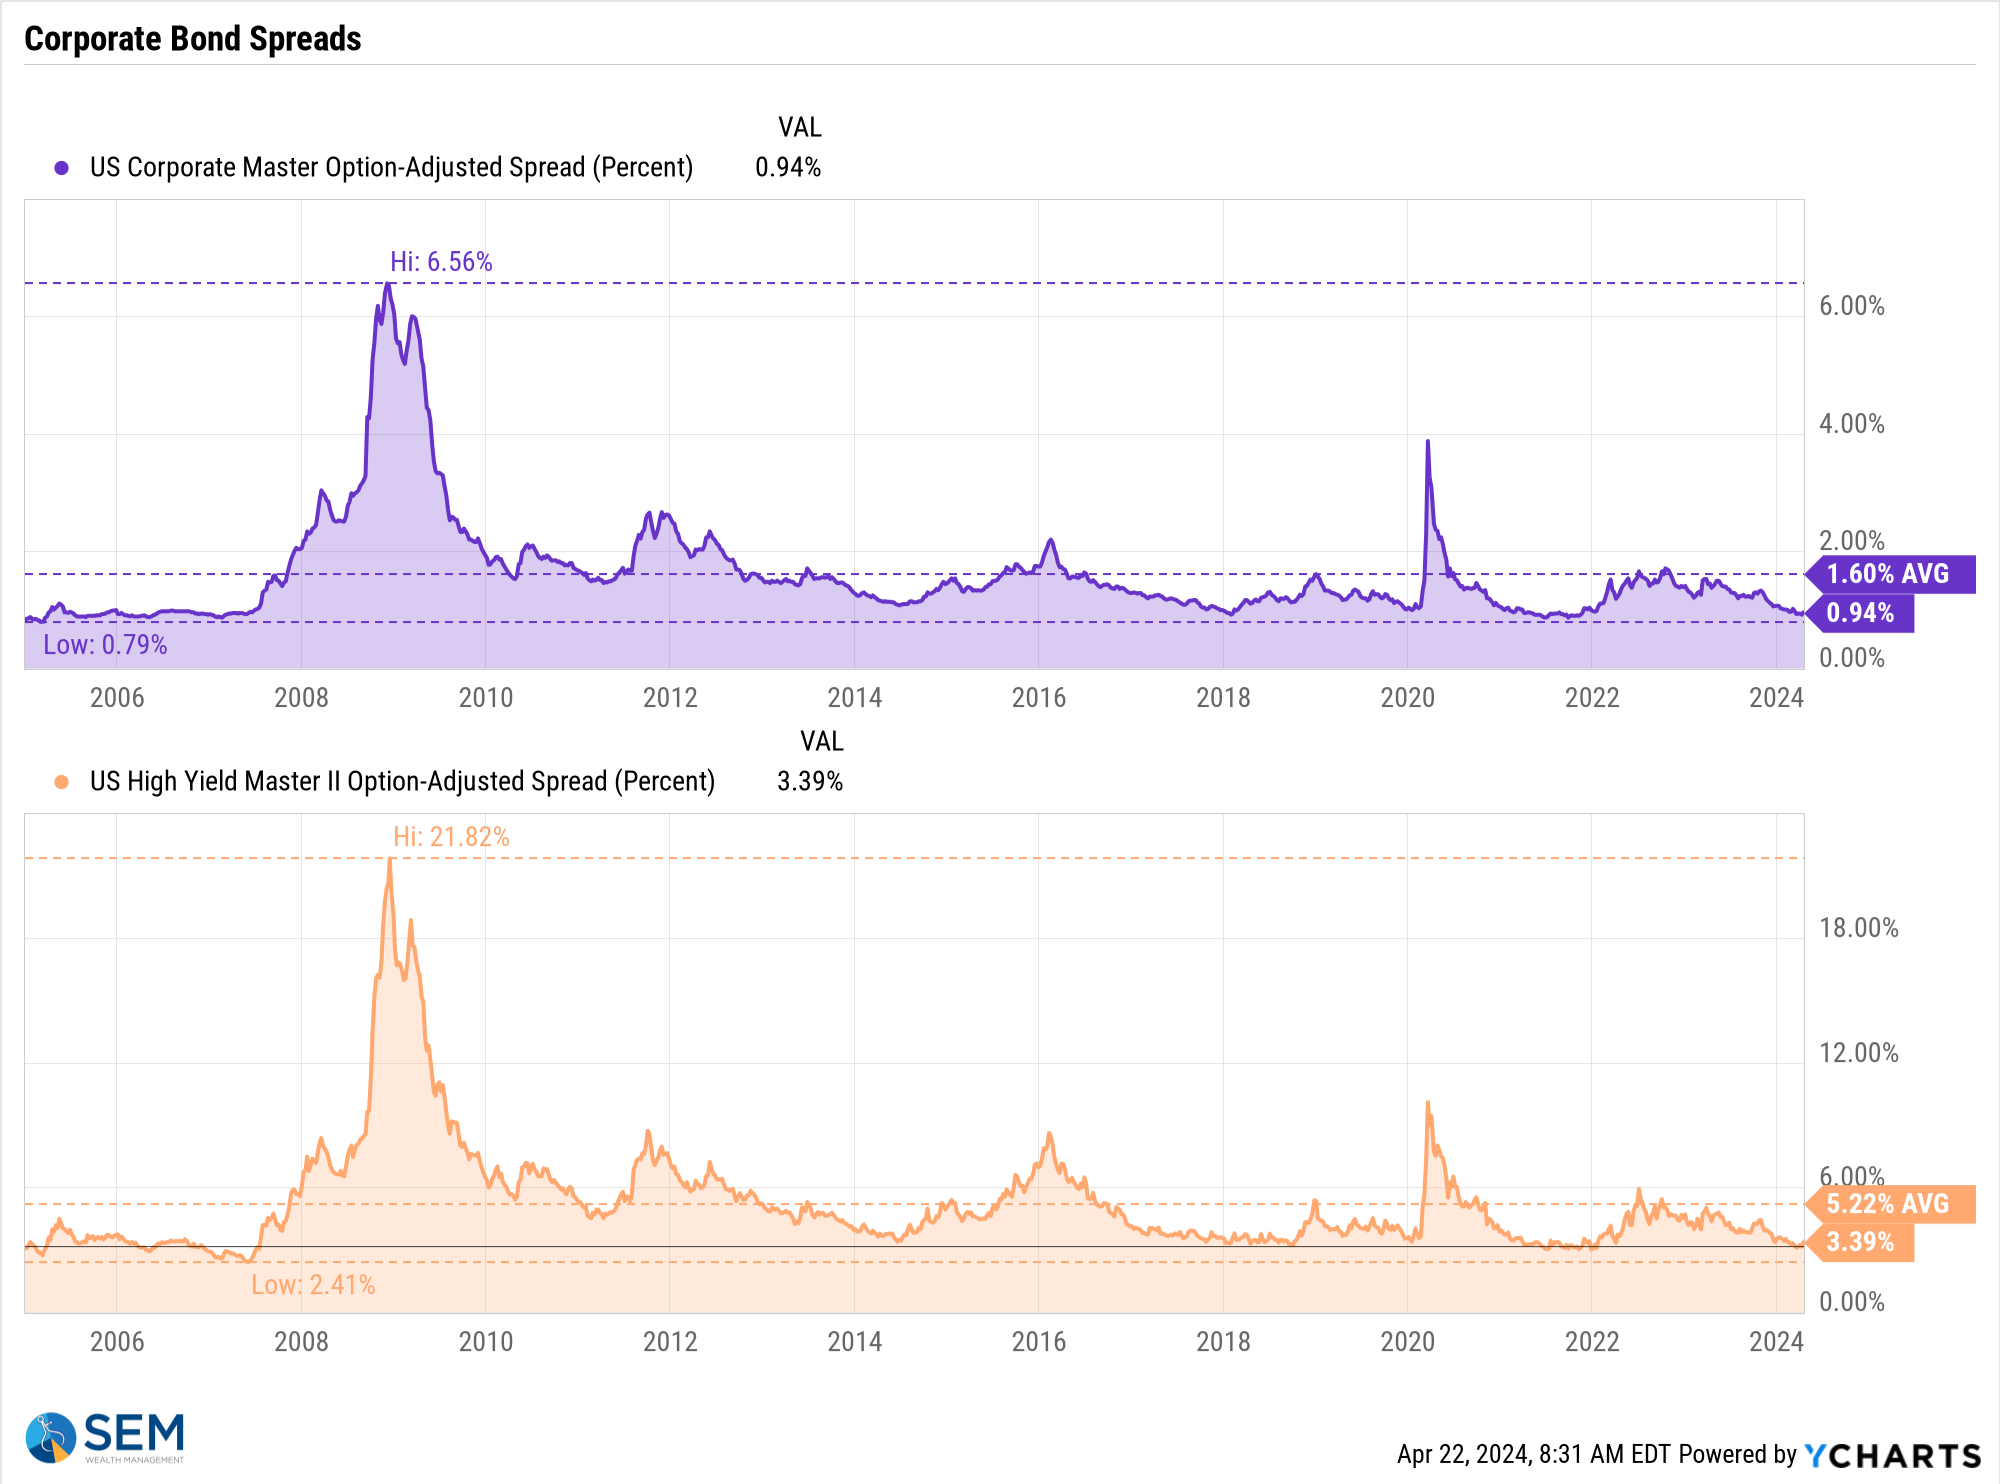
Looking at corporate bond spreads, there is still little concern about credit risk (which means the reason bonds are selling off is concern over inflation not a recession, which overall is a good sign.)
Speaking of the economy, my favorite leading indicator of our leading indicators, initial jobless claims, remains positive. I do suspect something could be off with the data as the reading from last week was exactly the same as the week before, which is the same as it was 3, 4, and 5 weeks ago. That should not be happening with an economy as large as ours. Notice the fluctuations every week the past year until it 'stabilized' in February. (thanks to Jim Bianco on LinkedIn for first highlighting this strange coincidence.)
I'm not a conspiracy theorist, but this should be investigated/audited by an independent agency.
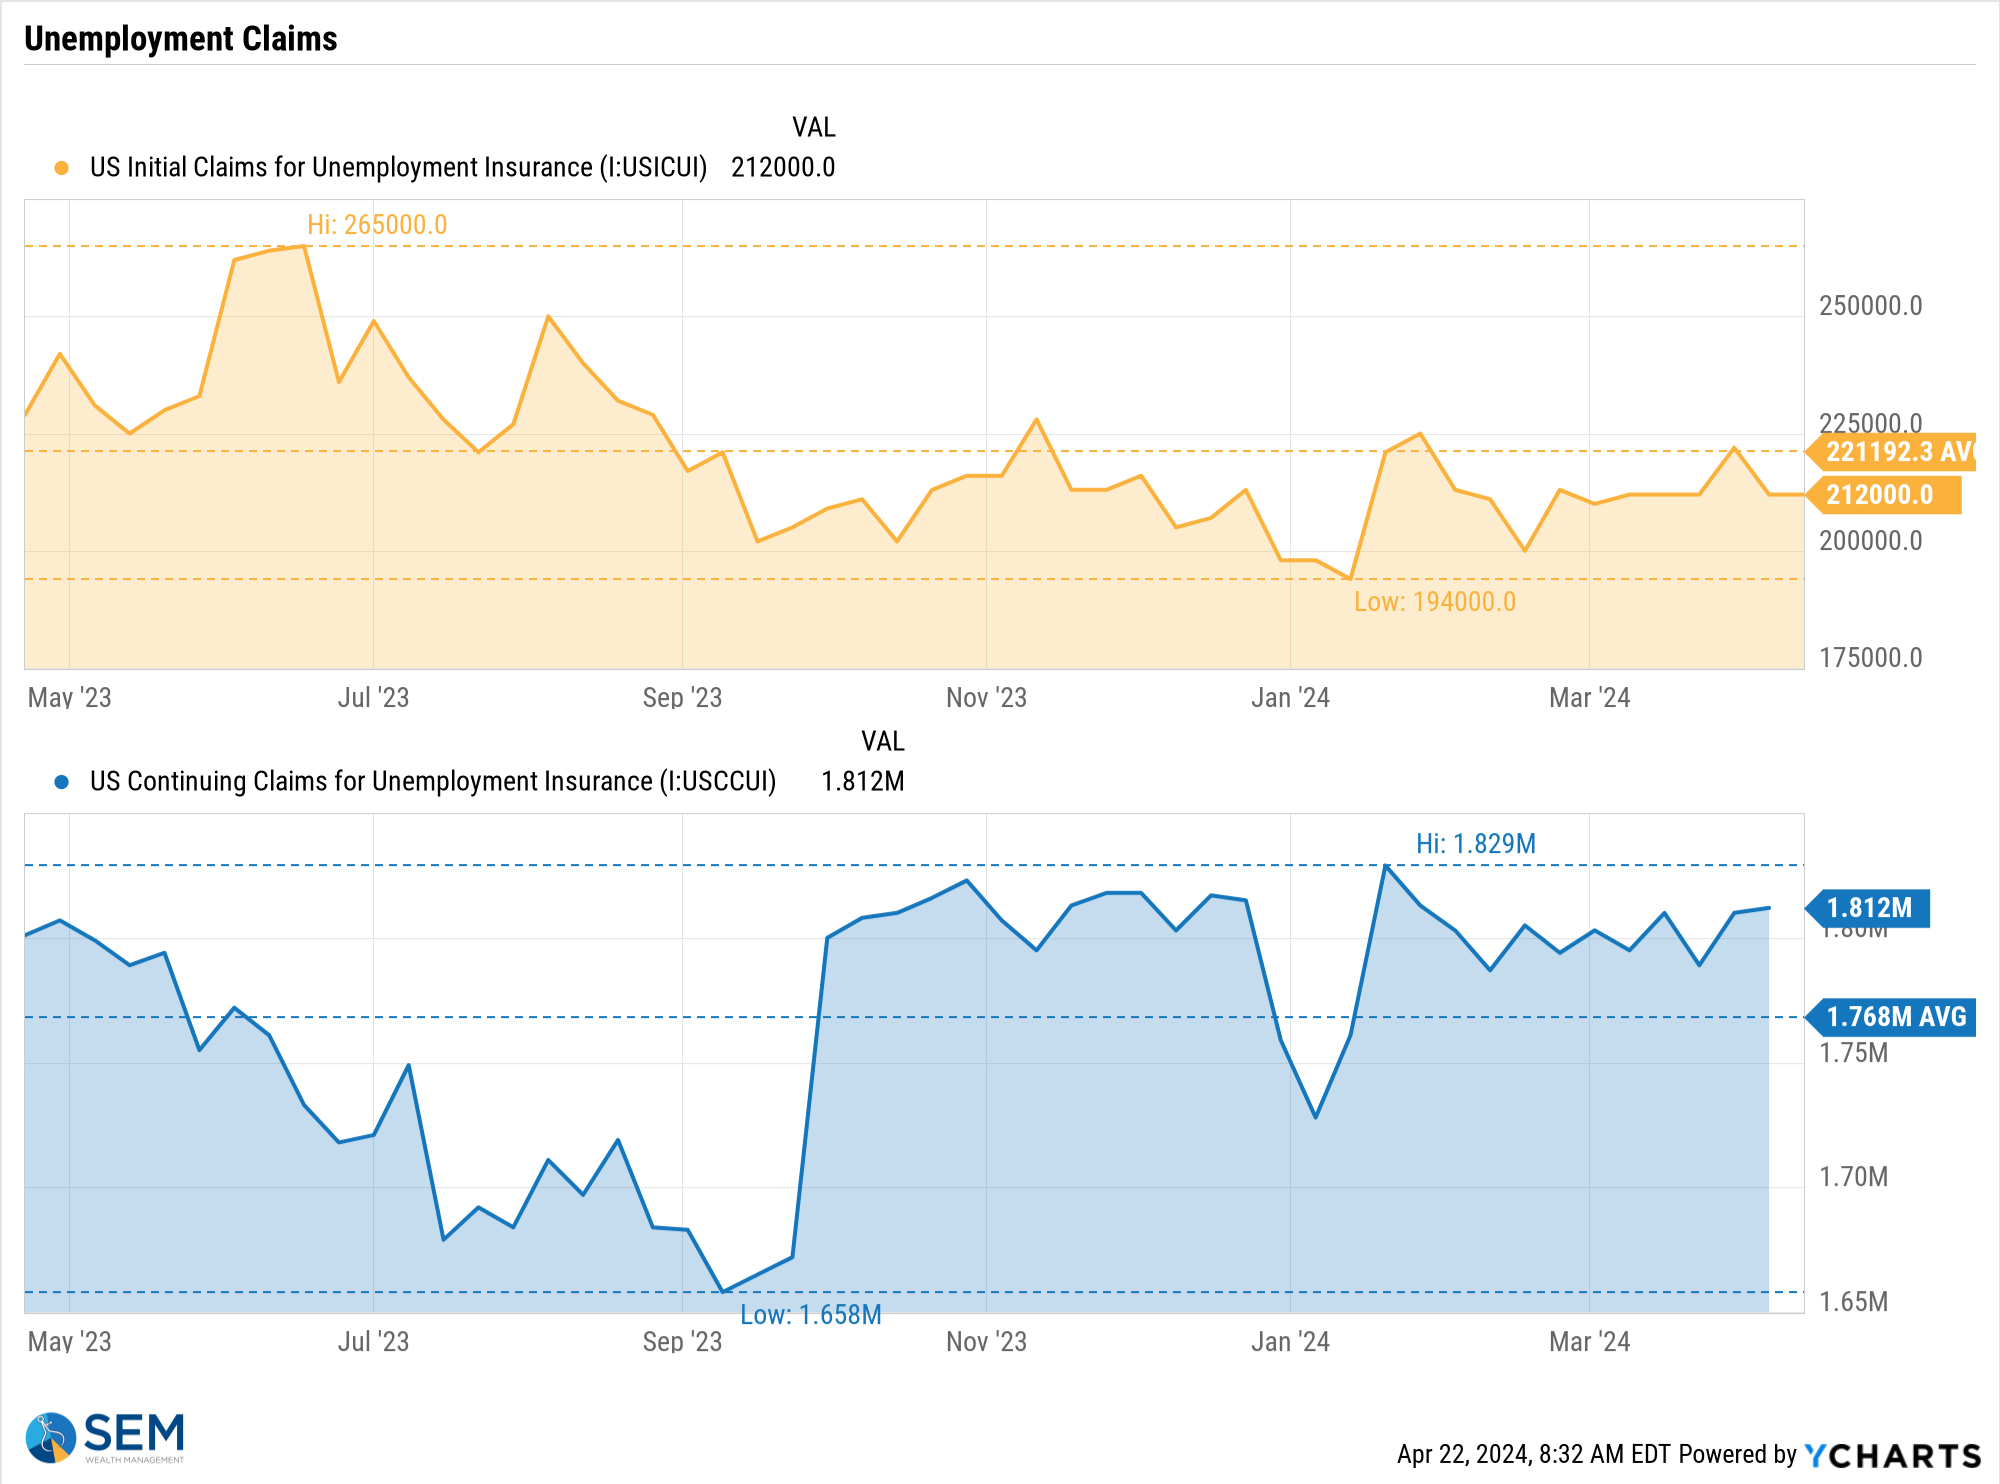
Regardless, the non-government economic data remains positive enough to not be concerned about a recession, which leaves this correction in the 'normal' category.
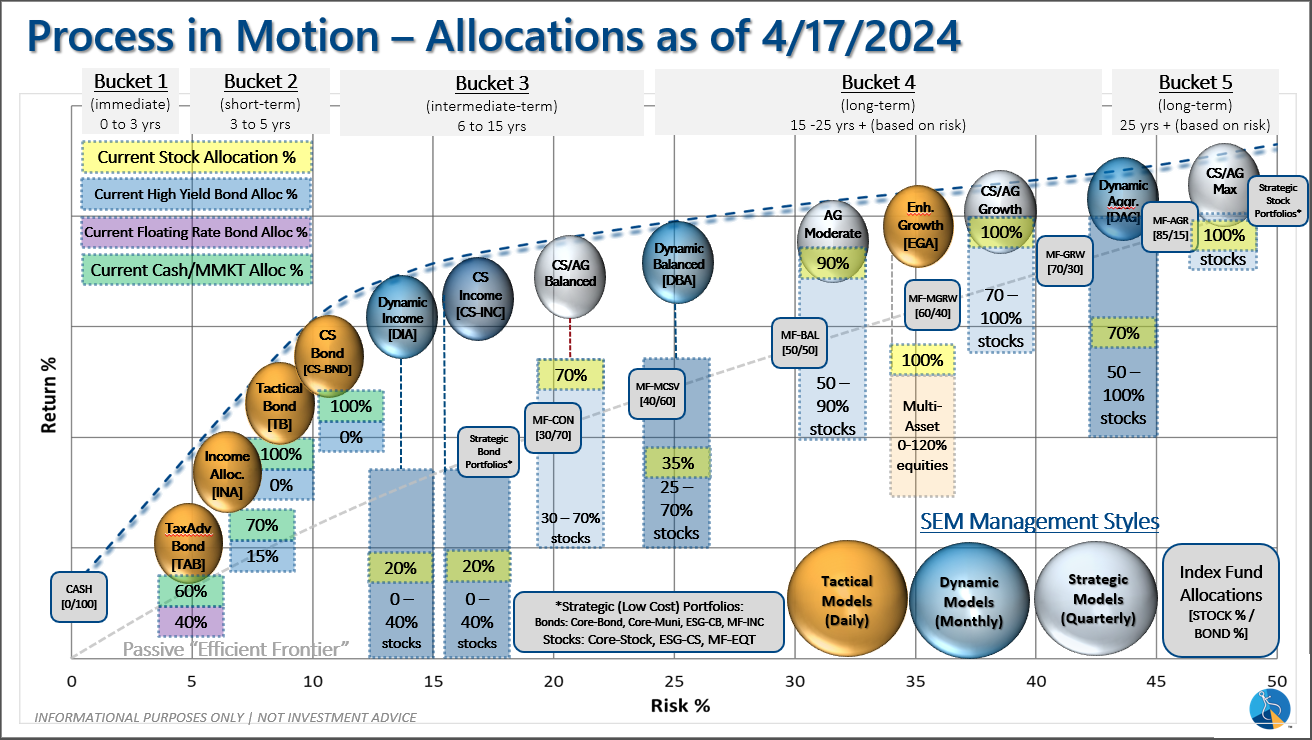
SEM Model Positioning
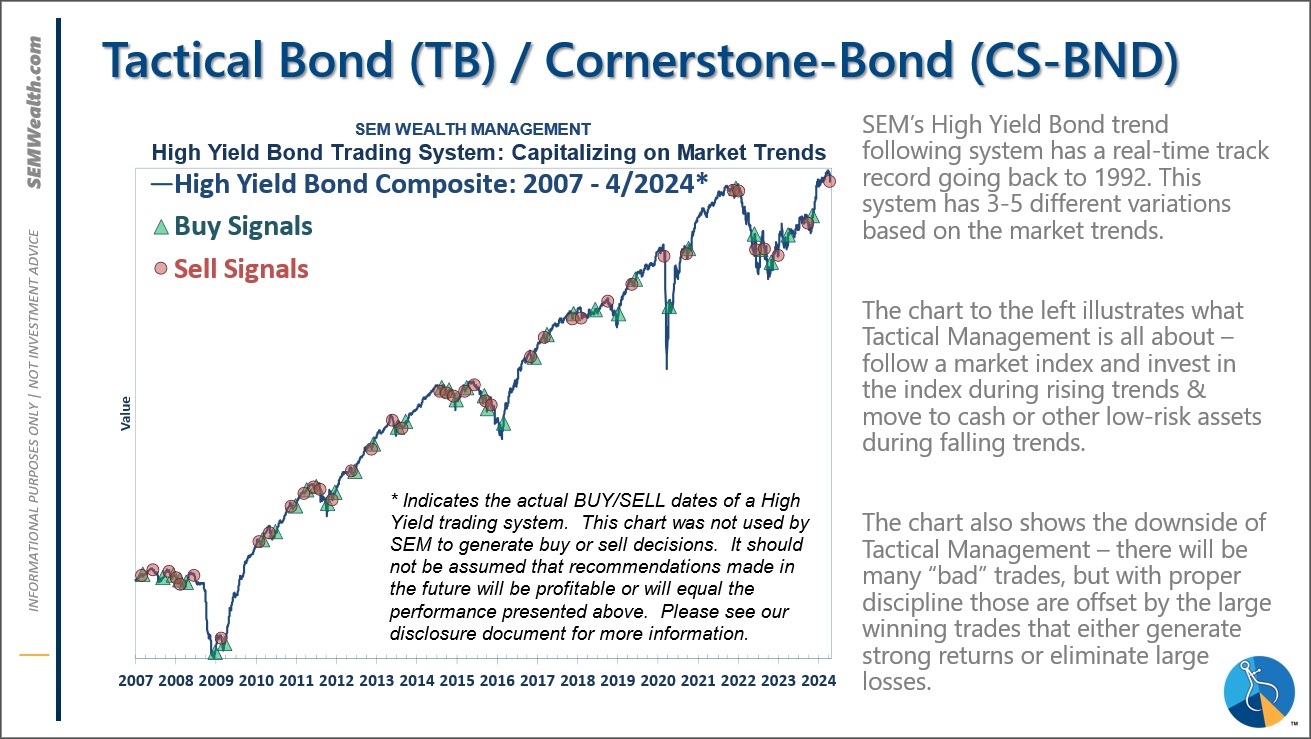
-(NEW)! Tactical High Yield went on a sell 4/16 & 17/2024
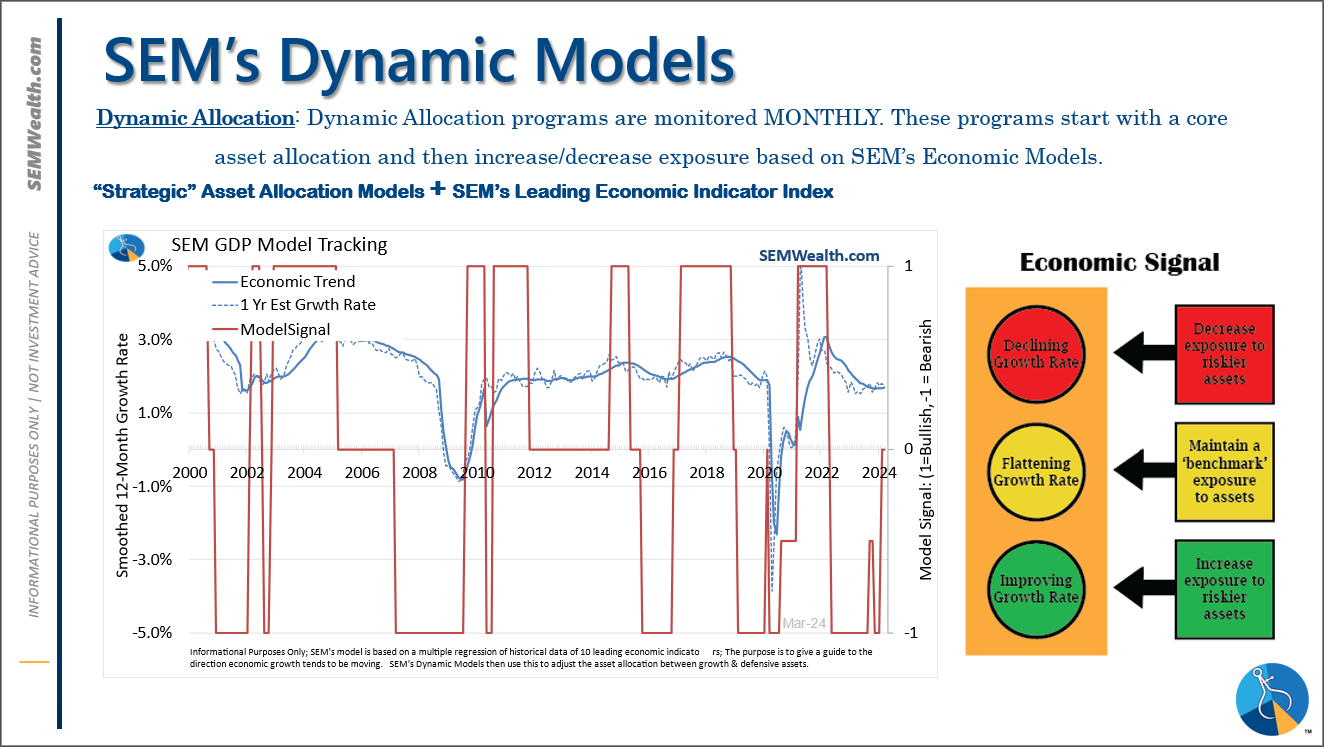
-Dynamic Models went to 'neutral' 2/5/2024
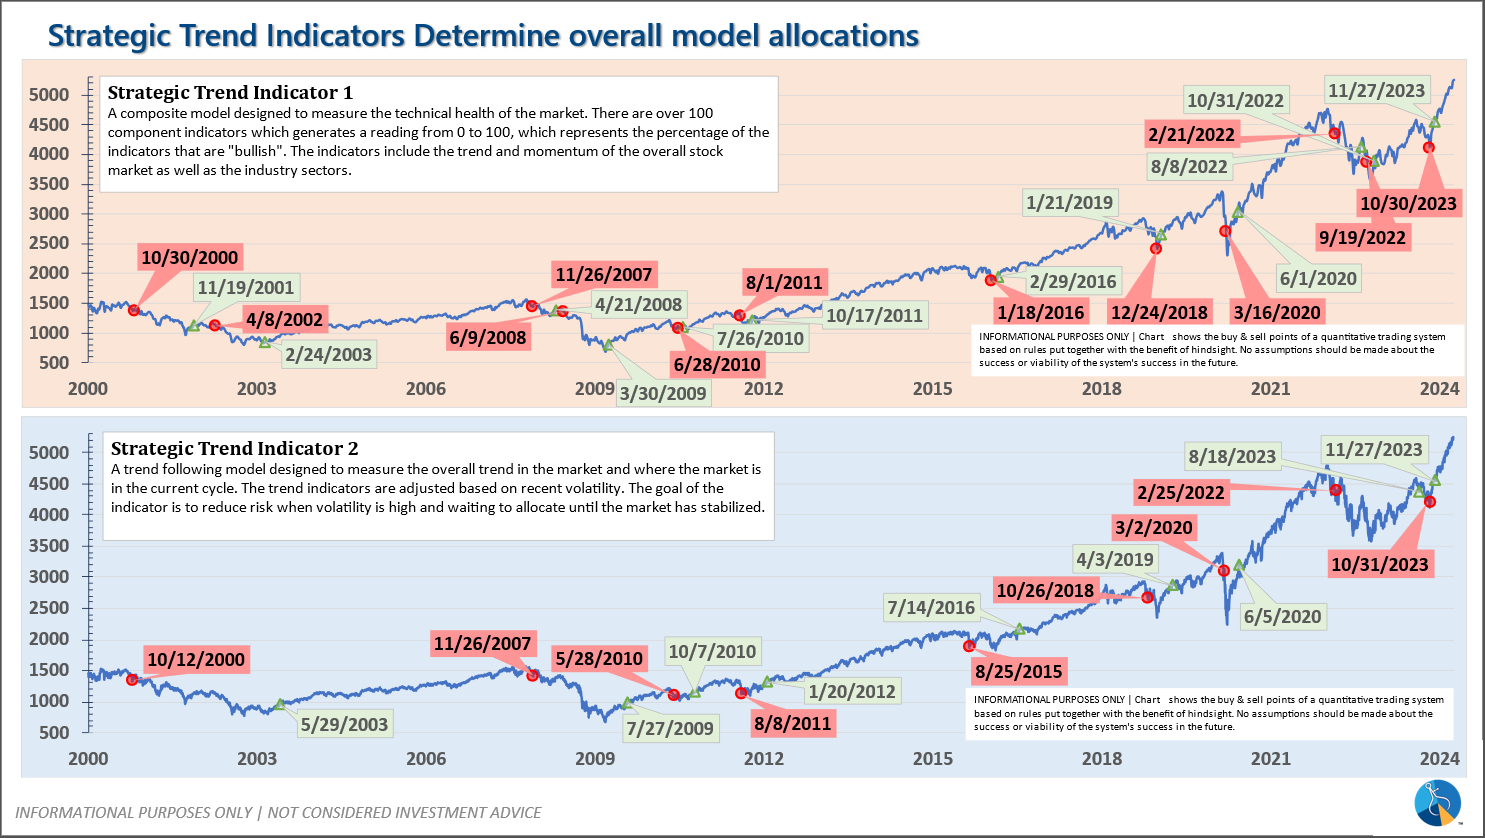
-Strategic Trend Models went on a buy 11/27/2023
SEM deploys 3 distinct approaches – Tactical, Dynamic, and Strategic. These systems have been described as 'daily, monthly, quarterly' given how often they may make adjustments. Here is where they each stand.
Tactical (daily): On 4/15 & 16, 2024 the High Yield Bond systems sold the positions bought on 11/3/2023. The money market funds we are currently invested in are yielding between 4.8-5.3% annually.
Dynamic (monthly): At the beginning of December the economic model reverted back to "bearish". This was reversed at the beginning of February. This means benchmark positions – 20% dividend stocks in Dynamic Income and 20% small cap stocks in Dynamic Aggressive Growth.
Strategic (quarterly)*:
BOTH Trend Systems reversed back to a buy on 11/27/2023
The core rotation is adjusted quarterly. On August 17 it rotated out of mid-cap growth and into small cap value. It also sold some large cap value to buy some large cap blend and growth. The large cap purchases were in actively managed funds with more diversification than the S&P 500 (banking on the market broadening out beyond the top 5-10 stocks.) On January 8 it rotated completely out of small cap value and mid-cap growth to purchase another broad (more diversified) large cap blend fund along with a Dividend Growth fund.
The * in quarterly is for the trend models. These models are watched daily but they trade infrequently based on readings of where each believe we are in the cycle. The trend systems can be susceptible to "whipsaws" as we saw with the recent sell and buy signals at the end of October and November. The goal of the systems is to miss major downturns in the market. Risks are high when the market has been stampeding higher as it has for most of 2023. This means sometimes selling too soon. As we saw with the recent trade, the systems can quickly reverse if they are wrong.
Overall, this is how our various models stack up based on the last allocation change: