
As a parent of 6 and grandfather to soon to be 4 grandchildren, I've used the phrase, "be careful what you wish for" more times than I can remember. As somebody who has been following the investment markets for over 30 years, I have used that phrase during a few economic and market cycles. It is most often mentioned at times like this — we've been on a nice run, the economy was chugging along nicely and handled Fed rate hikes, earnings growth expectations are well above the long-term average, but the market participants believe in order to keep going, the Fed needs to reverse course and start stimulating.
This leads to a strange dynamic where negative economic news leads to buyers stepping into the market. The thought process is, if the Fed sees the economy slowing then they will cut rates and save us from an economic slowdown. We saw that occur again on Friday following the June jobs report. Before we dig into the economic data and SEM's leading indicator model, let's start with a look at the Fed.
As I've said many times, other than a meteorologist or politician, the Federal Reserve is the only job where you can continue to make wrong predictions and yet still be trusted that you are good for the job. The belief is the Fed can cut interest rates and save a recession, but there have only been a couple of times over the past 70 years where that was true. Look at their most recent track record.
In both the late 90s and mid 2000s bubbles, the Fed was aggressively cutting rates. As signs of weakness emerged, they began cutting rates, yet both times (not the red lines when the recession started) it was too late. We had a severe recession and stocks lost half their value.
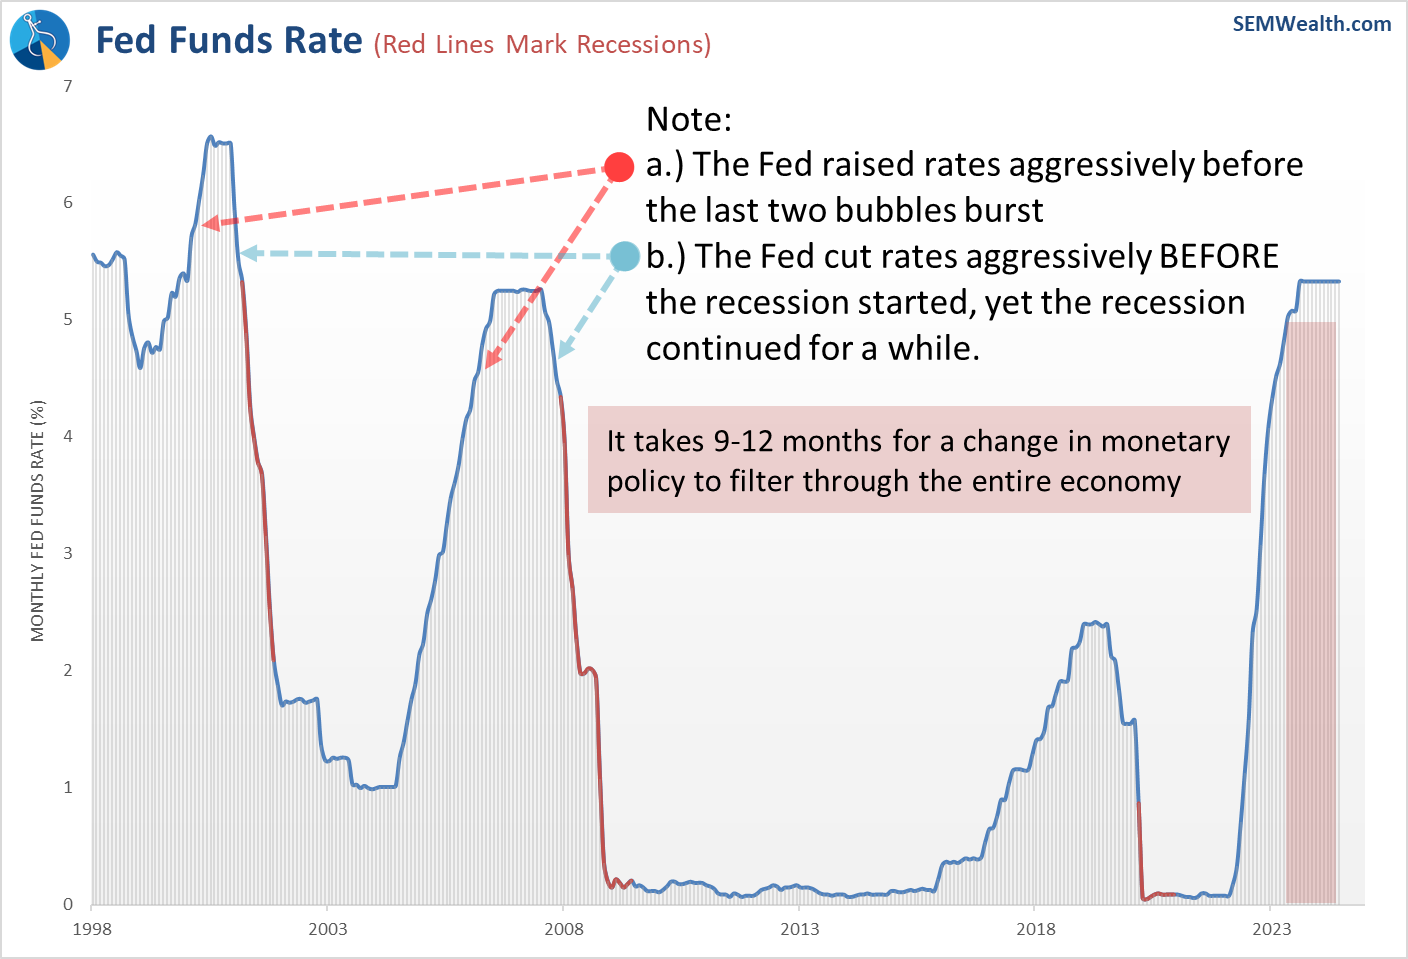
The reason for this has been studied by the Fed themselves – it takes 9-12 months for one change in monetary policy to trickle down through the economy. We are still dealing with some of the last rate hikes from 2023. Even if the Fed cut rates now it would not be enough to immediately change the slowing we are seeing in the economy. The other issue the Fed is dealing with, which we've discussed many times the past four years is the unknown impact of the unprecedented stimulus measures used to fight the pandemic.
Be careful what you wish for – if the economy slows too quickly there is NOTHING the Fed can do to stop it.
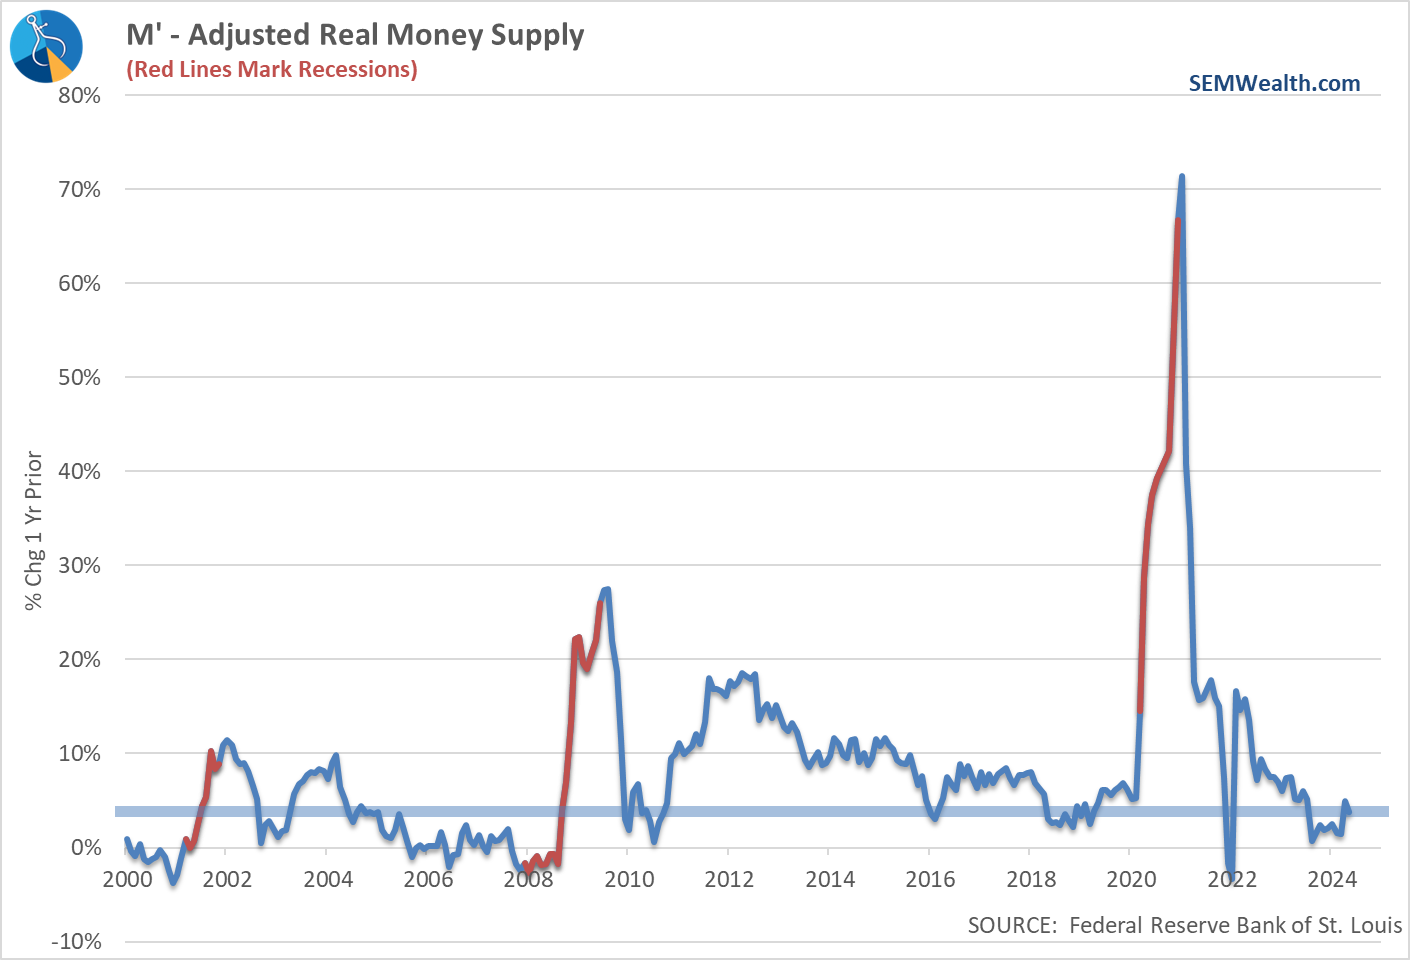
I've noted this before – when you factor in brokerage money market assets, as we do in our M-Prime leading indicator, money is still LOOSE (we have 3% more money in the system than we did a year ago). If the Fed truly wants to get inflation down to their 2% target, they most likely need to push the money supply rate of change into negative territory.
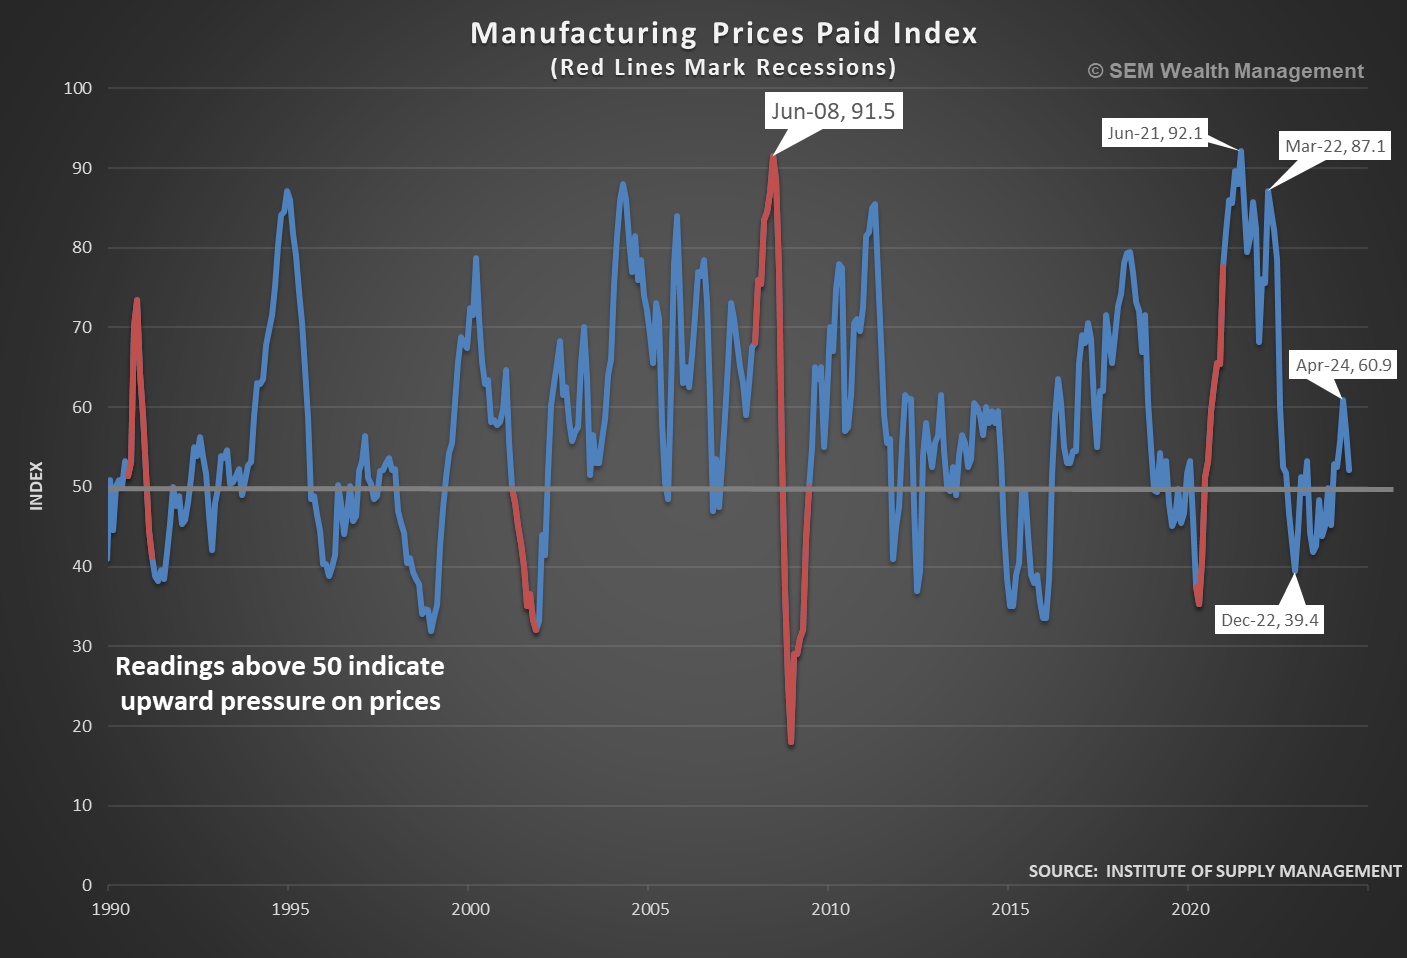
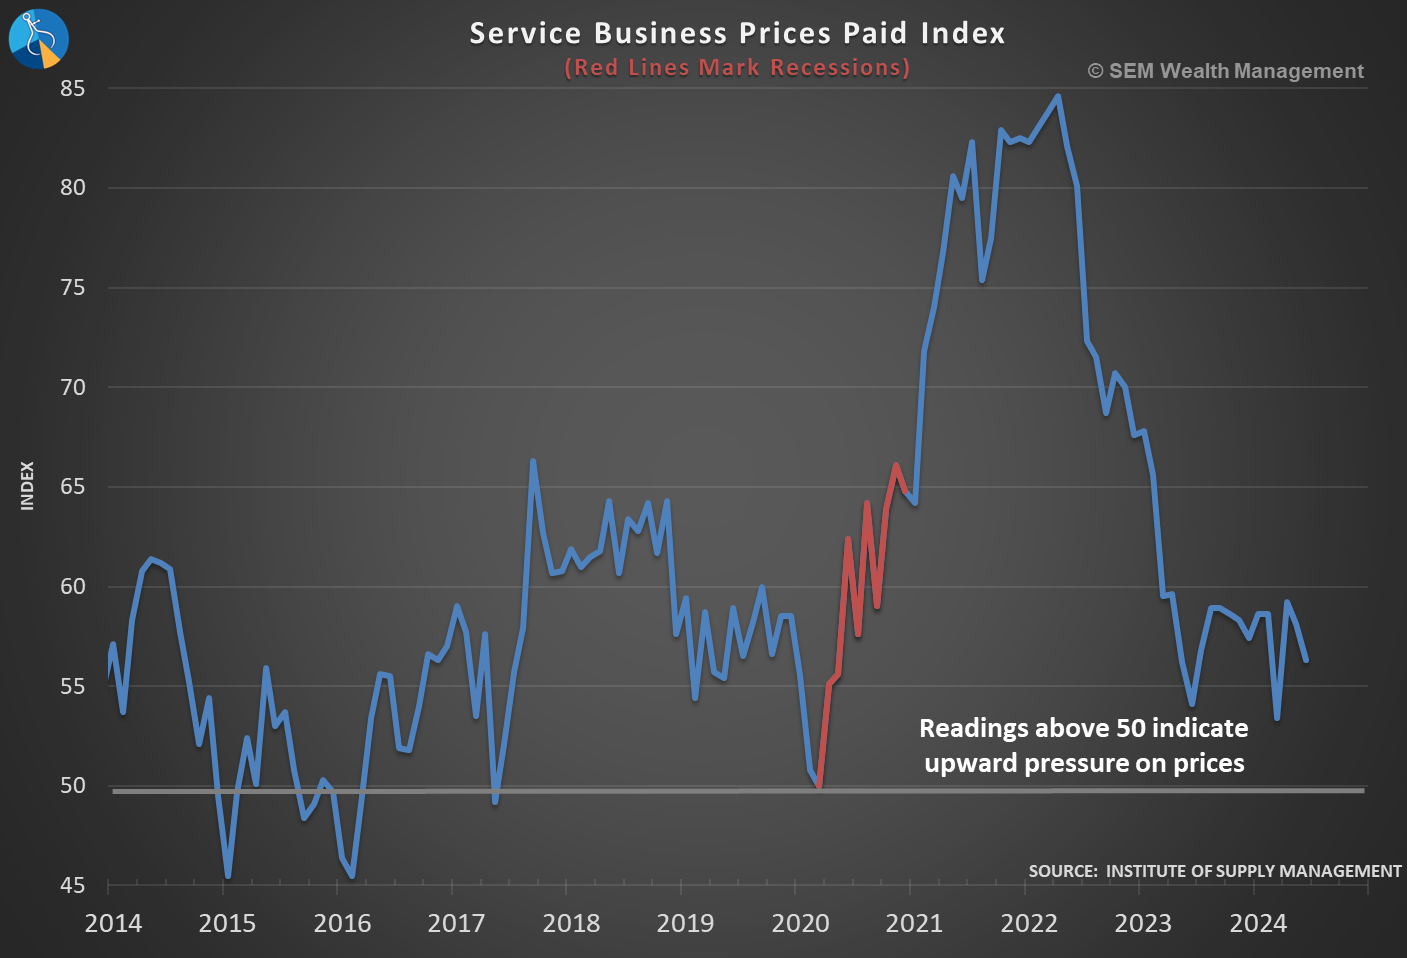
If the Fed were to cut rates we could see money flowing out of money market accounts and create another inflationary bubble just as they did in 2020 and 2021. That may be good for the market short and intermediate-term, but eventually the market can mathematically only rise at the same pace of the economy (factoring in dividends and inflation). While slowing, the ISM numbers still indicate upward pricing pressure in both manufacturing and services (any number above 50 indicates EXPANSION of that indicator).
SEM Economic Model Update
Since we just completed our Economic Update in our latest SEM University back on June 26, I'll only hit a few highlights. To watch our full update, including the always fun Q&A session, check it out here:

Thankfully, unlike the Fed, we do not have to sit around in a room every 6 weeks for a couple of days and prognosticate what we think is going to happen. In 1995 I developed a systematic way to look at the economy. There have only been a few tweaks since 2001 when I mechanized it fully. This allows us to simply take a look at the data without emotion and adjust accordingly.
One look at our dashboard and you can see the problem – most of SEM's leading indicators are either indicating a slowing economy or one that is ready to fall.
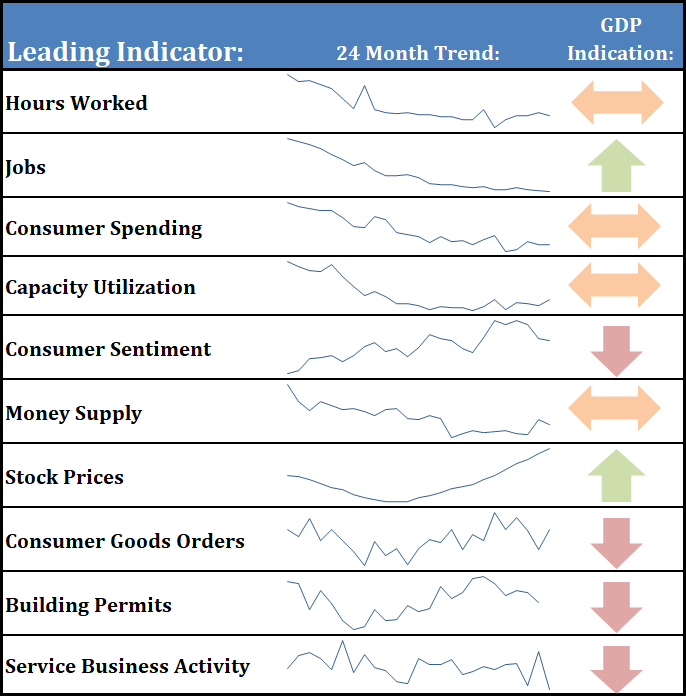
Stock prices are a leading indicator which is always a "chicken or egg" conversation. Fundamentally, stocks are a 'forward looking mechanism' meaning if the majority of investors believe earnings are slowing stocks can be used as a leading indicator of an economic slowdown. This worked well in every recession except the brief COVID recession and the end of the housing bubble when stocks peaked at the same time the economy was. Every other time stocks began rolling over before the recession.
You can choose to believe it will be "different" this time like it was in 2020 or take a look at history and see how quickly you can lose money when a recession hits.
The only other indicator which is positive in our dashboard is Jobs, which ironically the market somehow perceived as a 'negative' report (because the unemployment rate ticked higher and the prior months' estimates were reduced somewhat). Jobs are still running at a nice clip (for now).
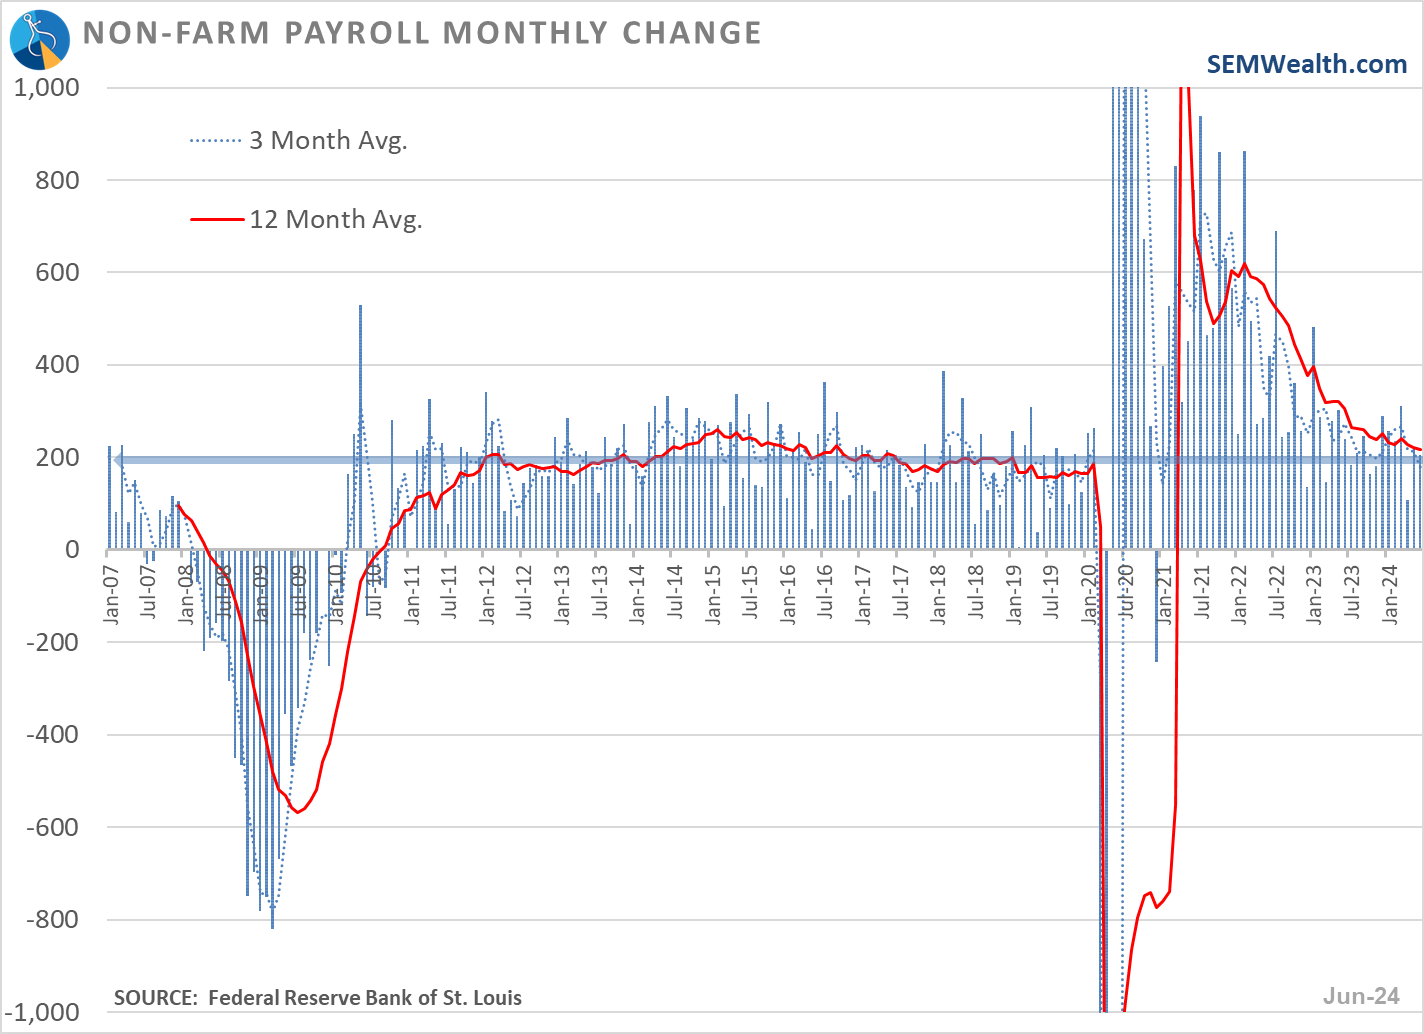
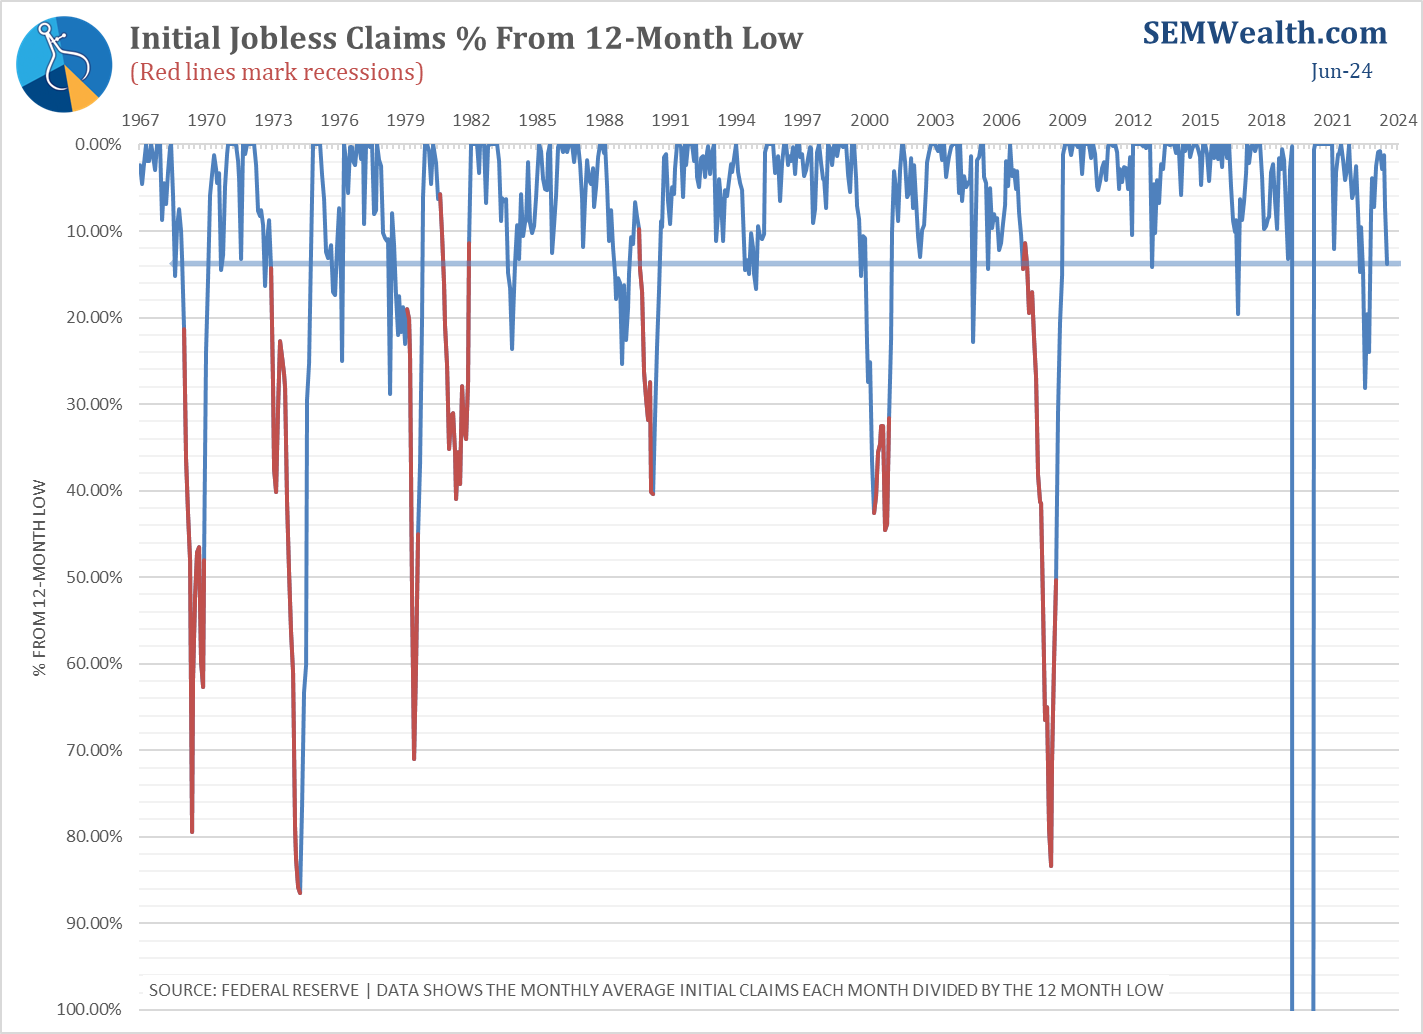
Jobs are actually more of a 'coincident' indicator, meaning the number of jobs turns lower just as a recession is hitting. We monitor the rate of change more than whether the number is positive or negative. We also look at initial jobless claims and how much they have risen off the lows. While still not a red light, the direction in claims is flashing yellow.
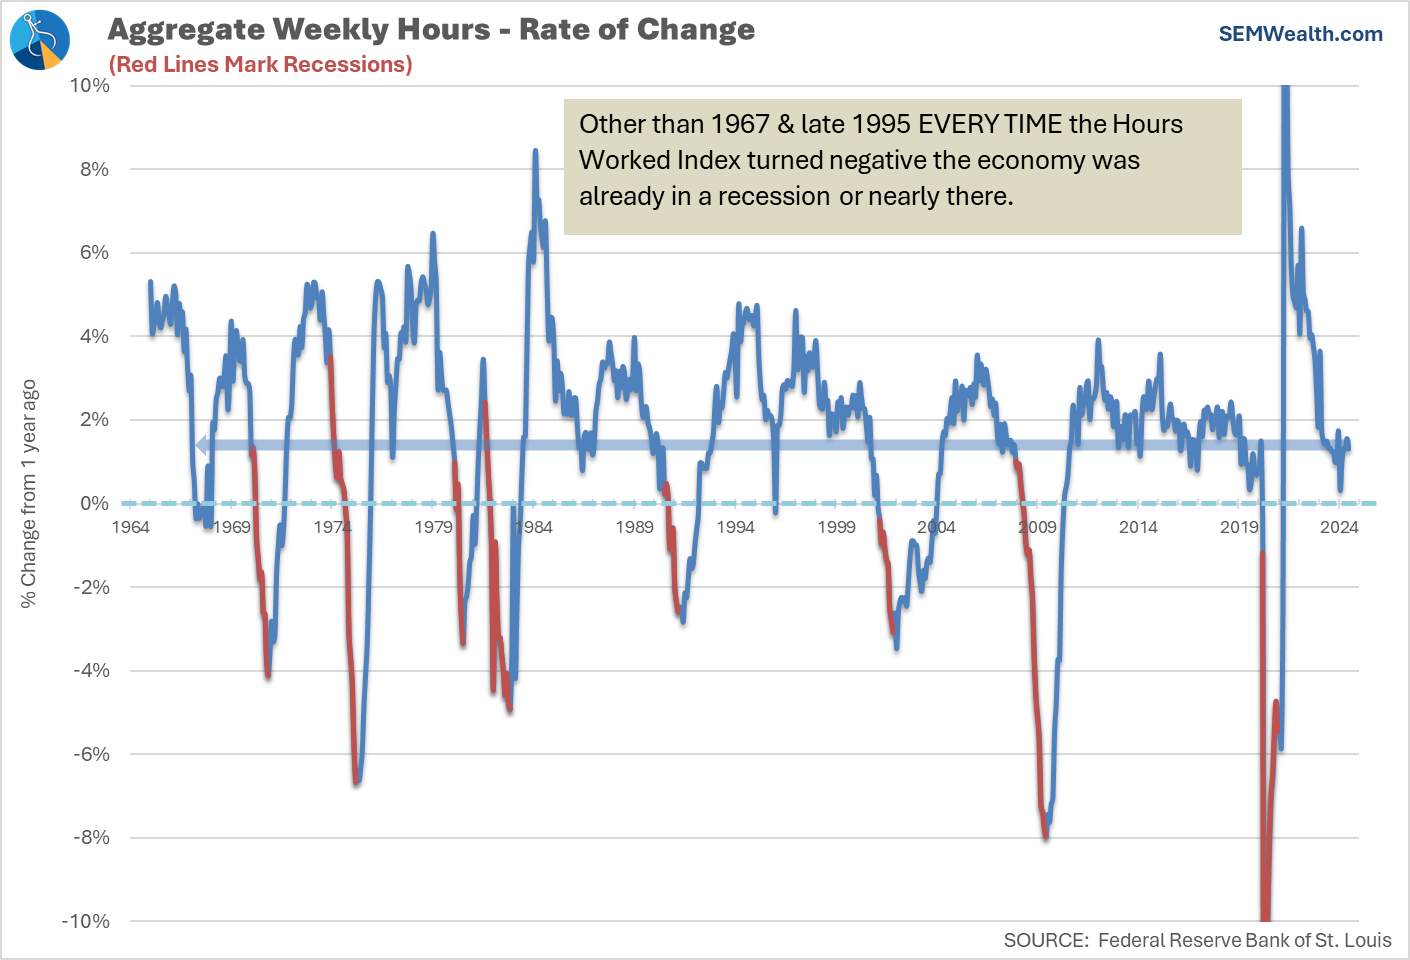
The other indicator I watch closely is the change in the Aggregate Weekly Hours index. It is still positive, although the current slow rate of change is hinting towards a slow down.
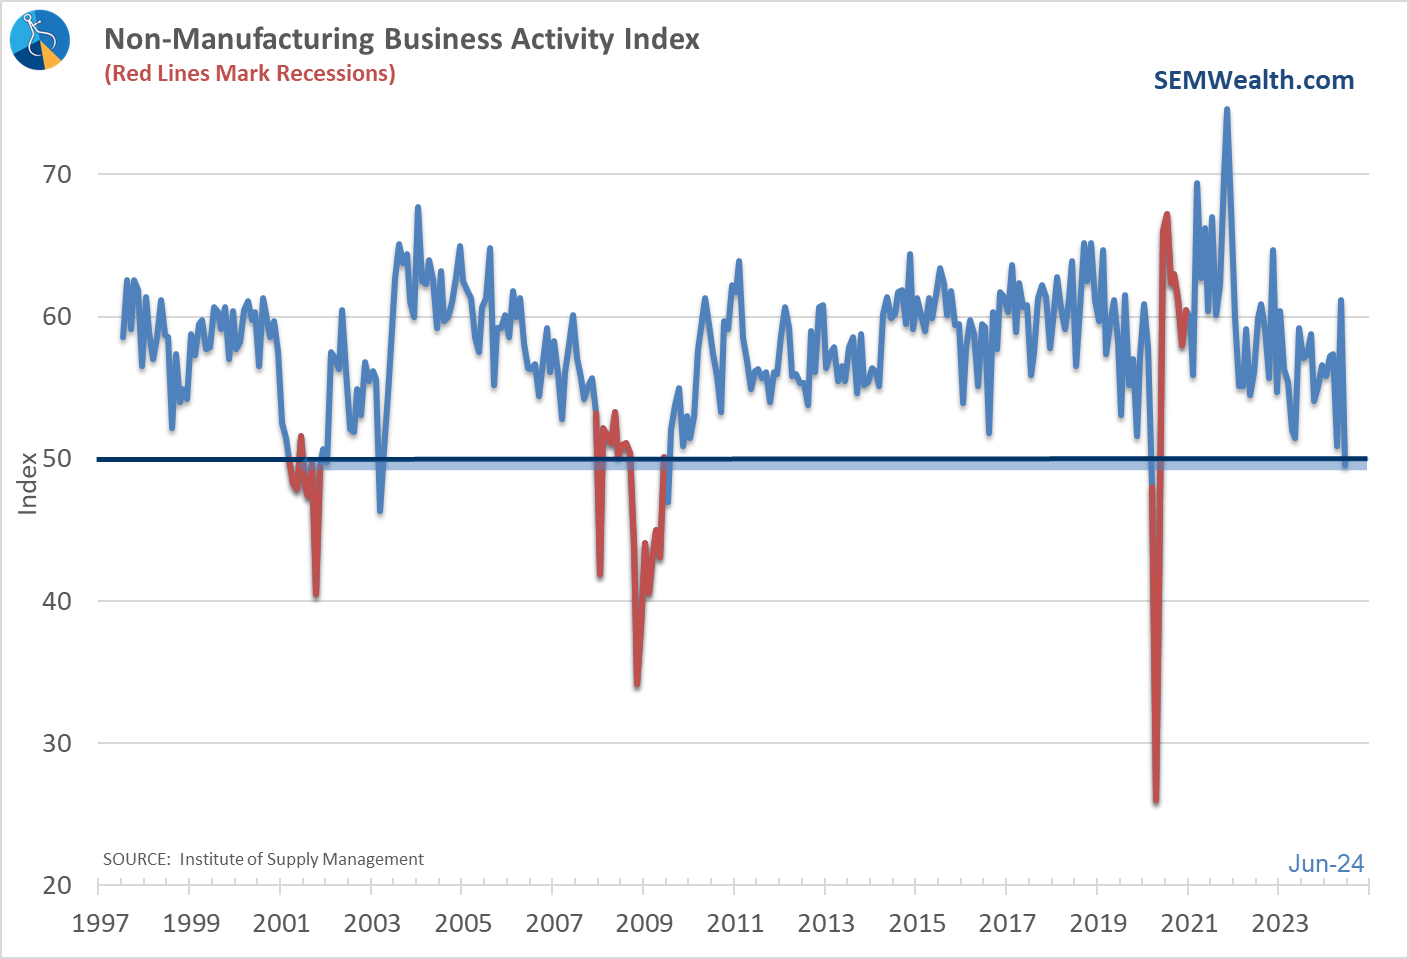
We've discussed most of the other indicators throughout the month of June. The one that stood out with this month's update was Service Business Activity. Our economy has been a service driven economy for the better part of 30 years. While that helps boost profits for US companies, I call these jobs "easy come, easy go." Because of the usually low overhead service businesses can be created quickly, but they can also go out of business quickly.
We saw a sharp drop in Service Business Activity in June, taking this indicator slightly below 50 (which would indicate a slowdown in that sector). This indicator can jump around quite a bit, but you better believe I'll be tuning in when it is released again the first week of August.
For now, the SEM Economic Model remains "neutral" indicating an economy that is still growing around an "average" pace (2.5-3%). Another month like June and we will be back to "negative" again.
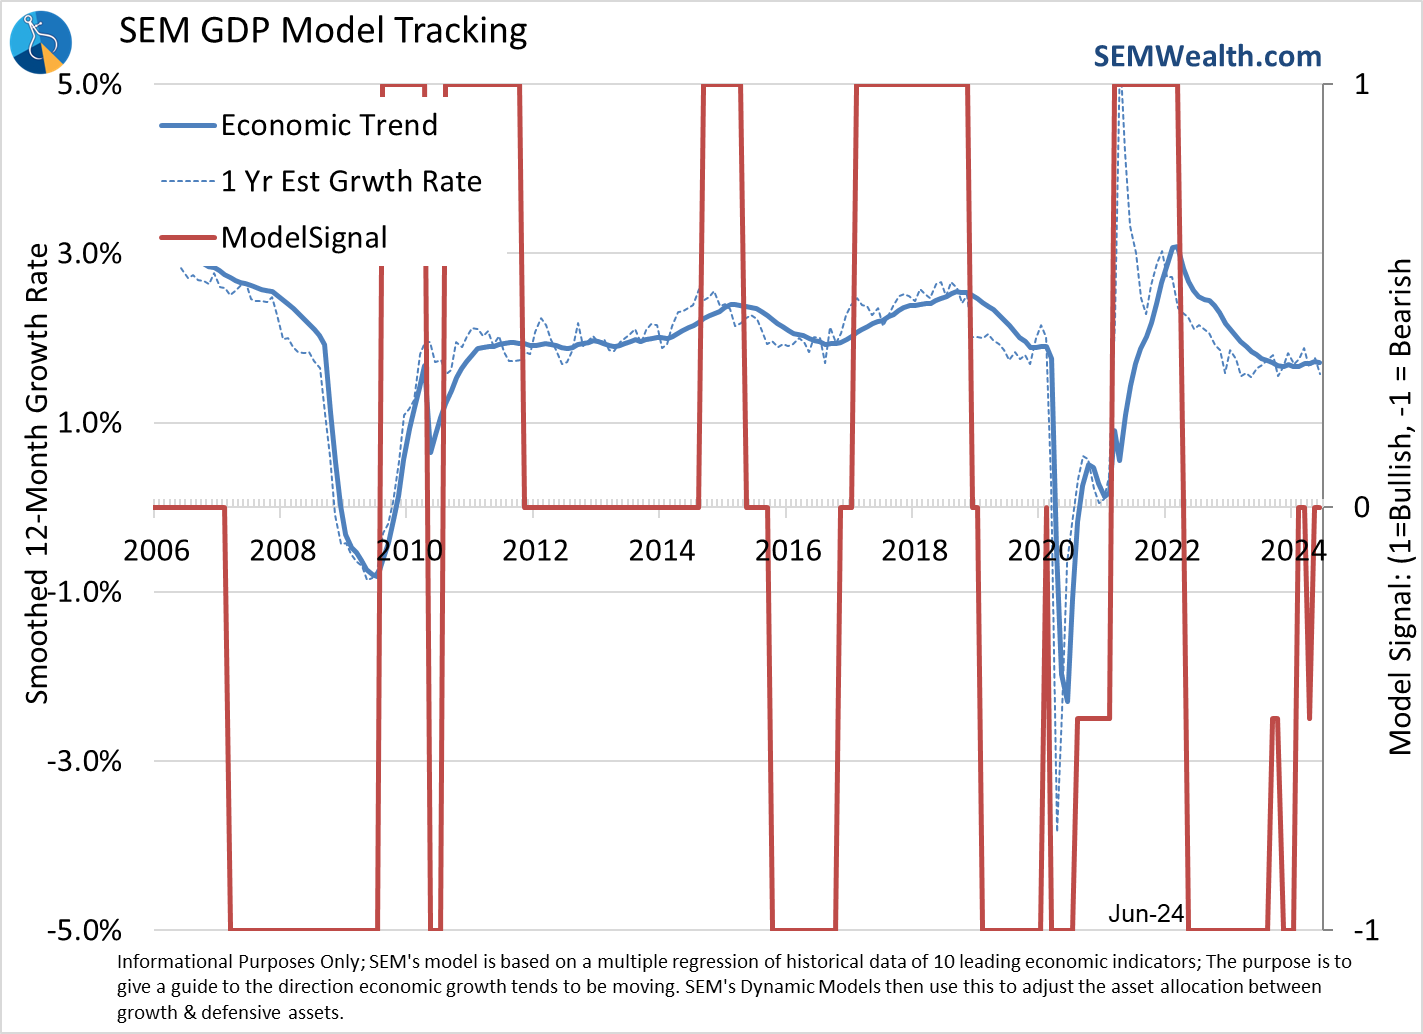
As a reminder or for those of you new to the blog or SEM, a "neutral" indicator in our model means "benchmark" allocations for our Dynamic series of models. For Dynamic Income that means 20% in dividend growth stocks. For our Dynamic Aggressive that means 20% in small cap stocks, around a 70% stock allocation overall with the balance of the allocation in bonds, tactical fixed income, and "market neutral" type funds. Transition periods like this are the most volatile which is why you do not see big bets in either direction.
Interest Rate Model Tweaks
We did see a slight tweak in the portfolios – our "interest rate duration" model moved from slightly bearish to slightly bullish (meaning lower rates on the 10-year). This monthly signal looks at more than just the trend, but you can see on a weekly chart 10-year rates have moved below the uptrend channel although they are still fighting around the 4.25% mark.
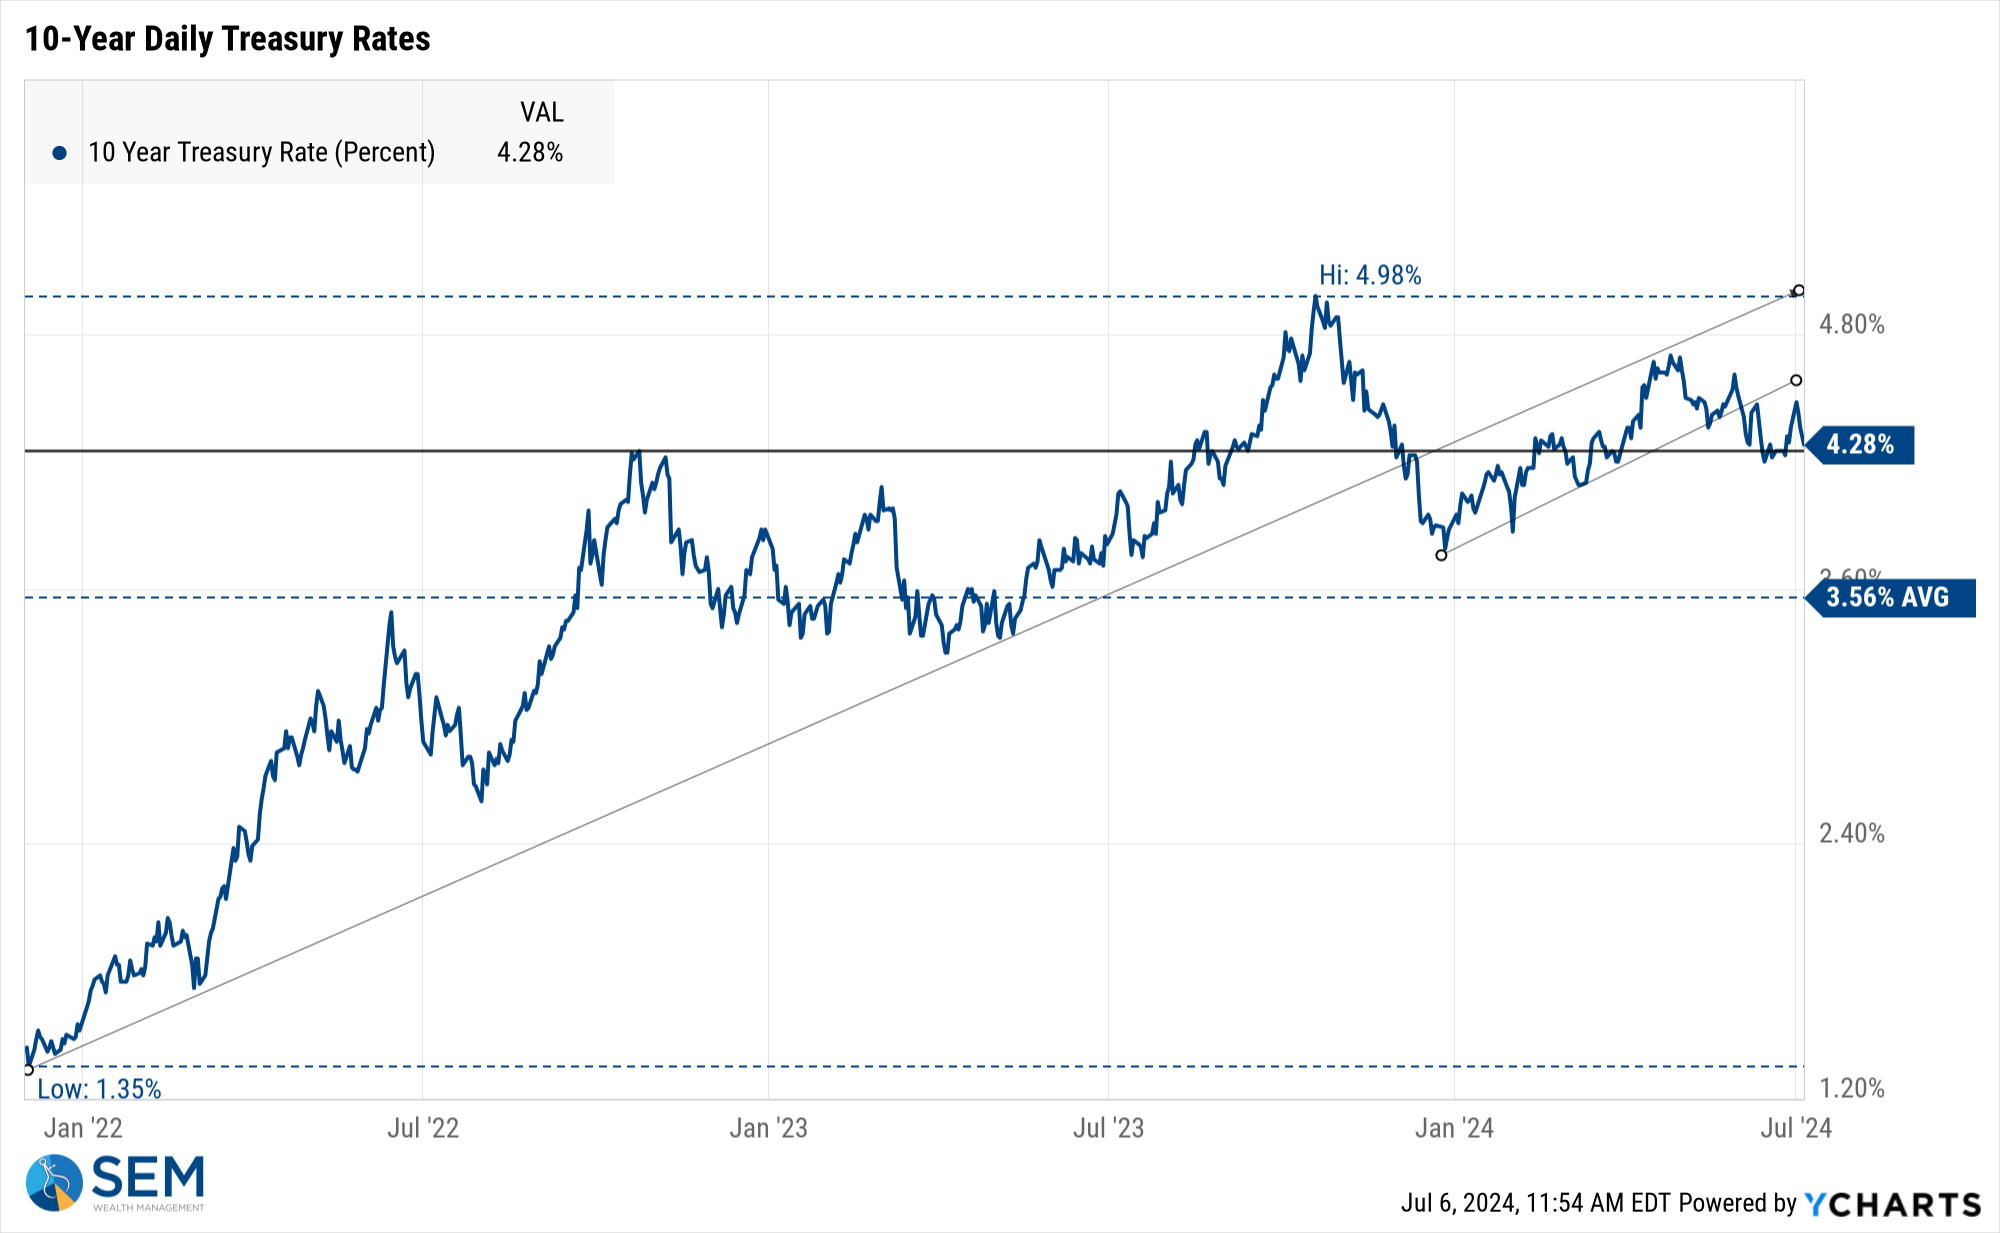
The move in Dynamic Income is small – selling the 10% Treasury "Bear" fund, buying 5% in a Treasury "Bull" fund with the rest moving to shorter-duration fixed income funds yielding 5-6%. Like the economic model, this model could make a more decisive move based on the data we see the rest of July.
AmeriGuard & Cornerstone Core Shifts
The first of the quarter always brings a fresh signal to the "Core Rotation" system inside AmeriGuard and Cornerstone. This quarter brought just some minor changes, with the model exiting small and mid-caps in favor of Large Cap value (we already had an 'overweight' in large cap growth). The last quarter was not a good one unless you were in the large (mega) cap growth space.
While the Core Rotation System is a momentum based system, it does have some 'overbought/oversold' indicators. Large Cap Growth is not yet 'overbought' in our model, while Large Cap Value is 'oversold'. Despite the losses small and mid-cap stocks are not yet to a place where the model believes they will reverse their downtrend. We also added a bit of international exposure (10% in the Growth models), which as long-time readers know has been a rare occurrence these past 7 years.
It doesn't always happen this way, but this Core Rotation shift aligns with the signals from our Dynamic models which indicate the economy could be at risk. As a reminder, these models are still "bullish" overall and at their maximum equity exposure. These tweaks are small overall (only about 7-15% of the overall models).
Market Charts
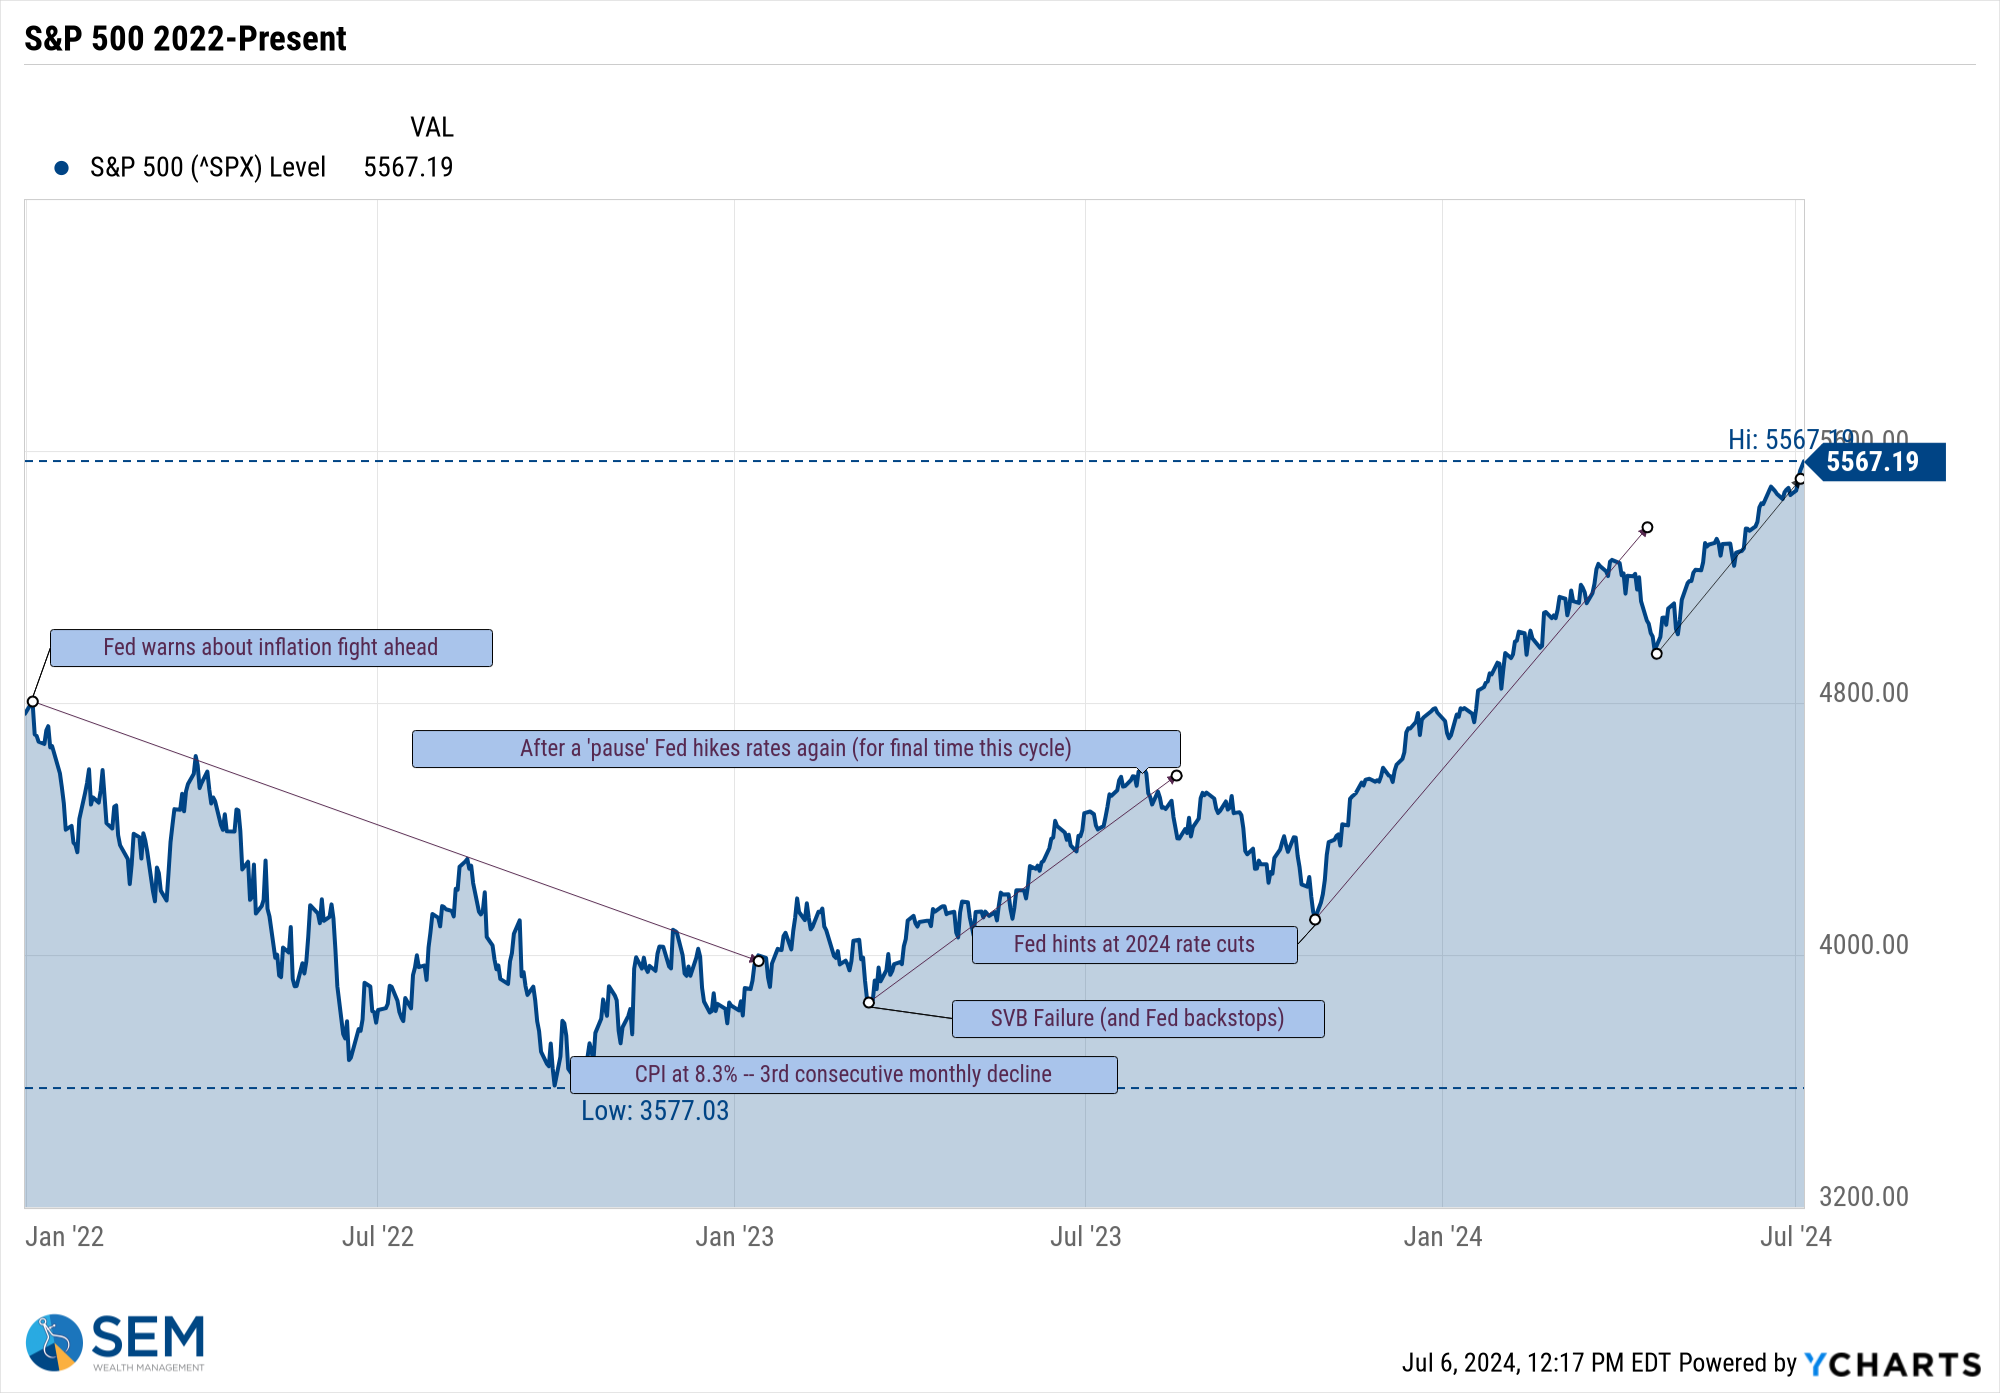
Despite the above warnings of being careful, the most common phrase I've written this year is, "higher highs bring higher highs ..... until something SIGNFICANT comes along to shift the trend." That is still the case for the S&P 500 (mega-cap growth stocks).
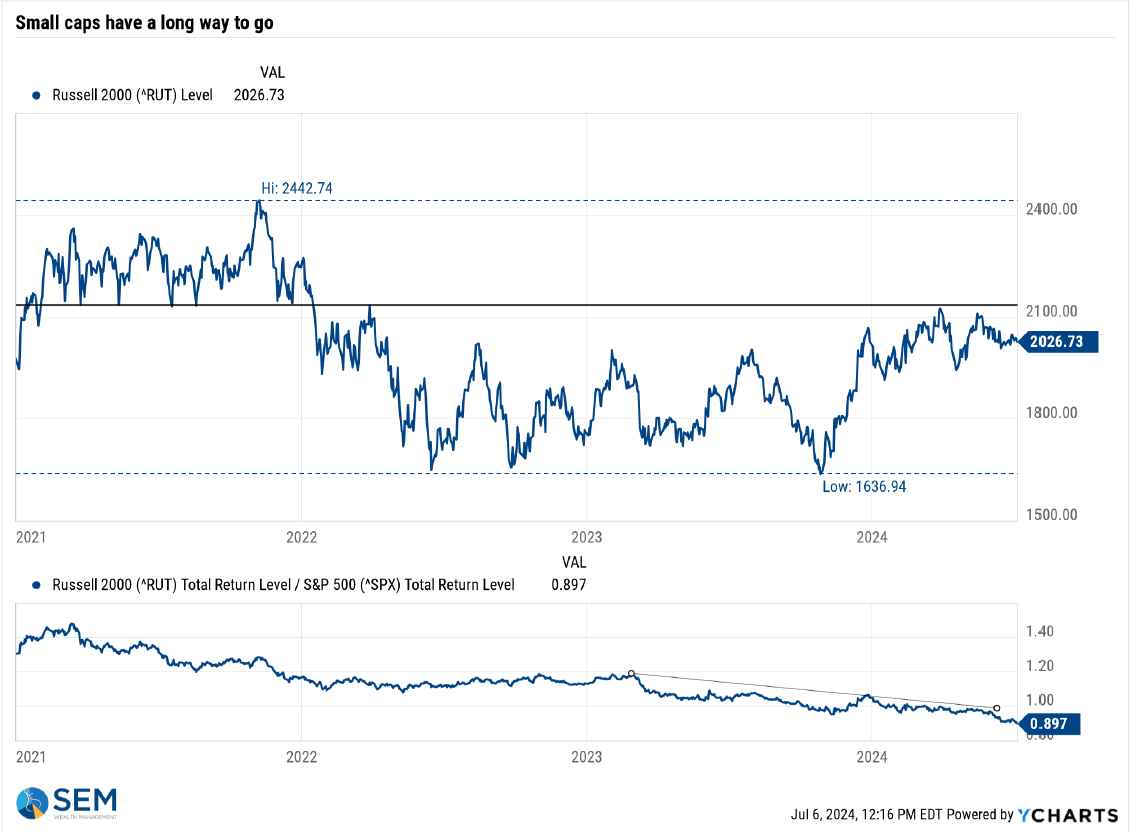
That is not the case for small cap stocks, which saw the small/large ratio deteriorate even further last week. History tells us sooner or later this will flip and you'll want to be overweight small cap. When that happens is anybody's guess, but based on past bubbles, it could come as the mega-cap growth stocks are deflated under the weight of their unreasonable growth expectations.
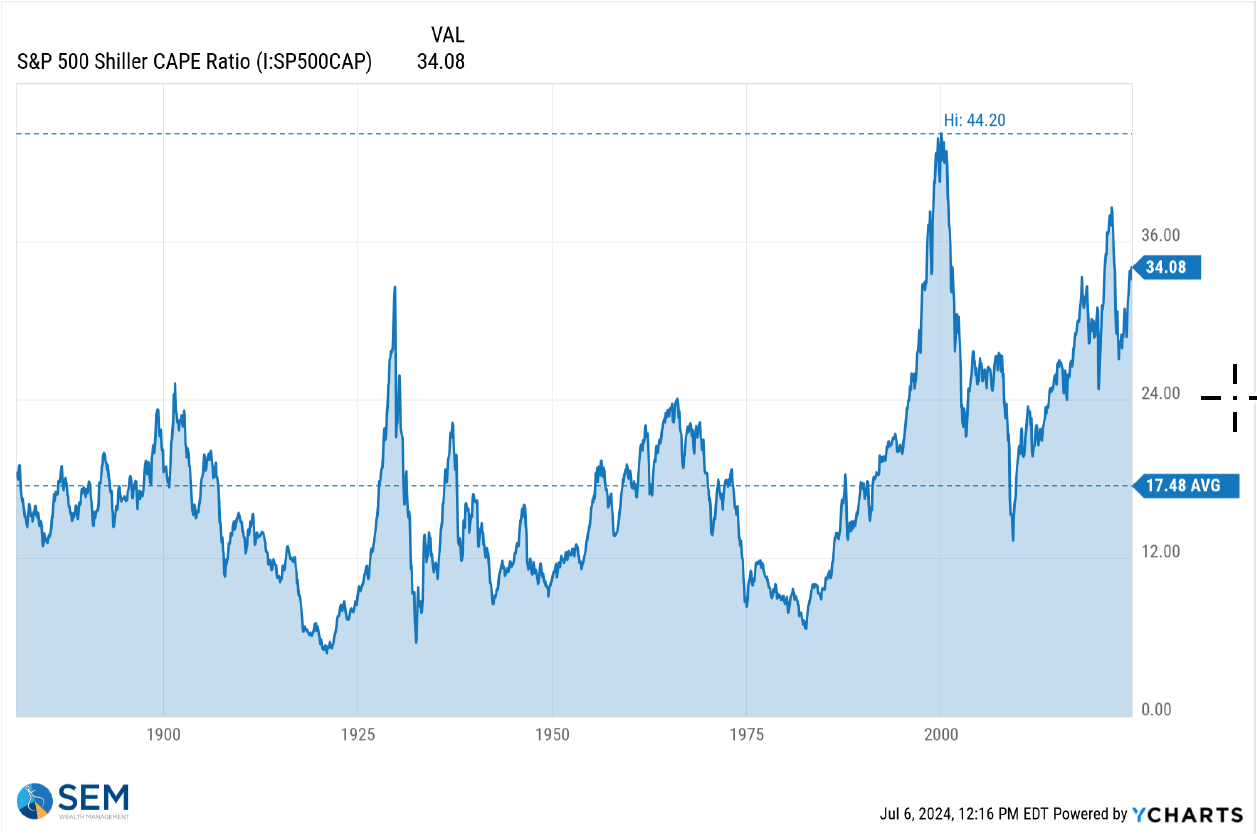
There have only been two times in history the Shiller PE (CAPE) has been higher – in early 2000 and late 2021. One ended with a 50% drop in large cap stocks and an 85% drop in the NASDAQ 100. The other ended with a very quick 25% drop in large cap stocks and a 35% drop in the NASDAQ.
Higher highs do lead to higher highs, but if you have NEW money that is not LONG-TERM (10-12 years or longer) better entry points will come. Please be careful chasing the market here and also please adjust your expectations for stock returns going forward until we get that reset.
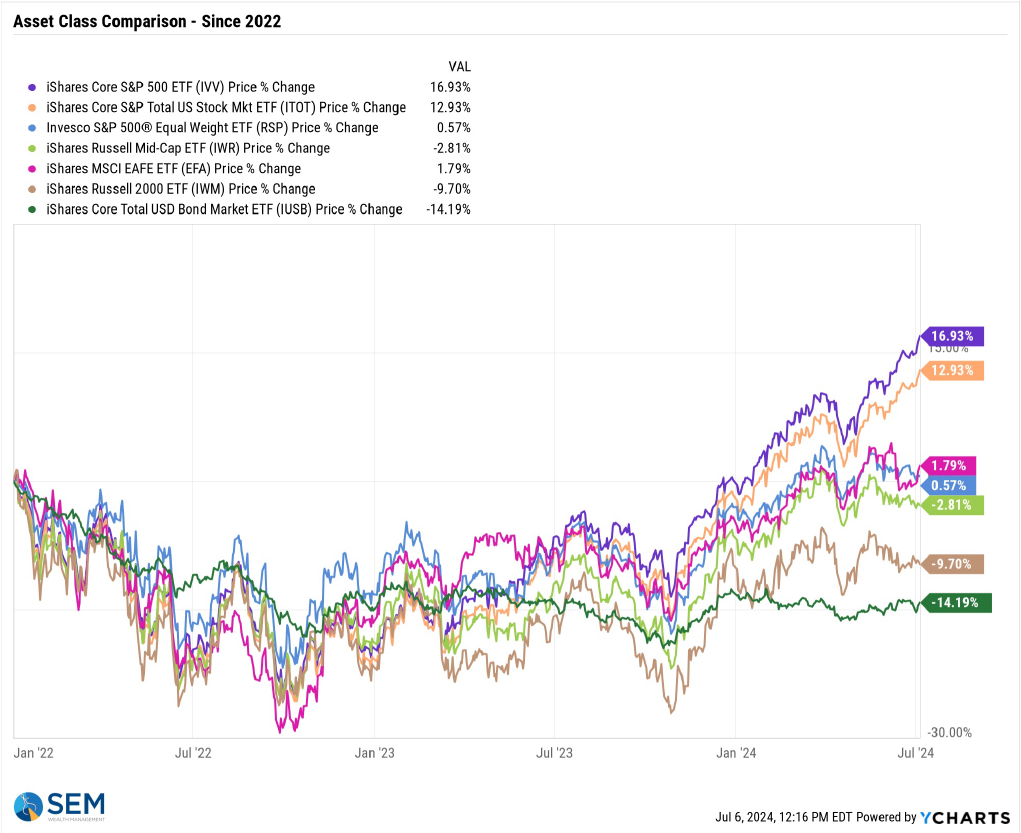
Be especially careful chasing the leading stocks in the S&P 500. The average stock in the S&P is FLAT since the end of 2021 (see the equal weight ETF below). Long-term the stock market is a mean-reverting mechanism meaning those outperformers turn into underperformers when they can no longer meet the expectations of their investors.
SEM Model Positioning
-Tactical High Yield had a partial buy signal on 5/6/24, reversing some of the sells on 4/16 & 17/2024 - the other portion of the signal remains on a sell as high yields continue to oscillate.
-Dynamic Models are 'neutral' as of 6/7/24, reversing the half 'bearish' signal from 5/3/2024. *NEW* 7/8/24 - interest rate model filled from partially bearish to partially bullish (lower long-term rates).
-Strategic Trend Models went on a buy 11/27/2023; *NEW* 7/8/24 – small and mid-cap positions eliminated with latest Core Rotation System update – money shifted to Large Cap Value (Dividend Growth) & International Funds
SEM deploys 3 distinct approaches – Tactical, Dynamic, and Strategic. These systems have been described as 'daily, monthly, quarterly' given how often they may make adjustments. Here is where they each stand.
Tactical (daily): On 5/6/24 about half of the signals in our high yield models switched to a buy. The other half remains in money market funds. The money market funds we are currently invested in are yielding between 4.8-5.3% annually.
Dynamic (monthly): The economic model was 'neutral' since February. In early May the model moved slightly negative, but reversed back to 'neutral' in June. This means 'benchmark' positions – 20% dividend stocks in Dynamic Income and 20% small cap stocks in Dynamic Aggressive Growth. The interest rate model is slightly 'bullish'.
Strategic (quarterly)*: BOTH Trend Systems reversed back to a buy on 11/27/2023
The core rotation is adjusted quarterly. On August 17 it rotated out of mid-cap growth and into small cap value. It also sold some large cap value to buy some large cap blend and growth. The large cap purchases were in actively managed funds with more diversification than the S&P 500 (banking on the market broadening out beyond the top 5-10 stocks.) On January 8 it rotated completely out of small cap value and mid-cap growth to purchase another broad (more diversified) large cap blend fund along with a Dividend Growth fund.
The * in quarterly is for the trend models. These models are watched daily but they trade infrequently based on readings of where each believe we are in the cycle. The trend systems can be susceptible to "whipsaws" as we saw with the recent sell and buy signals at the end of October and November. The goal of the systems is to miss major downturns in the market. Risks are high when the market has been stampeding higher as it has for most of 2023. This means sometimes selling too soon. As we saw with the recent trade, the systems can quickly reverse if they are wrong.
Overall, this is how our various models stack up based on the last allocation change:
Questions or comments - drop us a note?
Curious if your current investment allocation aligns with your overall objectives and risk tolerance? Take our risk questionnaire


