The S&P 500 closed the week above 5000 for the first time in its history. After stumbling to start the year, this is the 5th straight positive week for the mega-cap growth heavy index.
I was once again back at the Liberty University School of Business, this time guest lecturing in the Investments class on Common Stock Valuation. As we dove into the various ways to value a stock, we looked at the variables Wall Street uses to determine whether a stock is over or under valued. You'll notice a couple of things as you dive deeper into any of these models:
1.) The inputs you use in the variables are highly subjective – there is no source you can go to which tells you what to use for discount rate (k), risk premium (Rp) or growth rates (g).
2.) The models are hyper sensitive to very small changes in any of the variables.
Because of this, how the market participants FEEL currently about the future can cause prices to move in extreme directions. Understanding this means acknowledging that an overvalued stock market will remain overvalued until the FEELINGS driving valuations changes. When it does, stocks can move very rapidly in the opposite direction.
I showed this slide to illustrate the relationship between the valuation model inputs and prices.
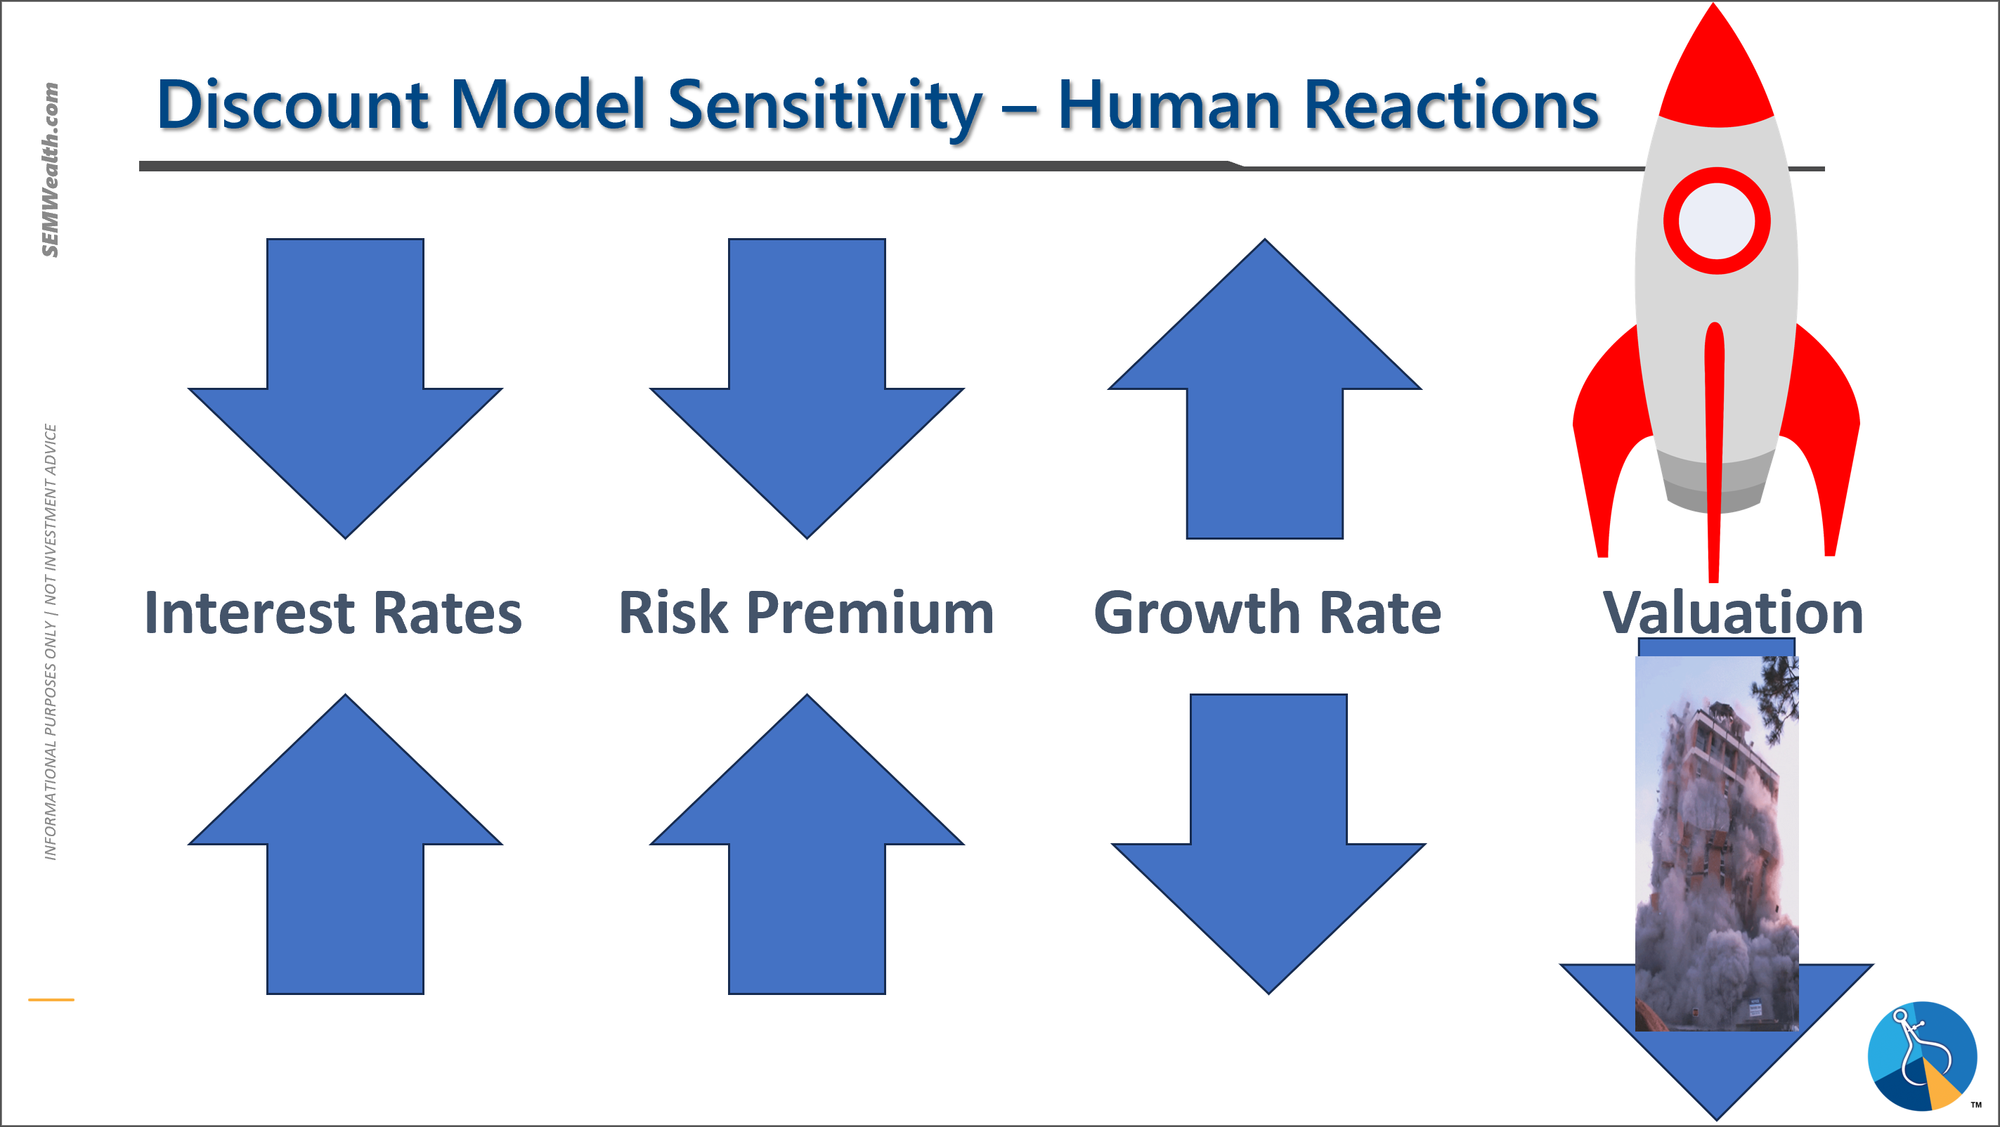
If interest rates (part of the discount rate - k) go down (or are expected to go down), market participants believe this will make for a less risky environment, so the risk premium (Rp) also drops. The lower interest rates also means the expectation of growth (g) will increase. Each of these together all push valuation estimates to the moon.
Conversely if interest rates are expected to go up, risks are perceived to be higher and growth prospects lower. This causes valuation estimates to implode.
I then walked through sensitivities of small changes in each variable. By themselves individually the valuation estimates change in fairly decent chunks, but considering the inter-connectivity of each as illustrated above, using the S&P 500 you can see how and why these small changes can cause huge moves.
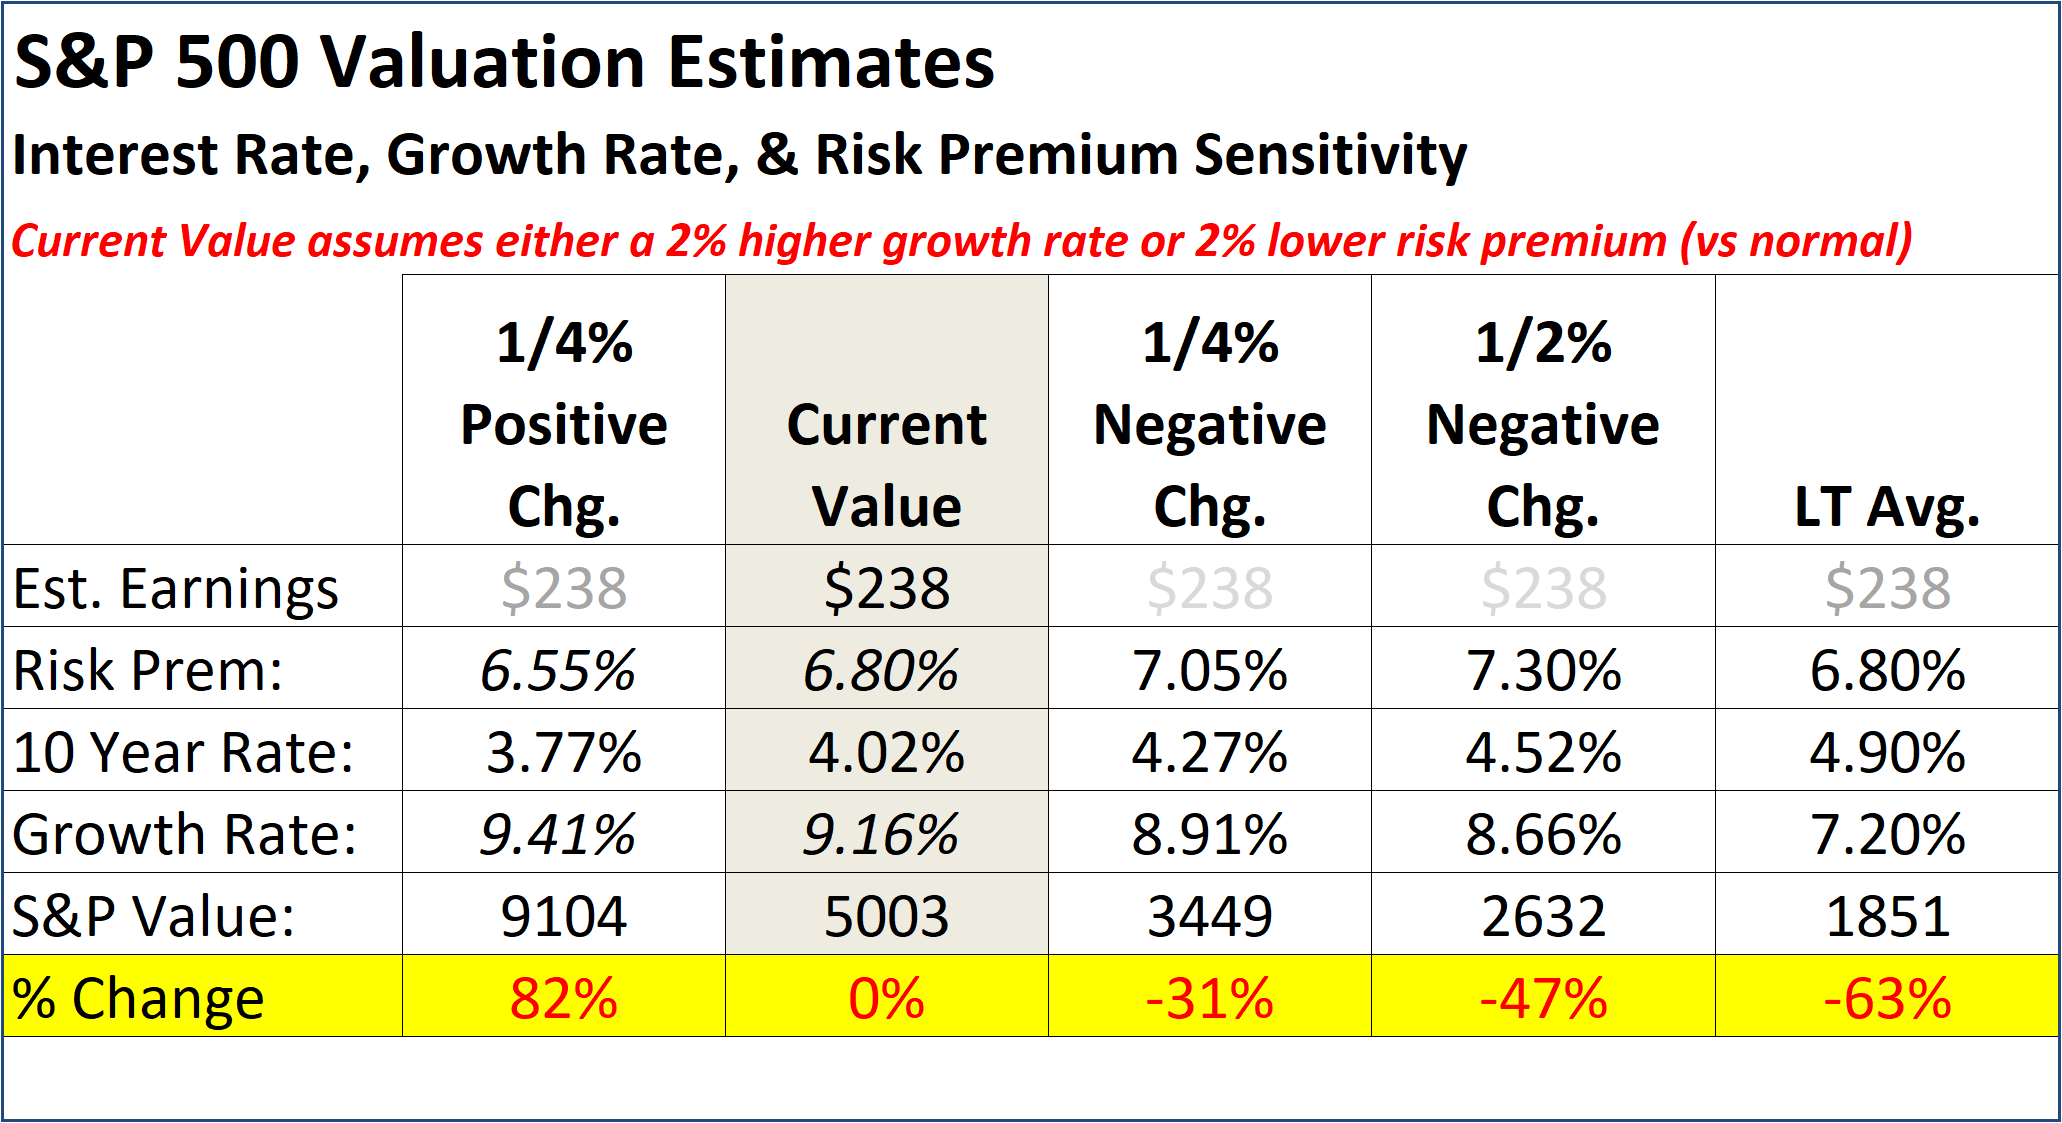
The current market is pricing in either a 2% higher growth rate or lower risk premium based on current values (or 1% higher growth and 1% lower risk premium). It's hard to believe the market could continue to price in a much better than average future environment for too much longer, but the "1/4% positive change column shows the potential upside if we see rates drop and growth increasing.
On the right side of the table you can see the potential downside. While it is hard to imagine the market suddenly moving back to the long-term average in the far right column, there is certainly tremendous risk of disappointment.
All of that said, the words of John Maynard Keynes ring true now more than ever:
The markets can remain irrational far longer than you can remain solvent
Over the very long run we are big believers in the stock market and its ability to provide solid returns. Over shorter periods of time the market becomes over optimistic, which eventually turns into an overly pessimistic period. We use this chart to illustrate our stance:
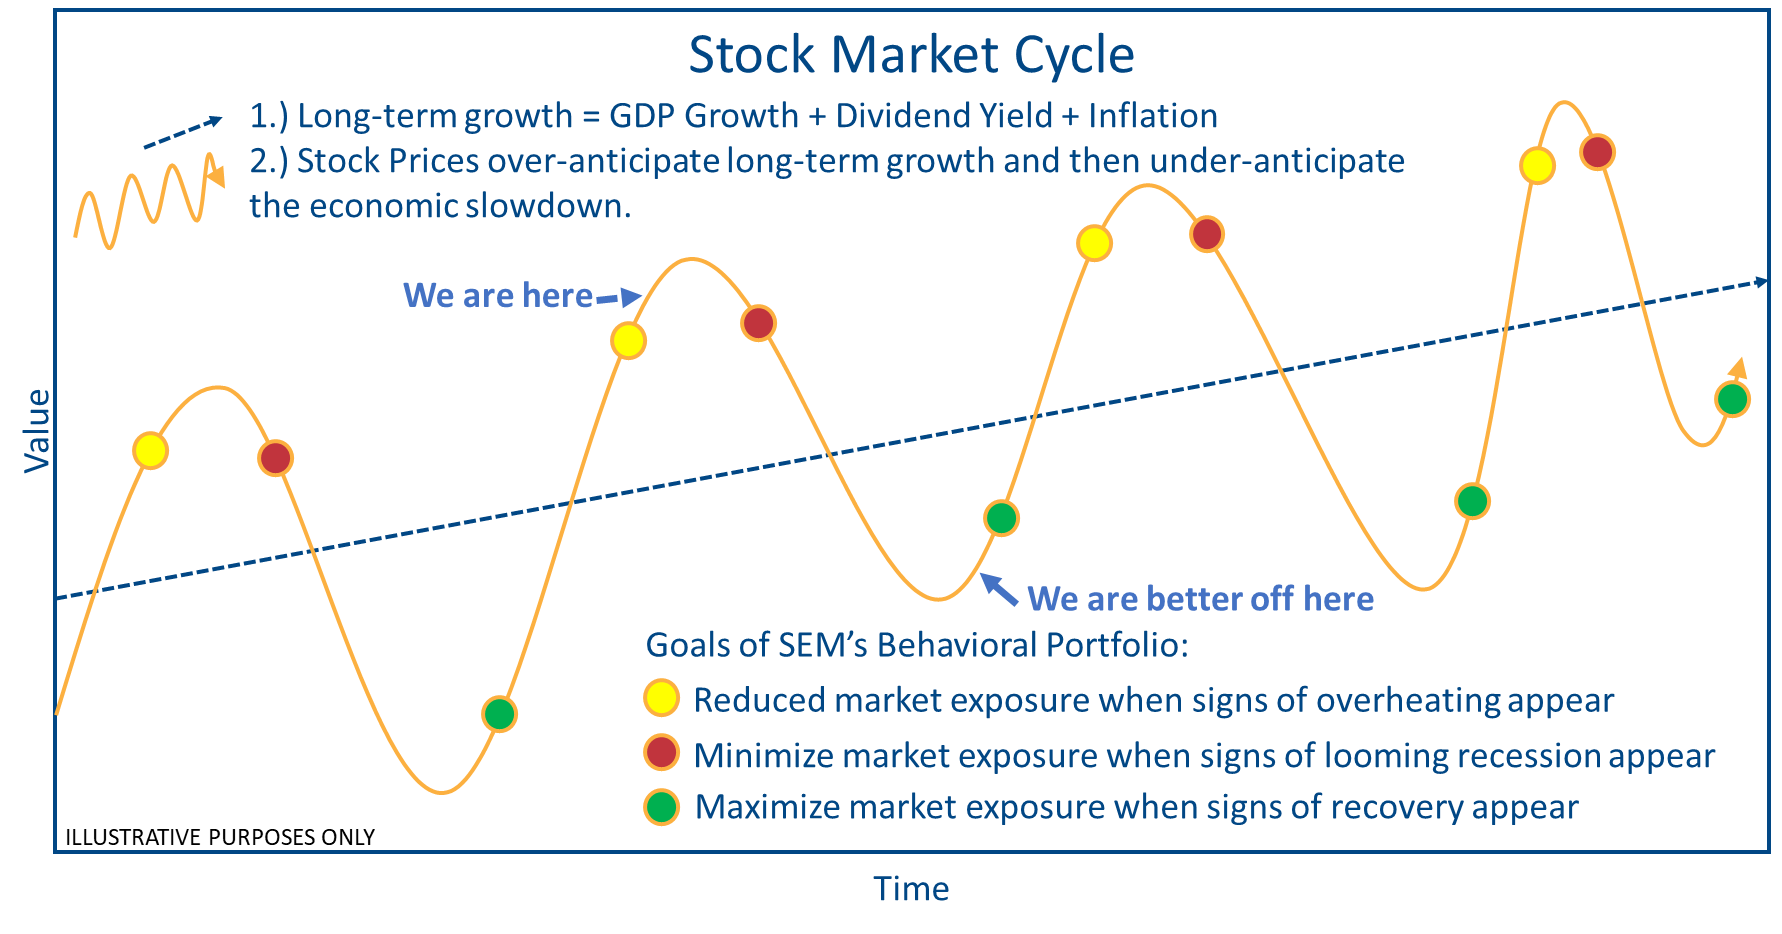
The above "we are here" is based on the overall signals from our 3 investment management styles – tactical, dynamic, and strategic. The improvement in our economic model discussed last week should mean some more upside for stocks.

However, based on historic averages the impressive gains are not sustainable and everyone should be ready for the inevitable "surprise" event which causes the inputs in the valuation formulas to shift to the 'overly pessimistic' levels.
Market Charts
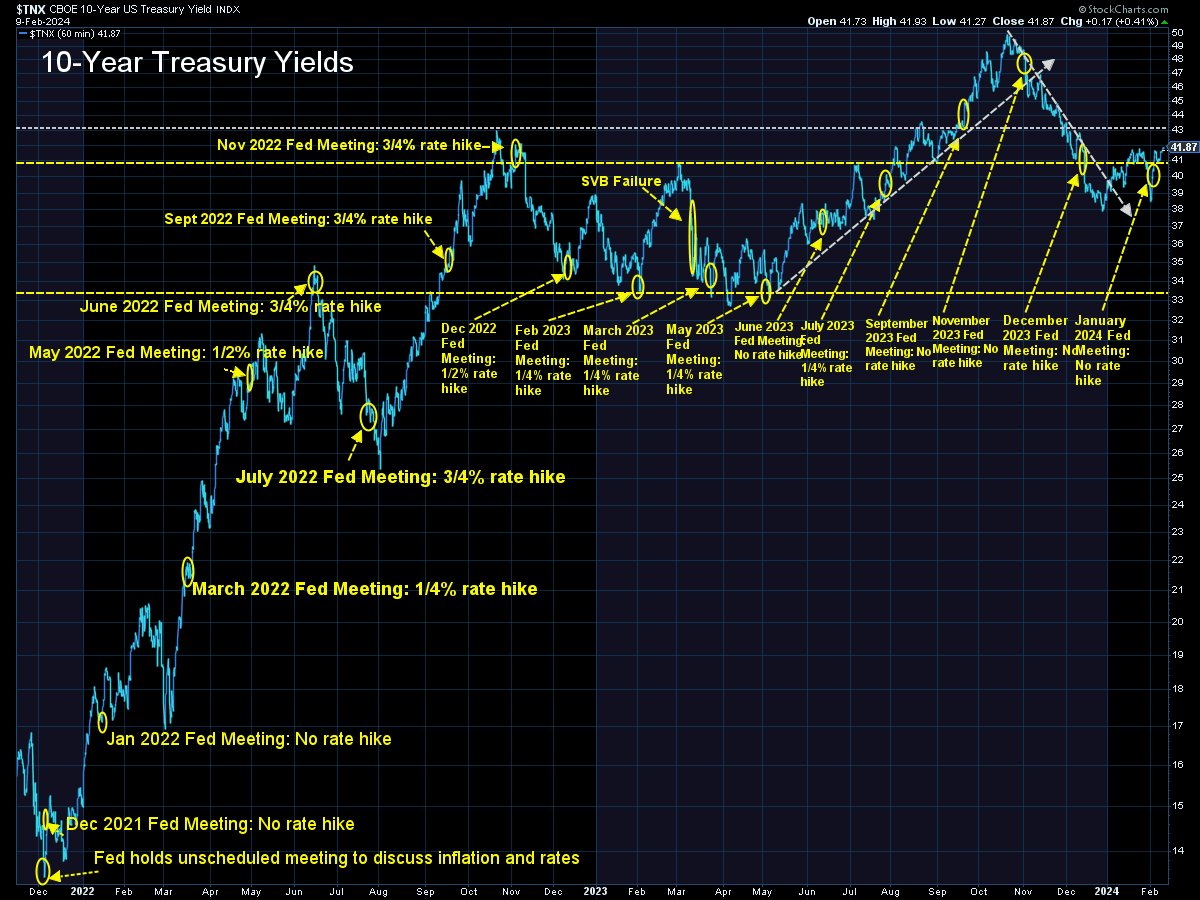
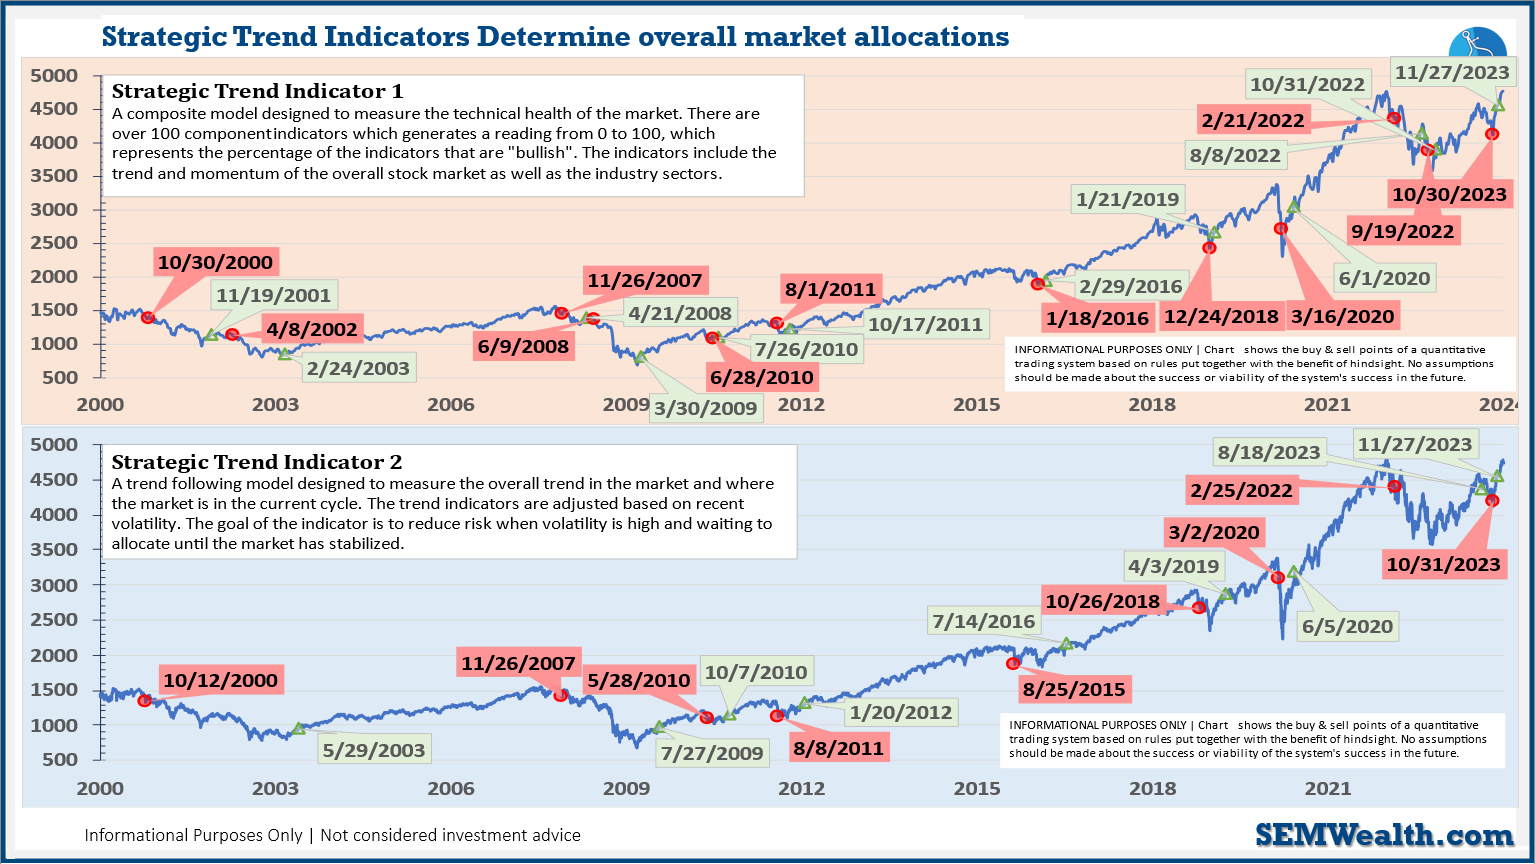
We've been posting this chart every week since early 2022 to highlight the shorter-term trends in the stock market. We included the key Federal Reserve decisions along with a few other events. This helps keep things in perspective. You could summarize the past two plus years like this --
The Fed was behind the curve on inflation and when the announced at the start of 2022 they were going to get serious in their inflation fight the market started adjusting to this new reality. It wasn't until inflation peaked that stocks bottomed. That rally stalled as the economic impact of the rapid rate hikes started hurting the economy and especially the banks. When the Fed decided to once again arrange emergency funding/bailouts when SVB failed, the market took off like a rocket.
When Fed Chair Powell failed to indicate an immediate reversal in interest rates in the summer, stocks again began to sell off. It wasn't until the Fed changed the language of their statement in November and Powell and his merry group of bankers started hinting of possible rate cuts in 2023 that stocks again rocketed higher.
Risk premiums declined, growth estimates increased, and the expectation of lower interest rates caused a spectacular rise. When does it stop? That's anybody's guess. Higher highs tend to bring higher highs – until something changes the sentiment. What will that be? Again, that is anybody's guess.
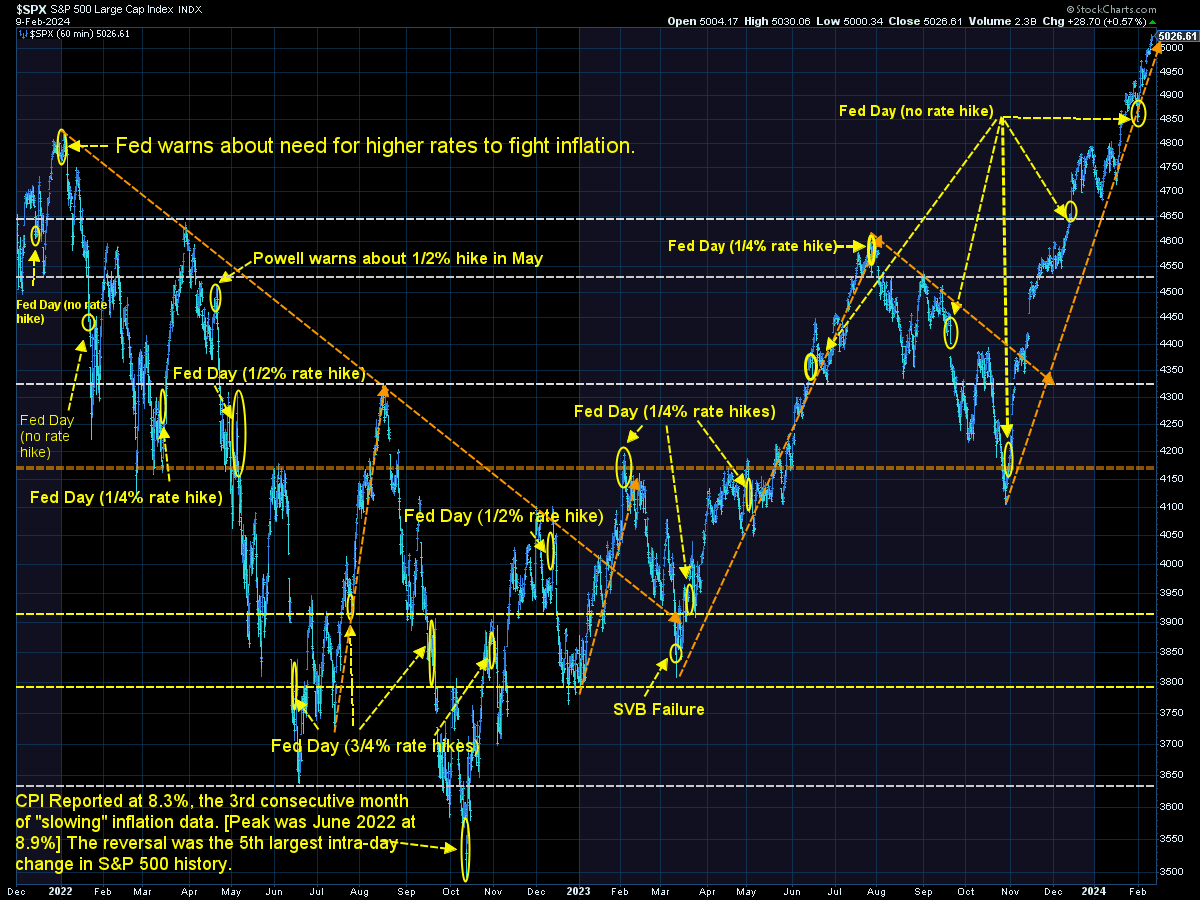
Interest rates are likely to be the thing that could derail the rally so should be something we watch. Problems with commercial real estate have hit some regional banks and there are rumors the Fed may cut rates and arrange other special stimulus to save other banks from suffering. For now rates are still stable.
SEM Model Positioning
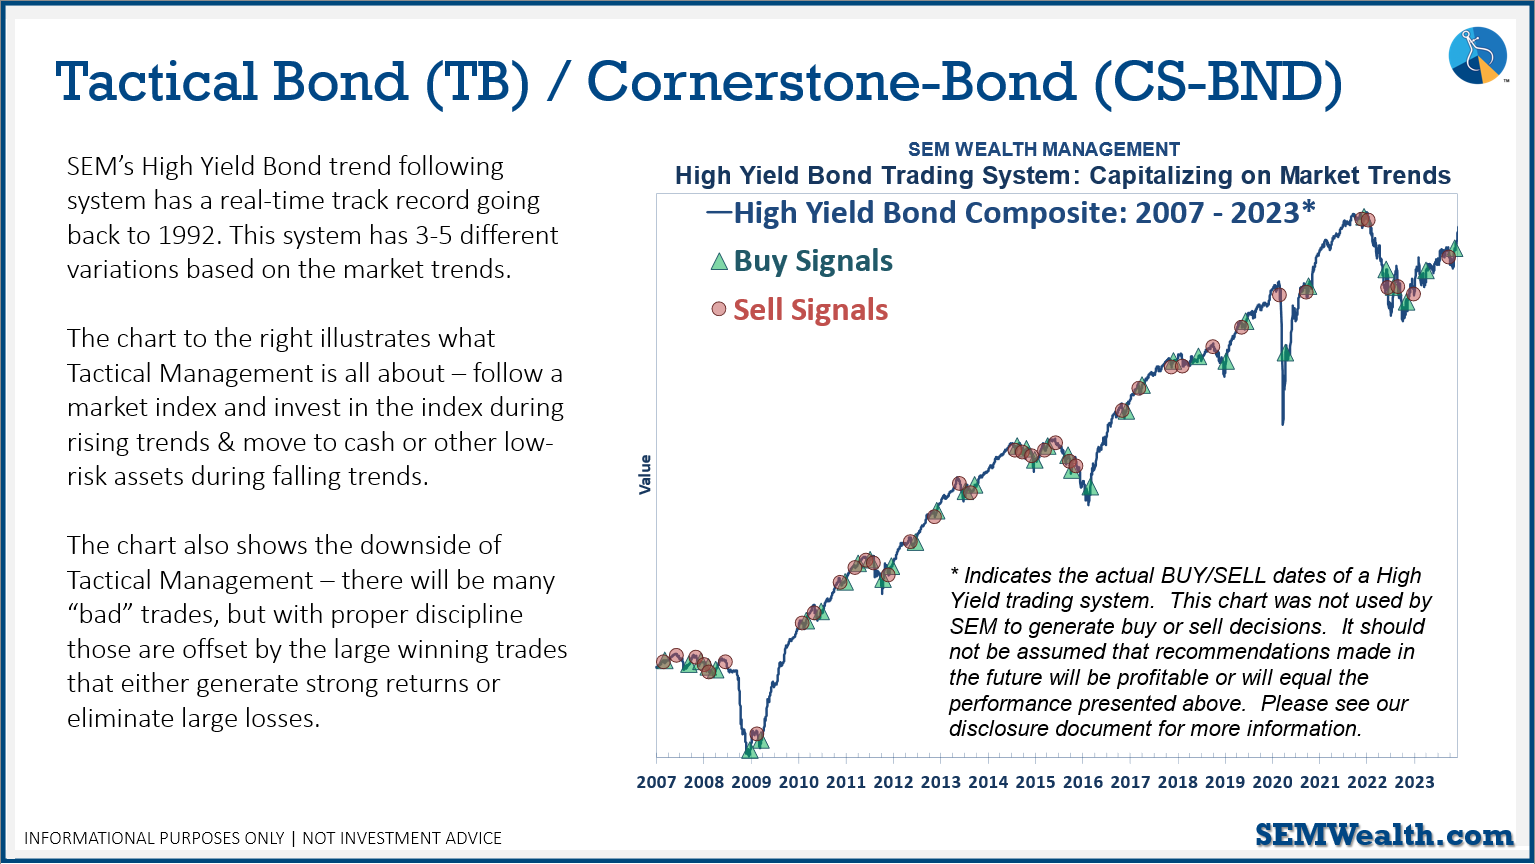
-Tactical High Yield went on a buy 11/3/2023
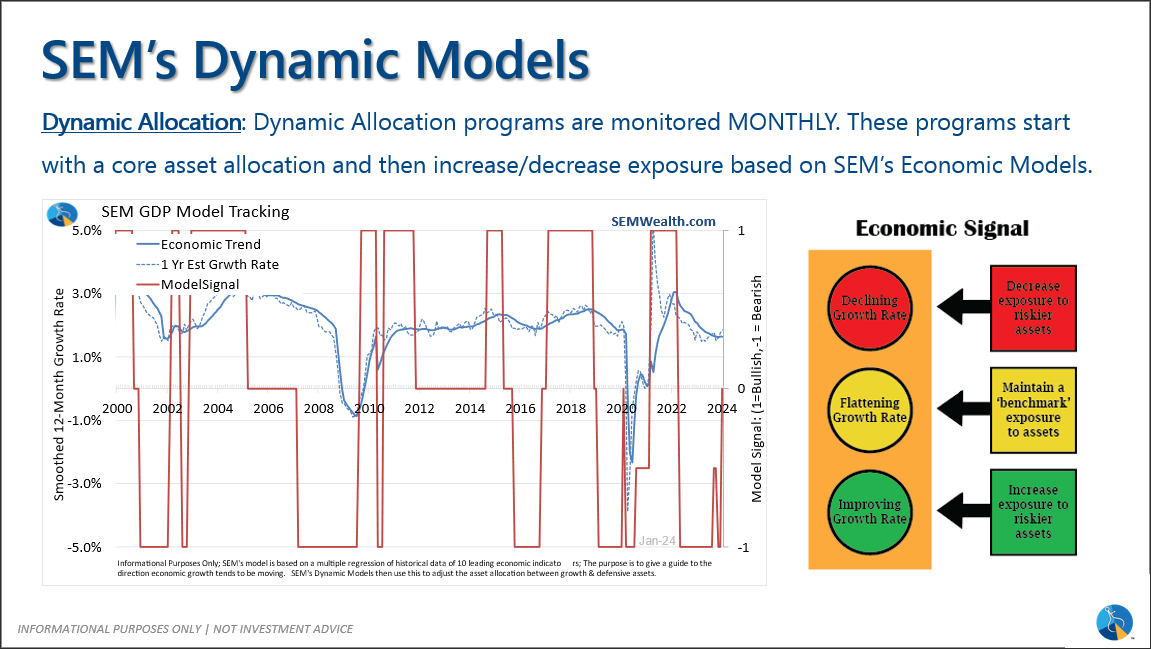
-Dynamic Models went to 'neutral' 2/5/2024
-Strategic Trend Models went on a buy 11/27/2023
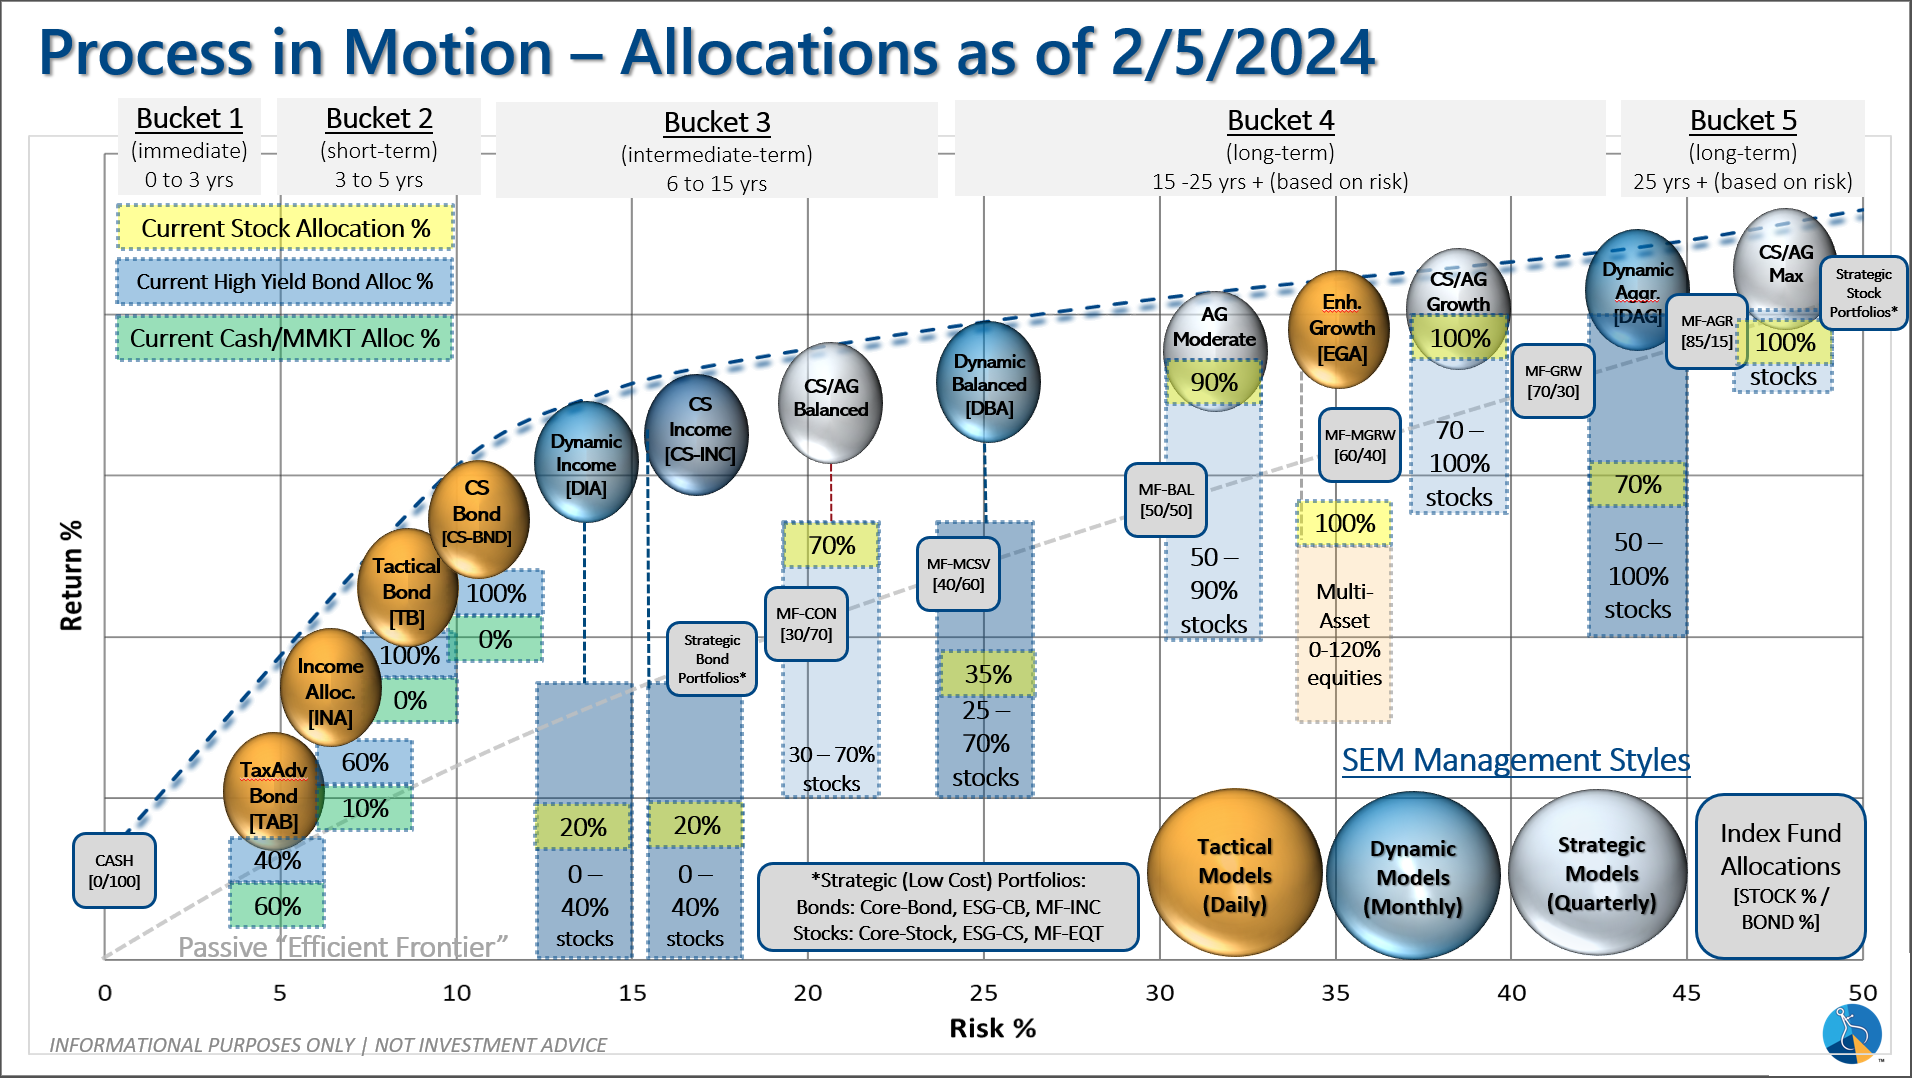
SEM deploys 3 distinct approaches – Tactical, Dynamic, and Strategic. These systems have been described as 'daily, monthly, quarterly' given how often they may make adjustments. Here is where they each stand.
Tactical (daily): The High Yield Bond system bought the beginning of April and issued all 3 sell signals 9/28/2023. All 3 systems were back on buy signals by the close on 11/3/2023. The bond funds we are invested in are a bit more 'conservative' than the overall index, but still yielding between 7.5 -8.5% annually.
Dynamic (monthly): At the beginning of December the economic model reverted back to "bearish". This was reversed at the beginning of February. This means benchmark positions – 20% dividend stocks in Dynamic Income and 20% small cap stocks in Dynamic Aggressive Growth.
Strategic (quarterly)*:
BOTH Trend Systems reversed back to a buy on 11/27/2023
The core rotation is adjusted quarterly. On August 17 it rotated out of mid-cap growth and into small cap value. It also sold some large cap value to buy some large cap blend and growth. The large cap purchases were in actively managed funds with more diversification than the S&P 500 (banking on the market broadening out beyond the top 5-10 stocks.) On January 8 it rotated completely out of small cap value and mid-cap growth to purchase another broad (more diversified) large cap blend fund along with a Dividend Growth fund.
The * in quarterly is for the trend models. These models are watched daily but they trade infrequently based on readings of where each believe we are in the cycle. The trend systems can be susceptible to "whipsaws" as we saw with the recent sell and buy signals at the end of October and November. The goal of the systems is to miss major downturns in the market. Risks are high when the market has been stampeding higher as it has for most of 2023. This means sometimes selling too soon. As we saw with the recent trade, the systems can quickly reverse if they are wrong.
Overall, this is how our various models stack up based on the last allocation change: