We've said it many times – when the Federal Reserve has spent too much time focusing on bailing out the stock market anytime there is a 5% drop in stocks, sometimes the market does not react like you think it would.
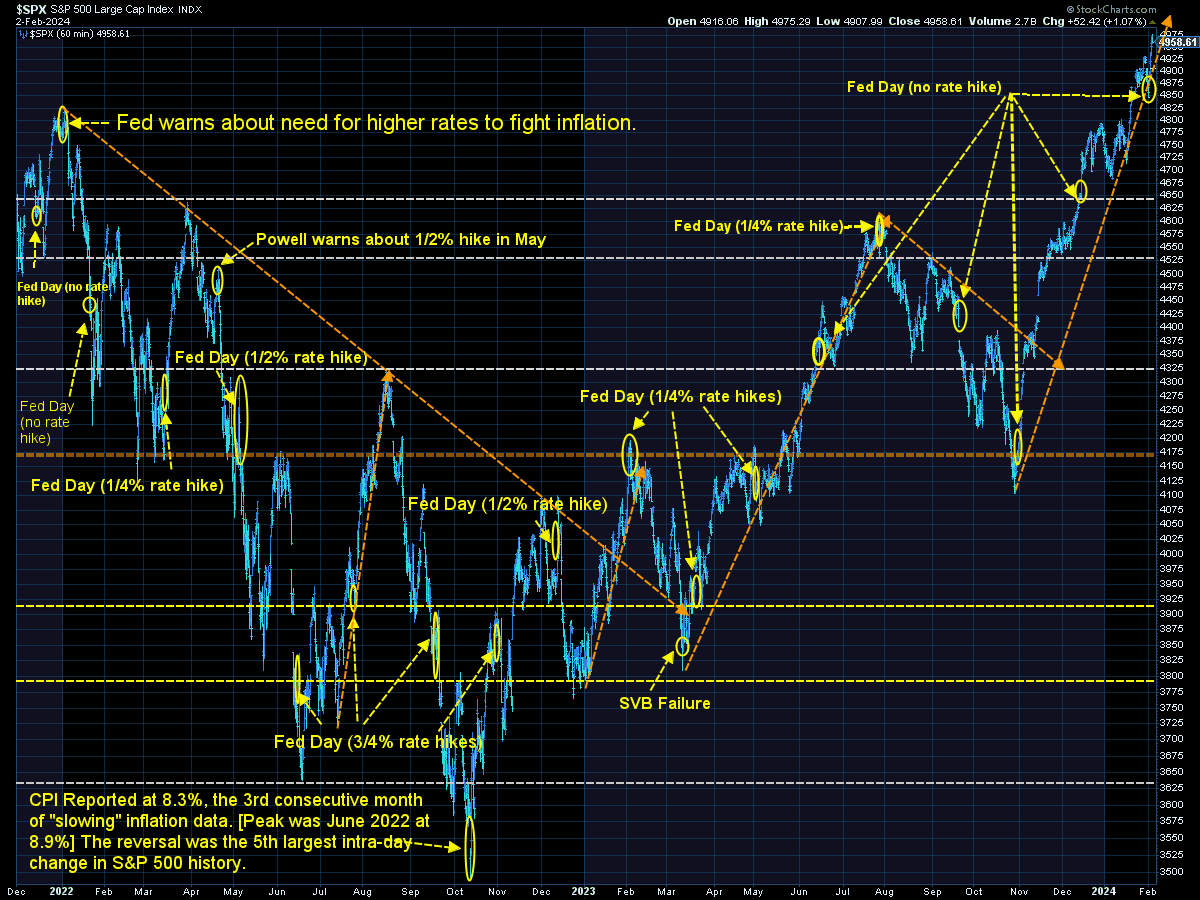
During the 4th quarter of last year, stocks staged a strong rally as market participants priced in 5-6 Fed rate cuts totaling 1.5% as the Fed shifted to hinting that not only were they done raising rates, but could start cutting rates in 2024. Fed Chair Jerome Powell briefly threw cold water on that assumption last week during his press conference causing a one day decline, but (some) stocks came roaring back the last two days of the week to close at another all-time high for the S&P 500.
As we've said for the past few weeks in the 'Market Charts' segment of the Musings, record highs tend to bring on more record highs – until something fundamentally changes the outlook. Could it be a strong economy could be the very thing that dashes the hopes of the bulls?
On Friday we closed out SEM's Economic Model month with a much stronger than expected jobs report.
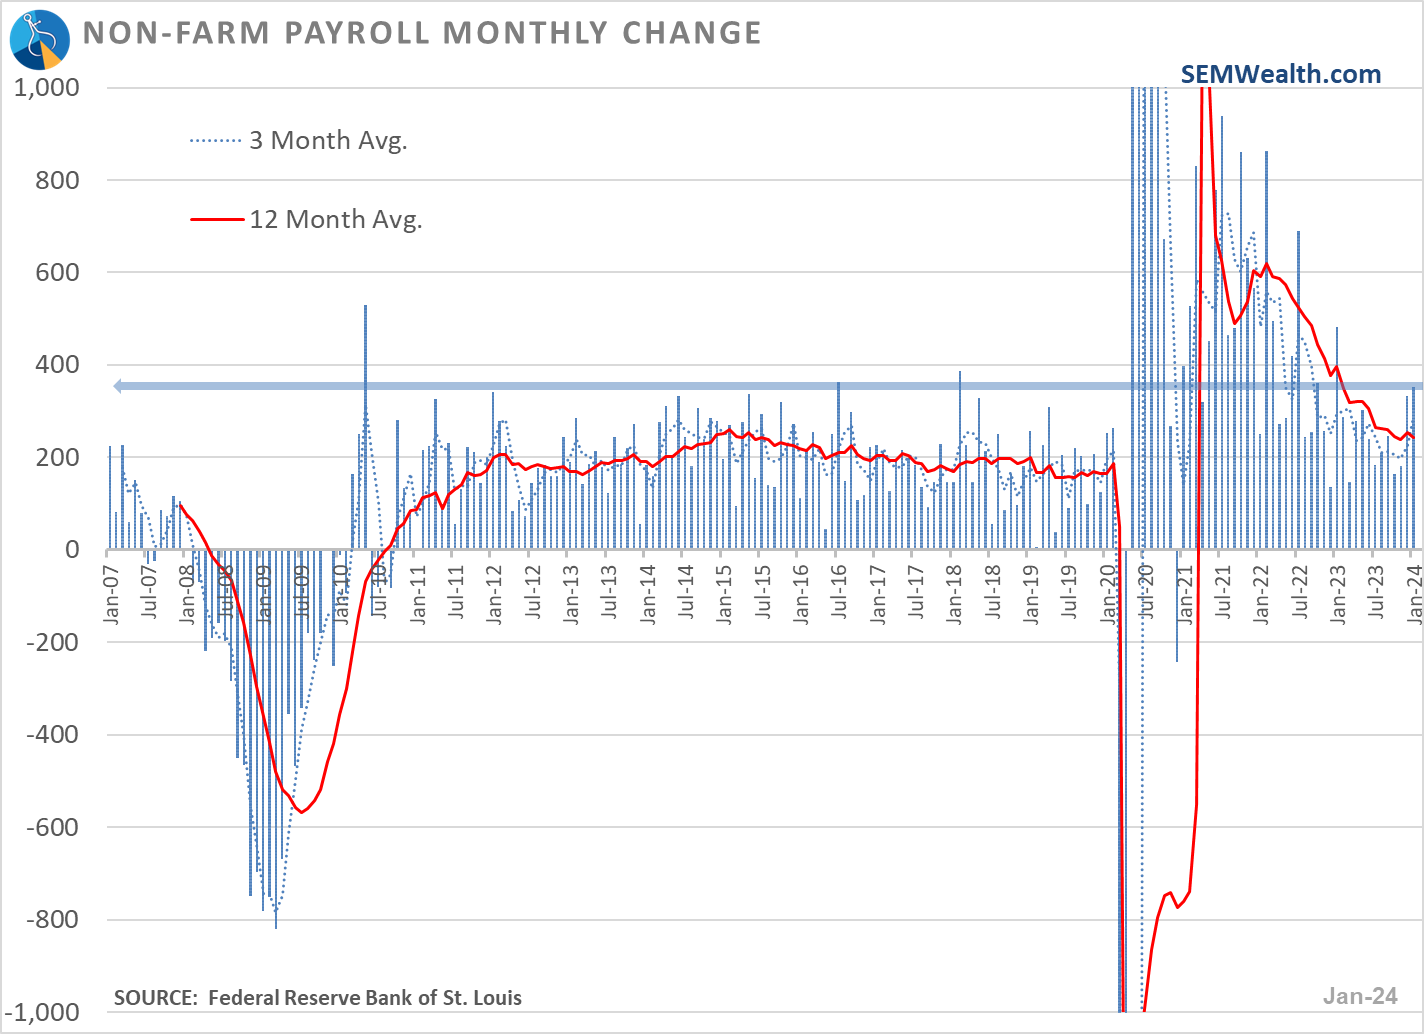
The pace of increase in the number of jobs continues to run at an impressive clip.
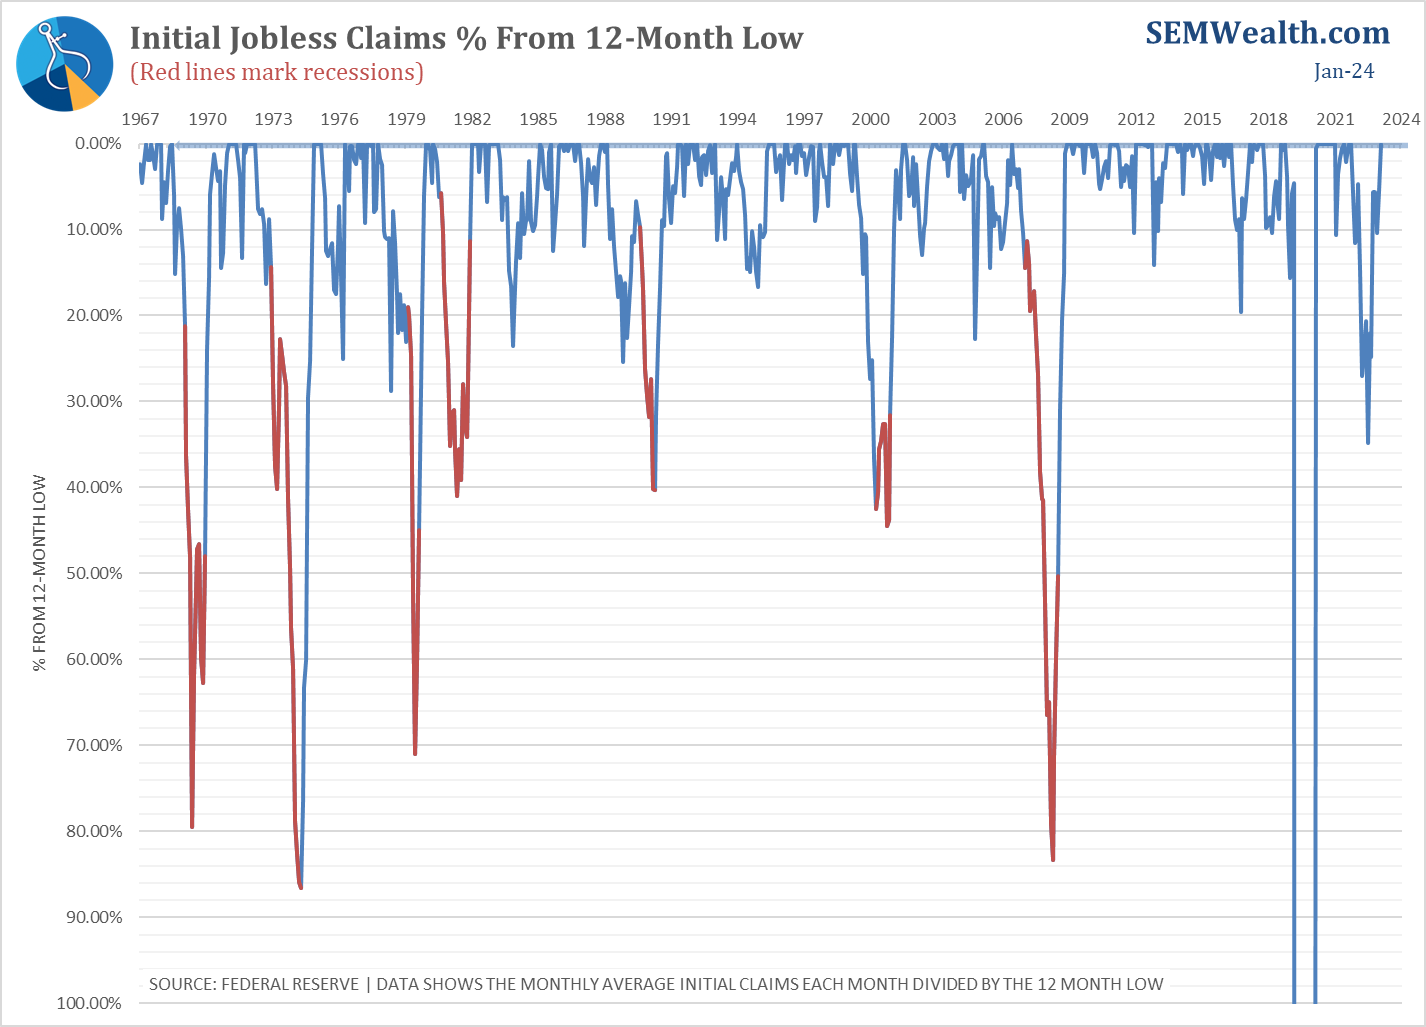
This strength was first picked up in the decline in Initial Jobless Claims – this chart shows the % from the low (worst 12 month reading).
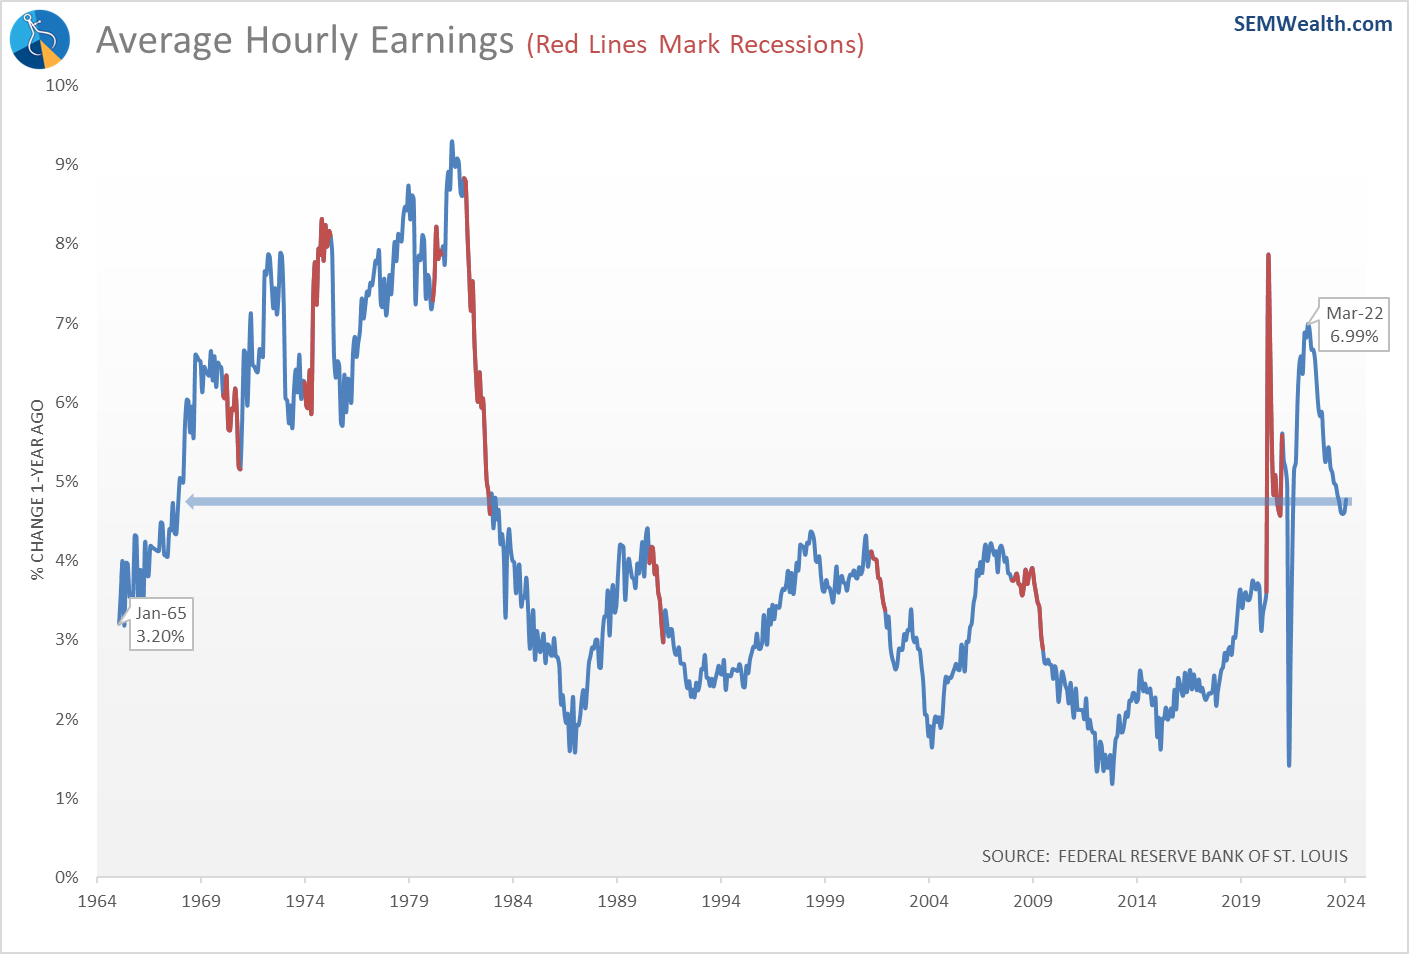
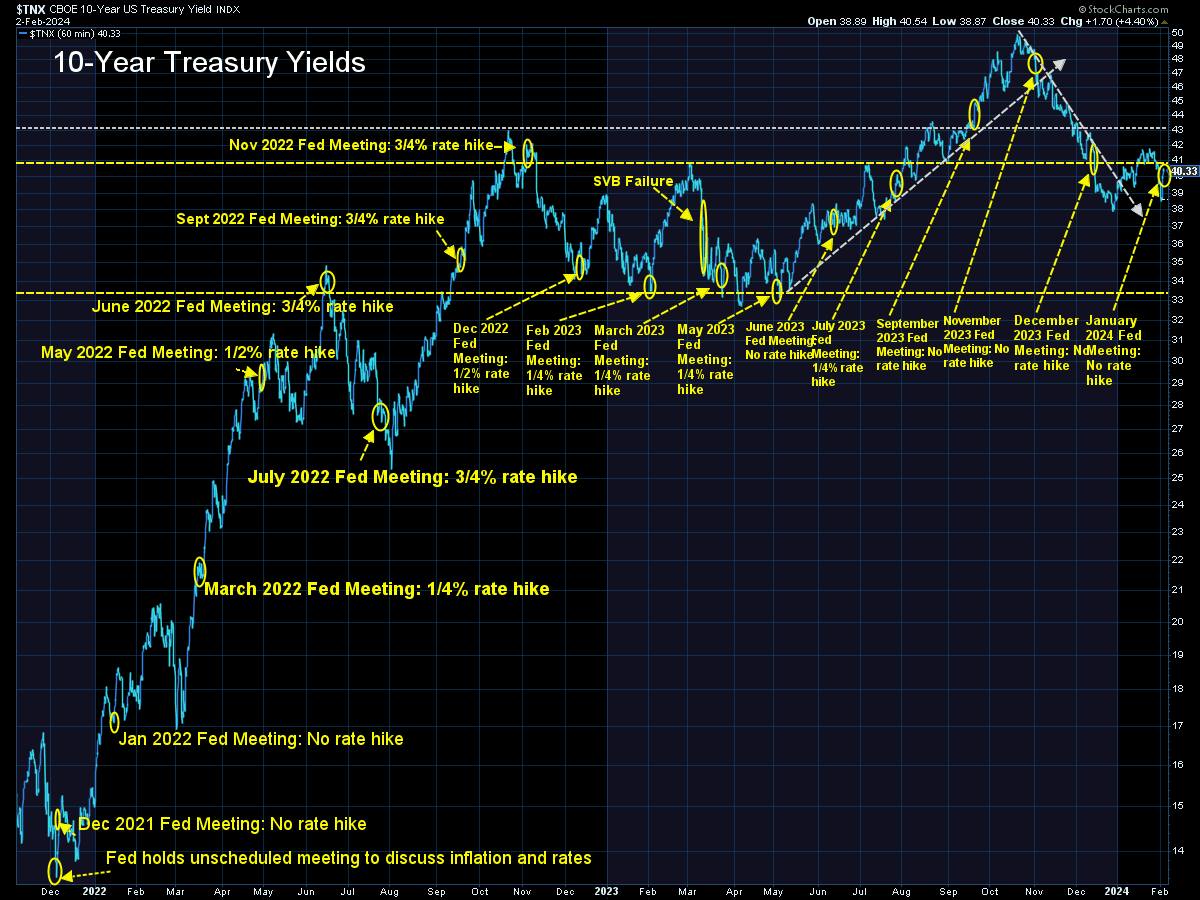
A labor market that is again heating up can cause inflation to increase, which could be a problem for the Fed and those betting on 5-6 rate cuts to stimulate growth. If you look closely at the chart below you can see the growth in earnings reverse the 15 month downtrend in wage growth. The bond market on Friday certainly picked up on this, sending rates on the 10-year Treasury up 0.17% to close the week back above the psychologically important 4% level.
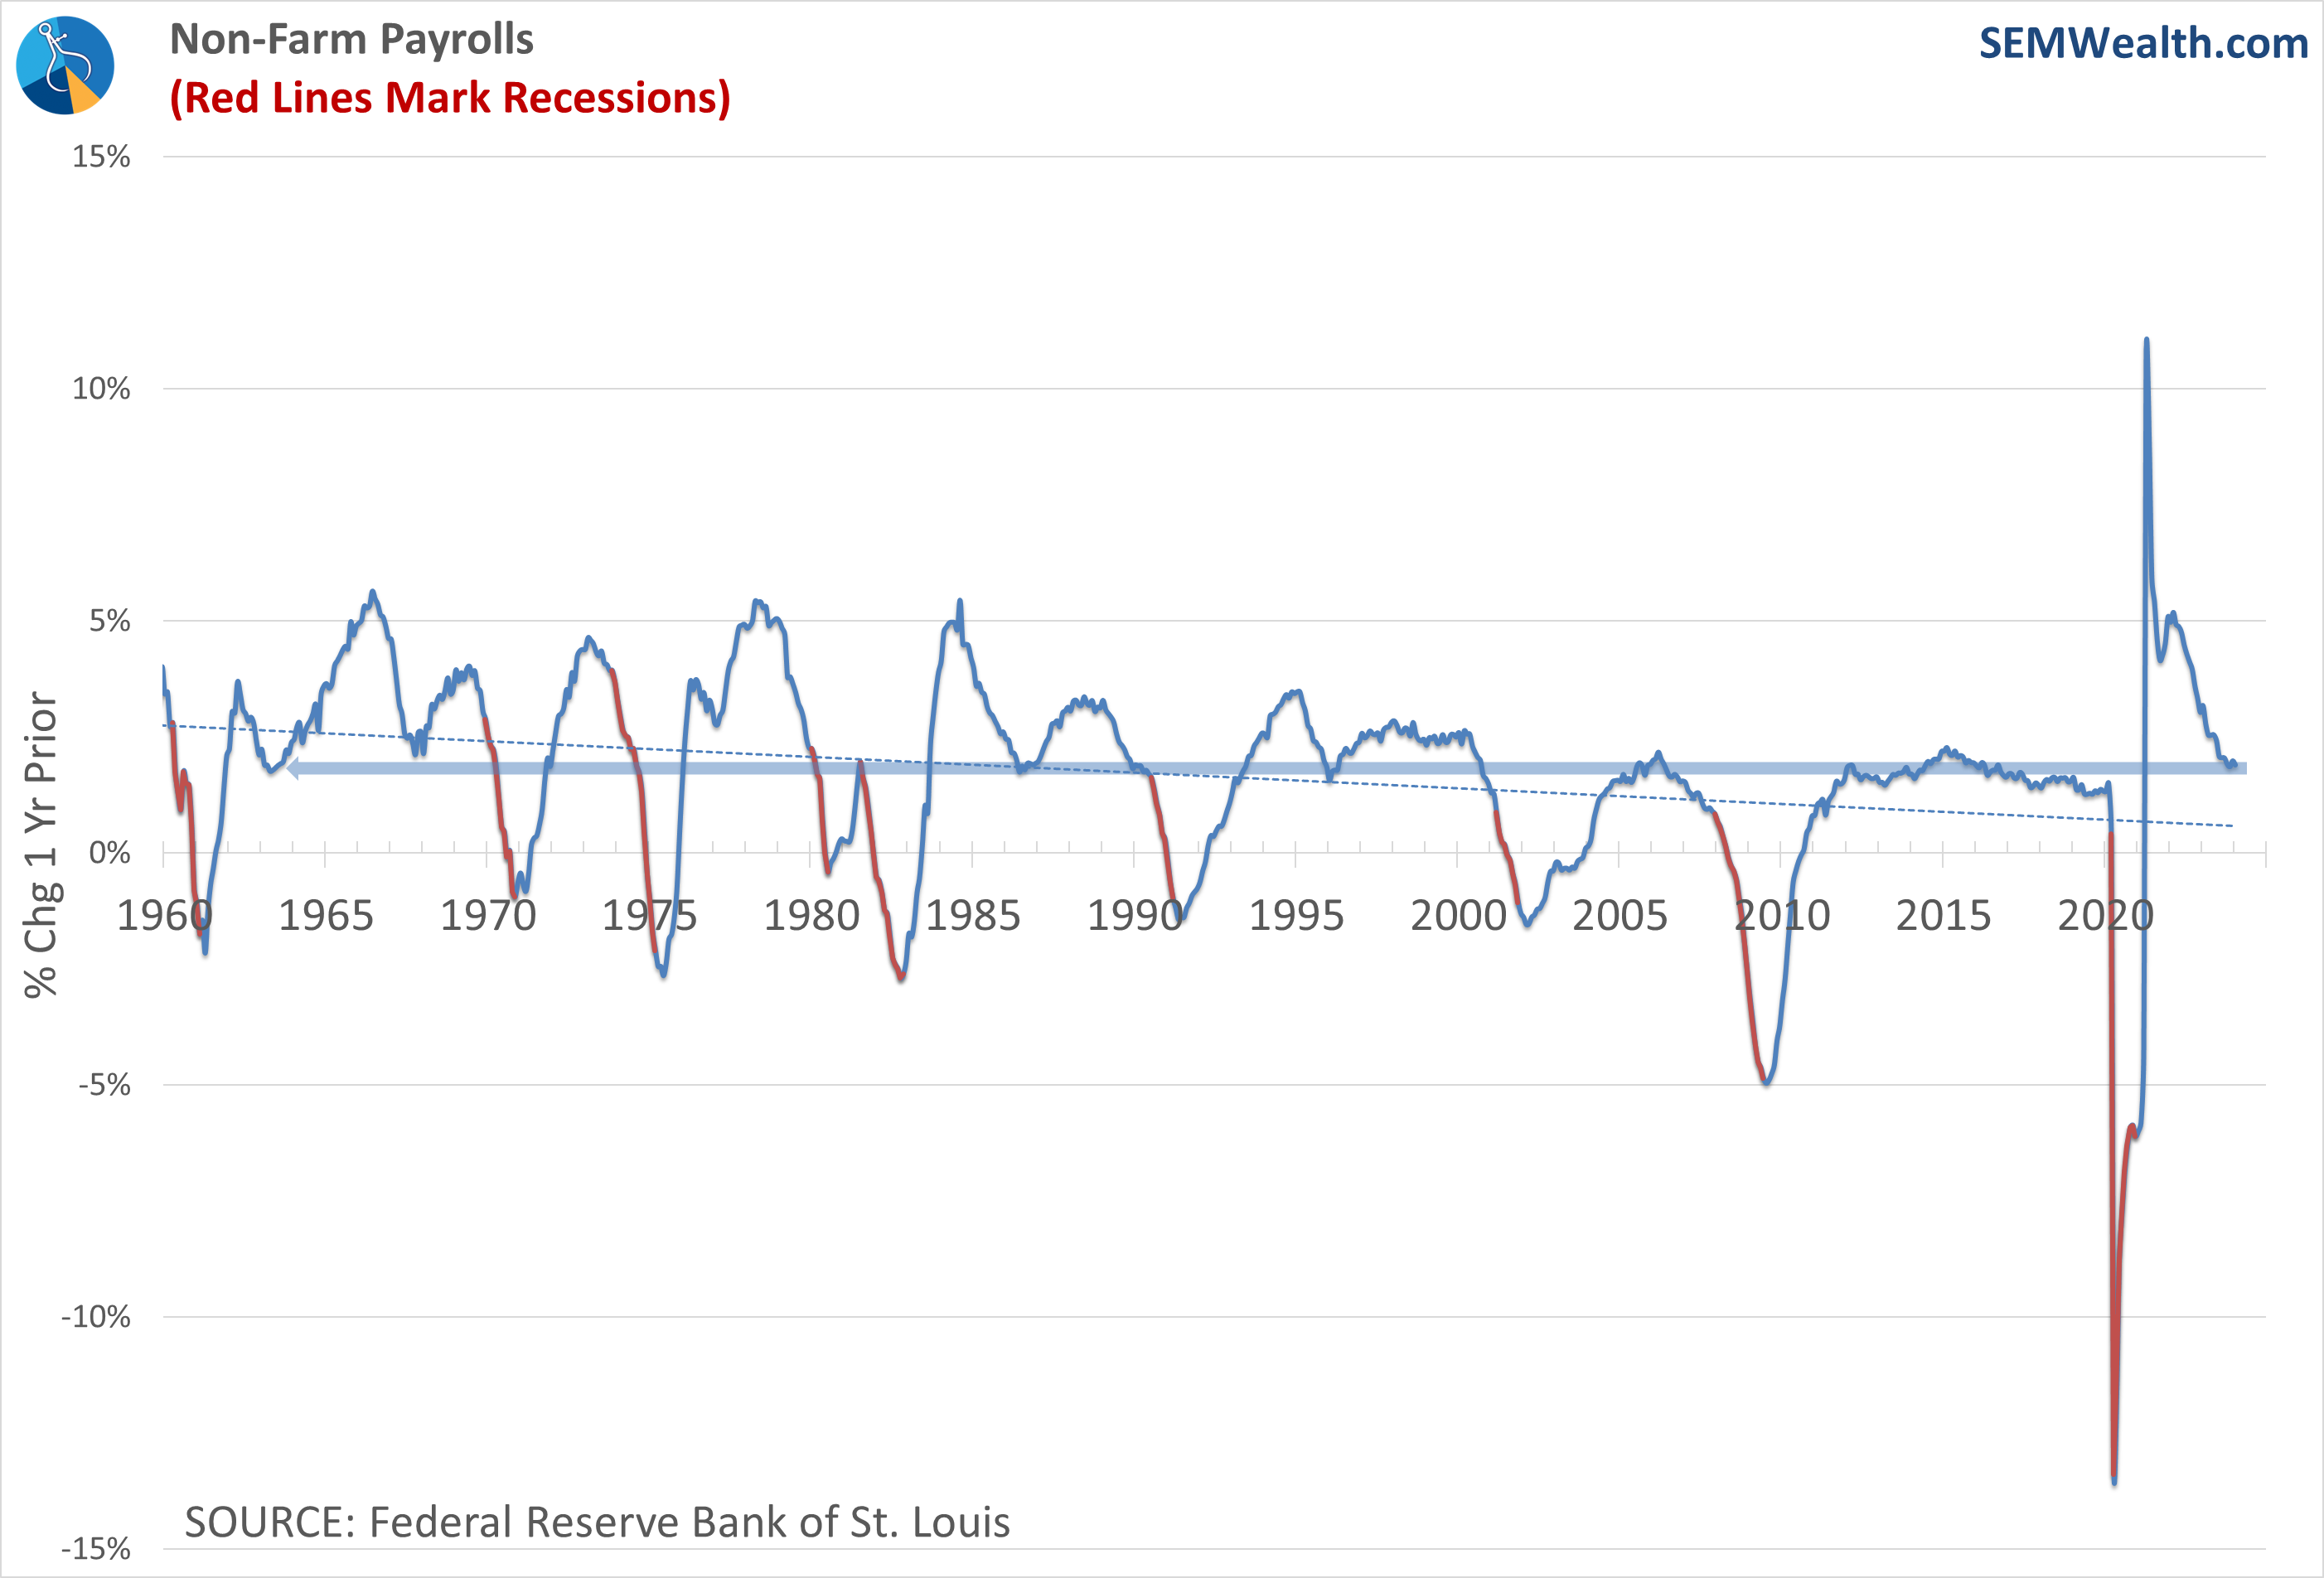
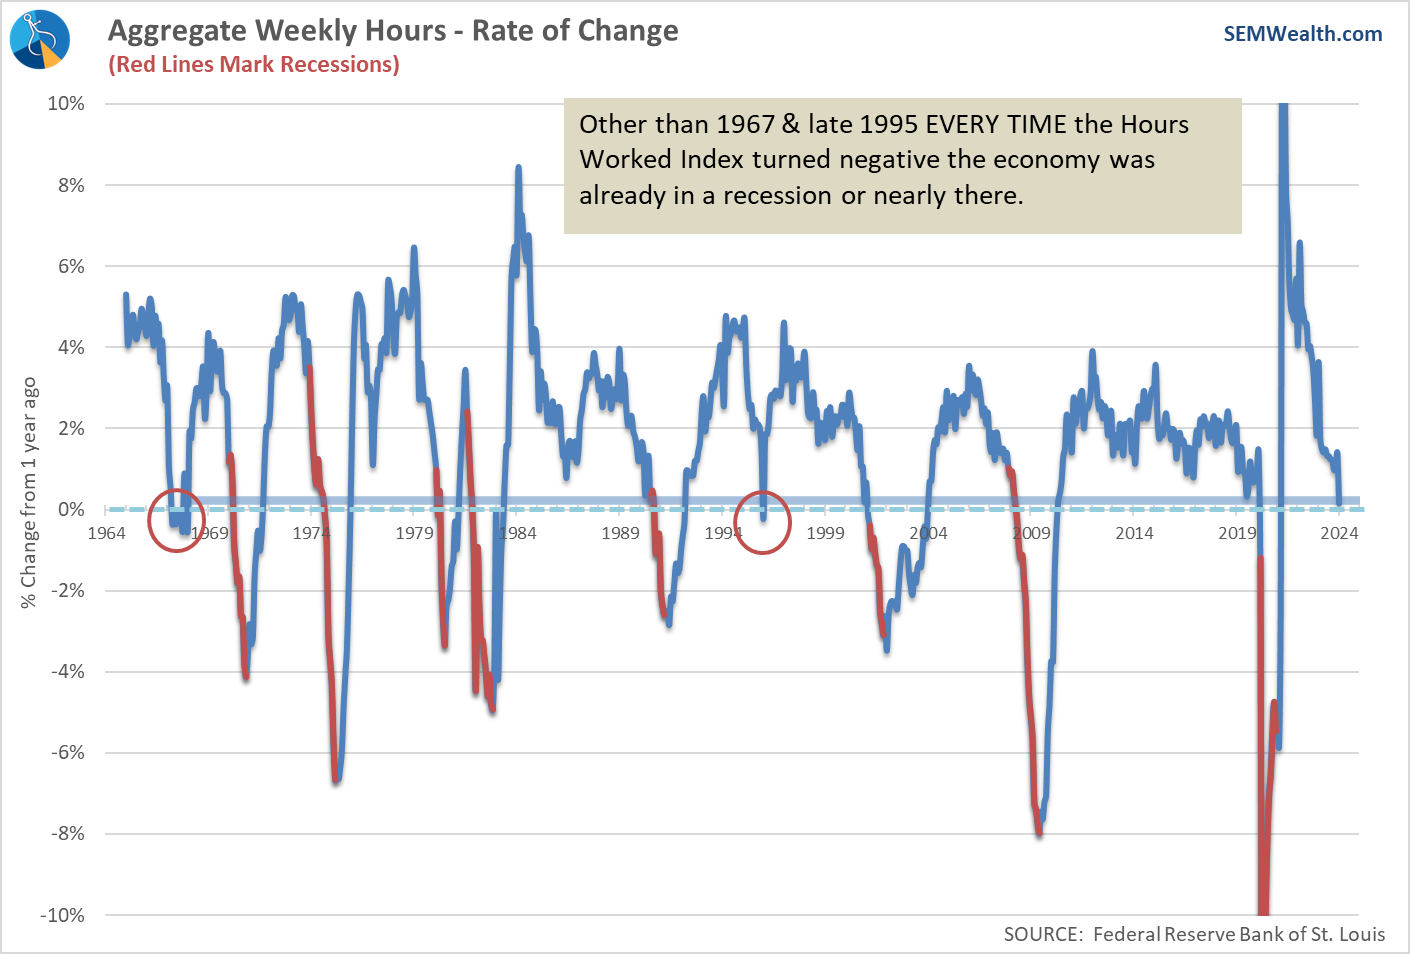
About the only negative sign for the economy was a sharp decline in the average work week in January. Economists blamed the weather on this one, but we will be watching this closely as it is the single best leading economic indicator. Note there have only been two false signals since 1964 where a negative 12-month change did not signal a recession.
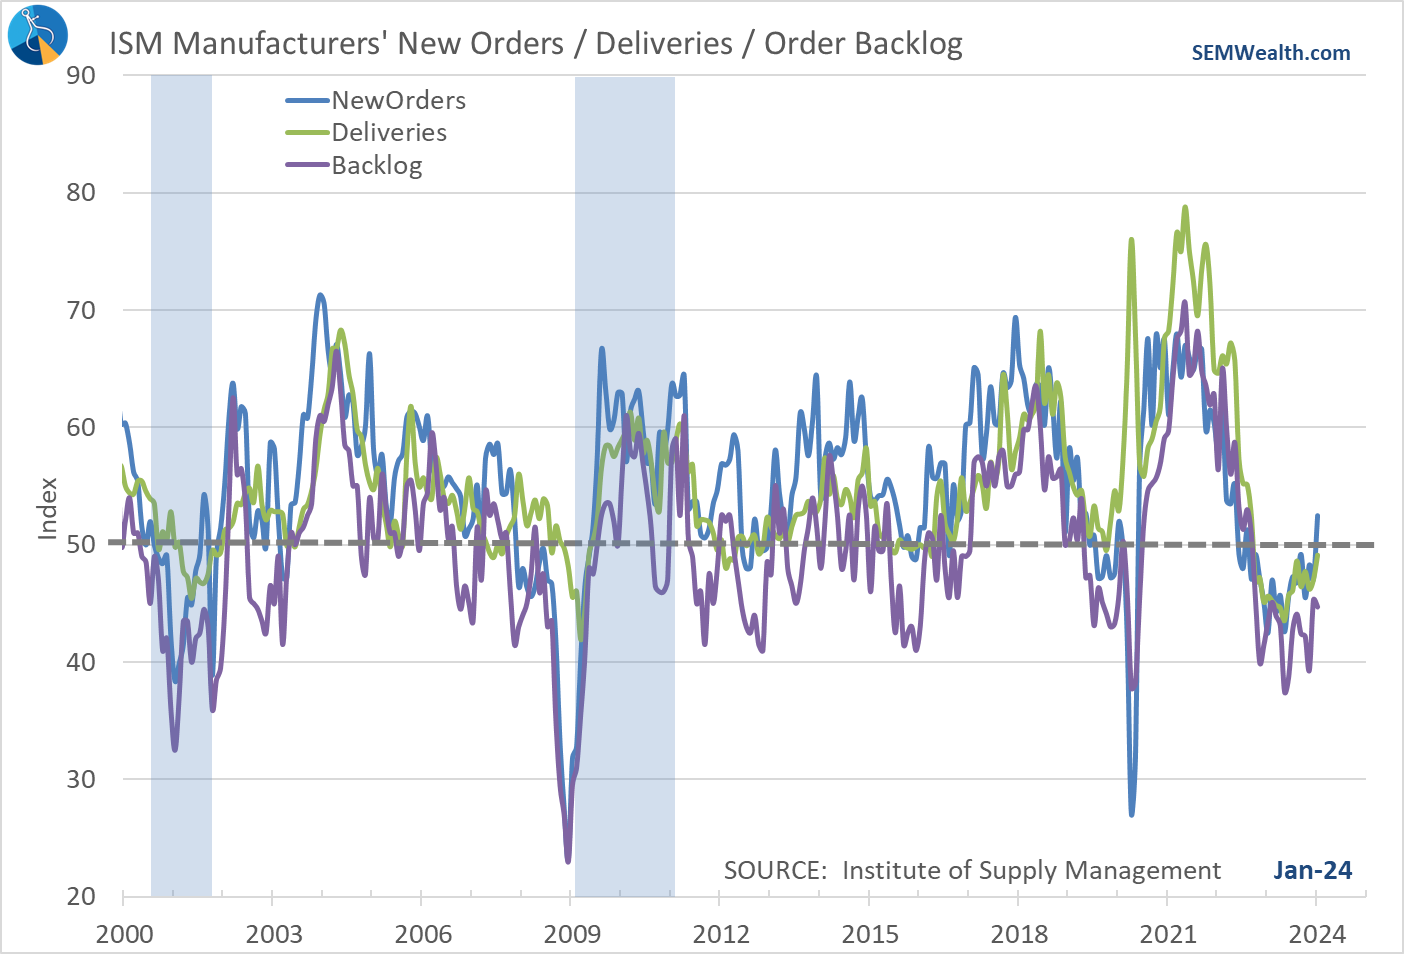
Manufacturing activity also came roaring back in January. The overall index is back within a whisker of signaling an 'expansion'. The underlying leading components also are showing marked signs of improvement, with the New Orders index climbing solidly back into 'expansion' territory.
Looking at our overall dashboard this is a big improvement over what we saw just 3 months back.
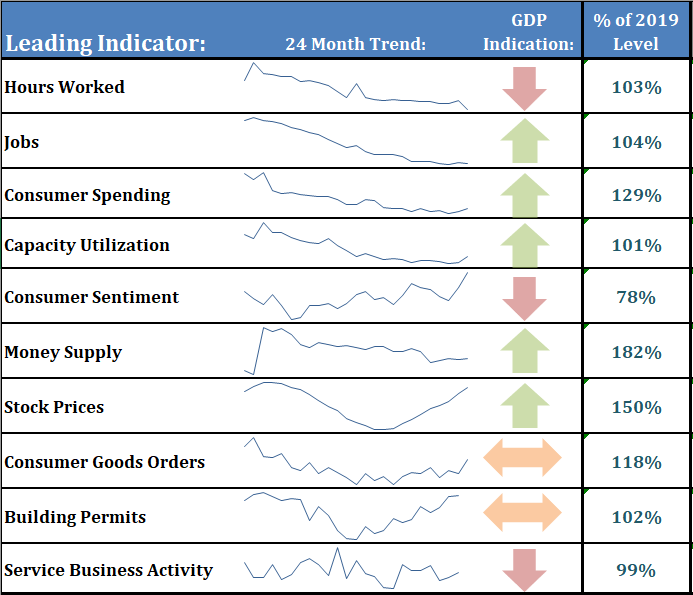
We titled last month's economic update, "back to normal" as most of the leading indicators had climbed above their pre-COVID levels.

Here's an update to that scorecard:
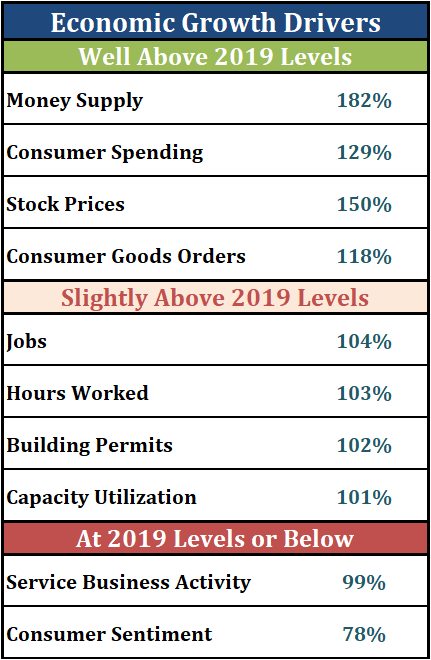
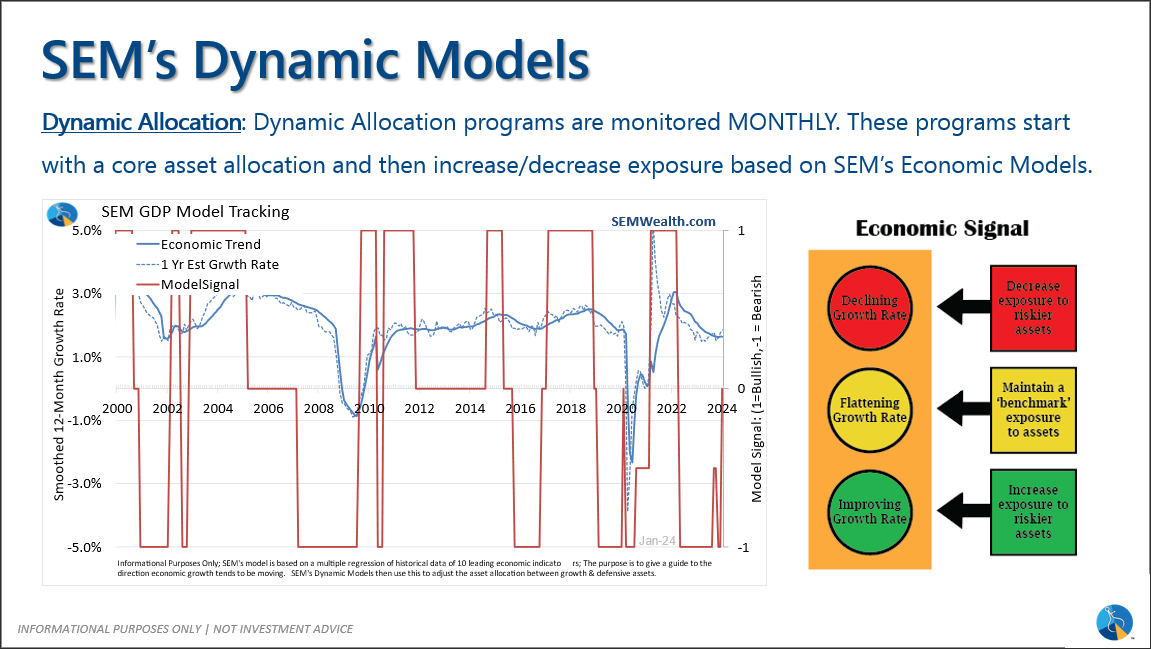
SEM's economic model also reverted to 'normal' or in our terminology 'neutral' with the January data. When we are in this state it is neither bullish or bearish, but simply average.
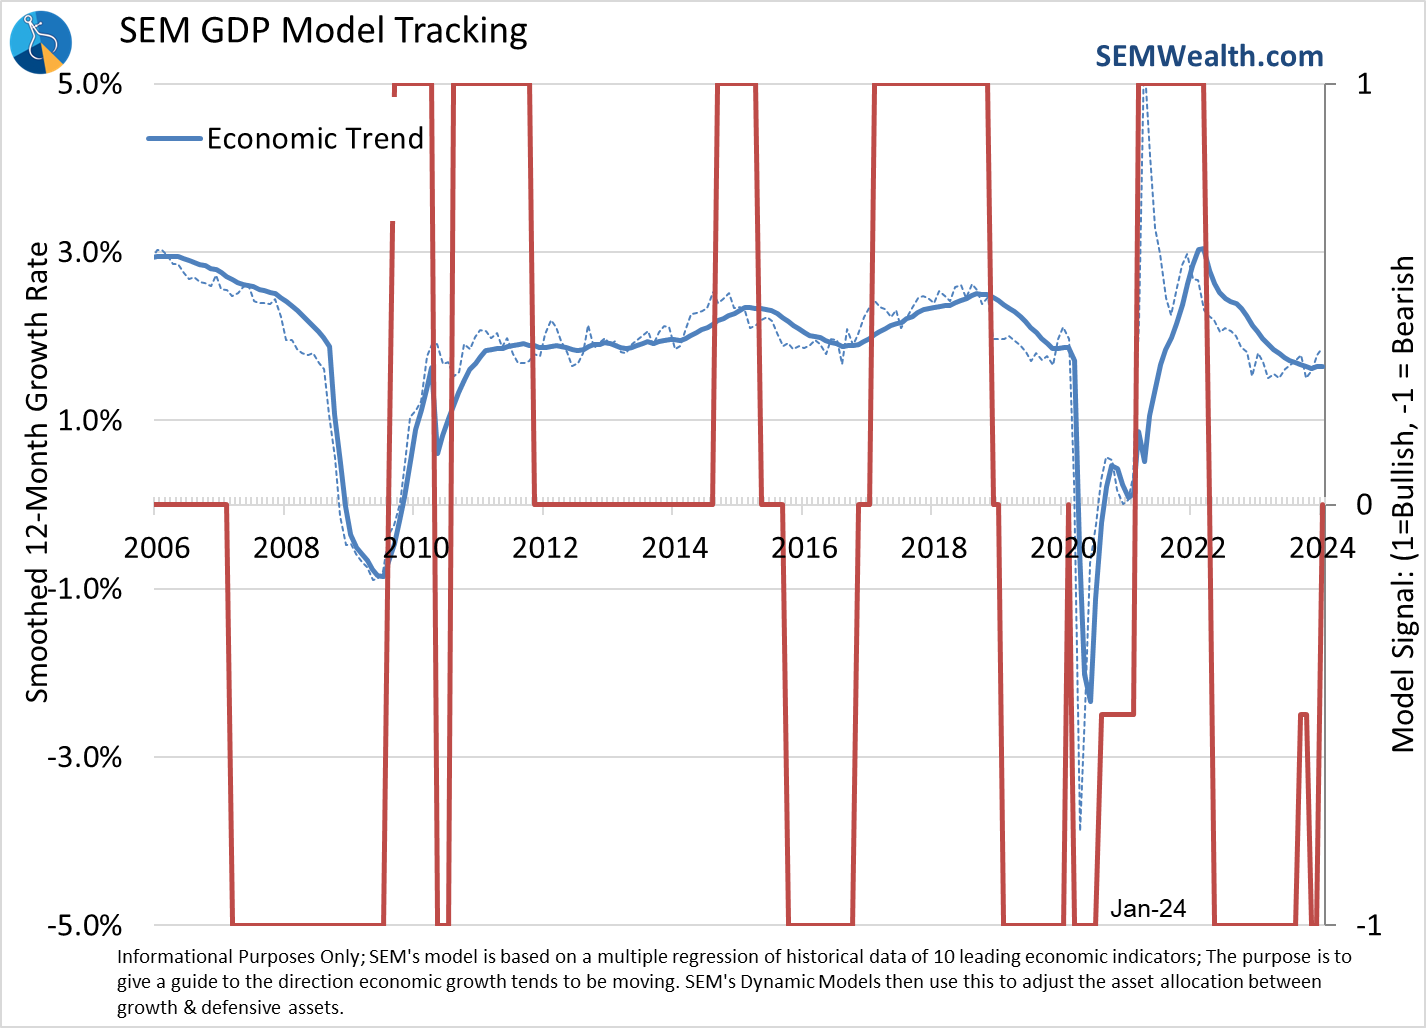
This means we will be moving our Dynamic models to 'benchmark' allocations. For Dynamic Income we will be adding 20% to Dividend Stocks (from Treasury Bonds). For Dynamic Aggressive 20% will be added to small cap stocks (from some of our bond holdings).
Small caps were beat up this week, which does not align with what you think would happen if the economy was strengthening (or at least performing better than expected). This is most likely due to problems at some regional banks. The big jump in rates on Friday did nothing to alleviate those concerns.
This also doesn't help the concerns I raised last week. If rates stay high, consumers will continue to be stressed.

Could it be the economy is 'too strong' which ironically could hurt smaller companies and eventually the economy overall because it means the Fed will not be slashing interest rates? Time will tell.
As I've said many times – I would not want to be the Fed Chair.
Market Charts
New highs breed new highs until something fundamental changes. This is both encouraging for those hoping for strong returns in their stock portfolios, but it is also worrisome because it does not take much to dampen the animal spirits.
I keep highlighting how weak stocks are beneath the surface. This can be shown when comparing the S&P 500 to the equally weighted S&P and the small cap Russell 2000 index.
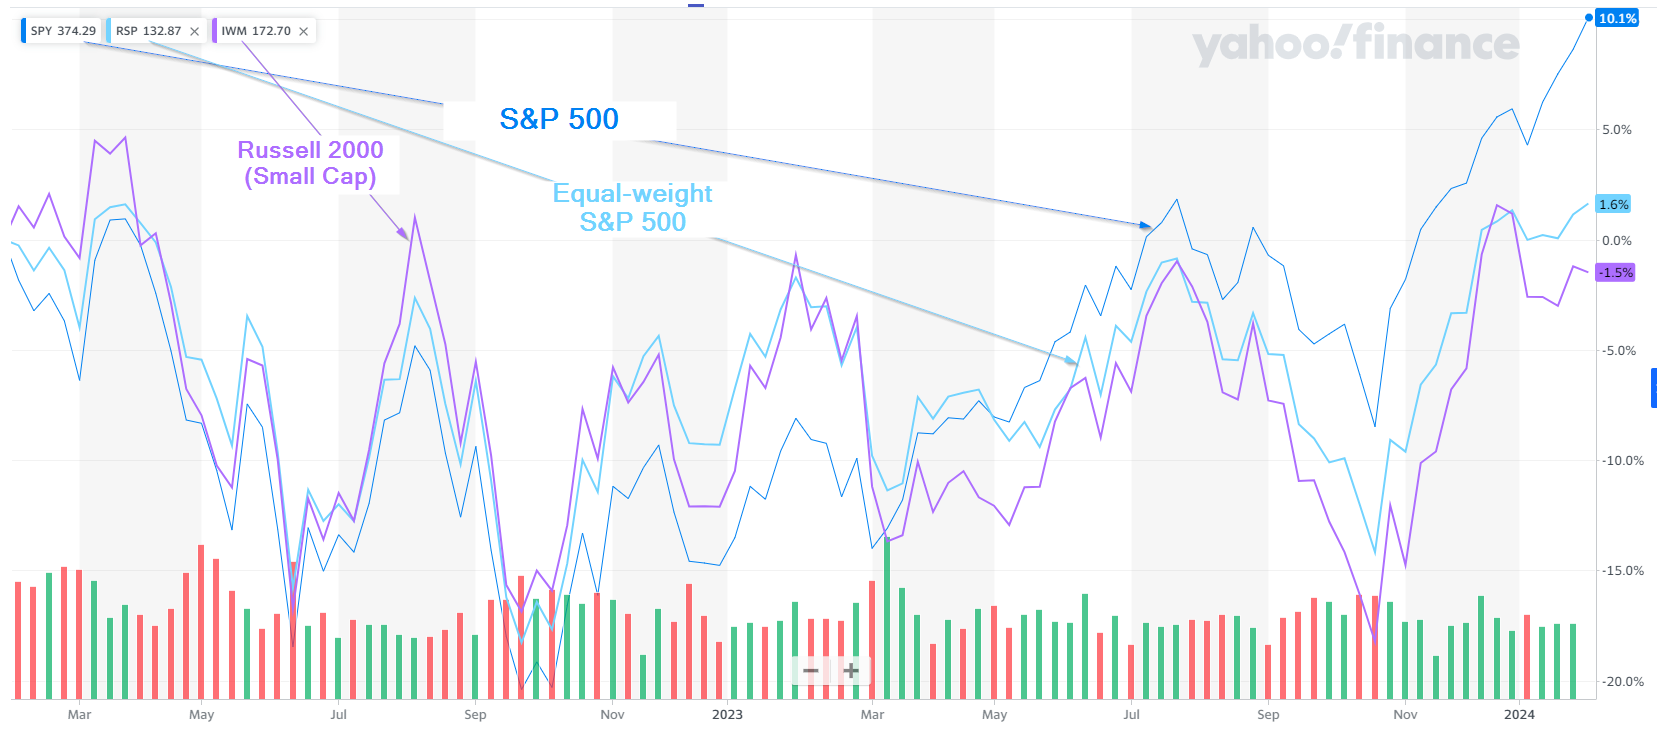
Most of the time when this happens the 'average stock' will either play catch-up or the larger stocks will play catch-down.
Turning to bonds, despite Friday's (over?) reaction to the stronger than expected jobs report, the action in interest rates last week was encouraging. Rates still ended the week lower. We'll be watching to see if bonds or stocks reverse their move from Thursday and Friday as one of them is probably wrong about the near-term outlook.
SEM Model Positioning
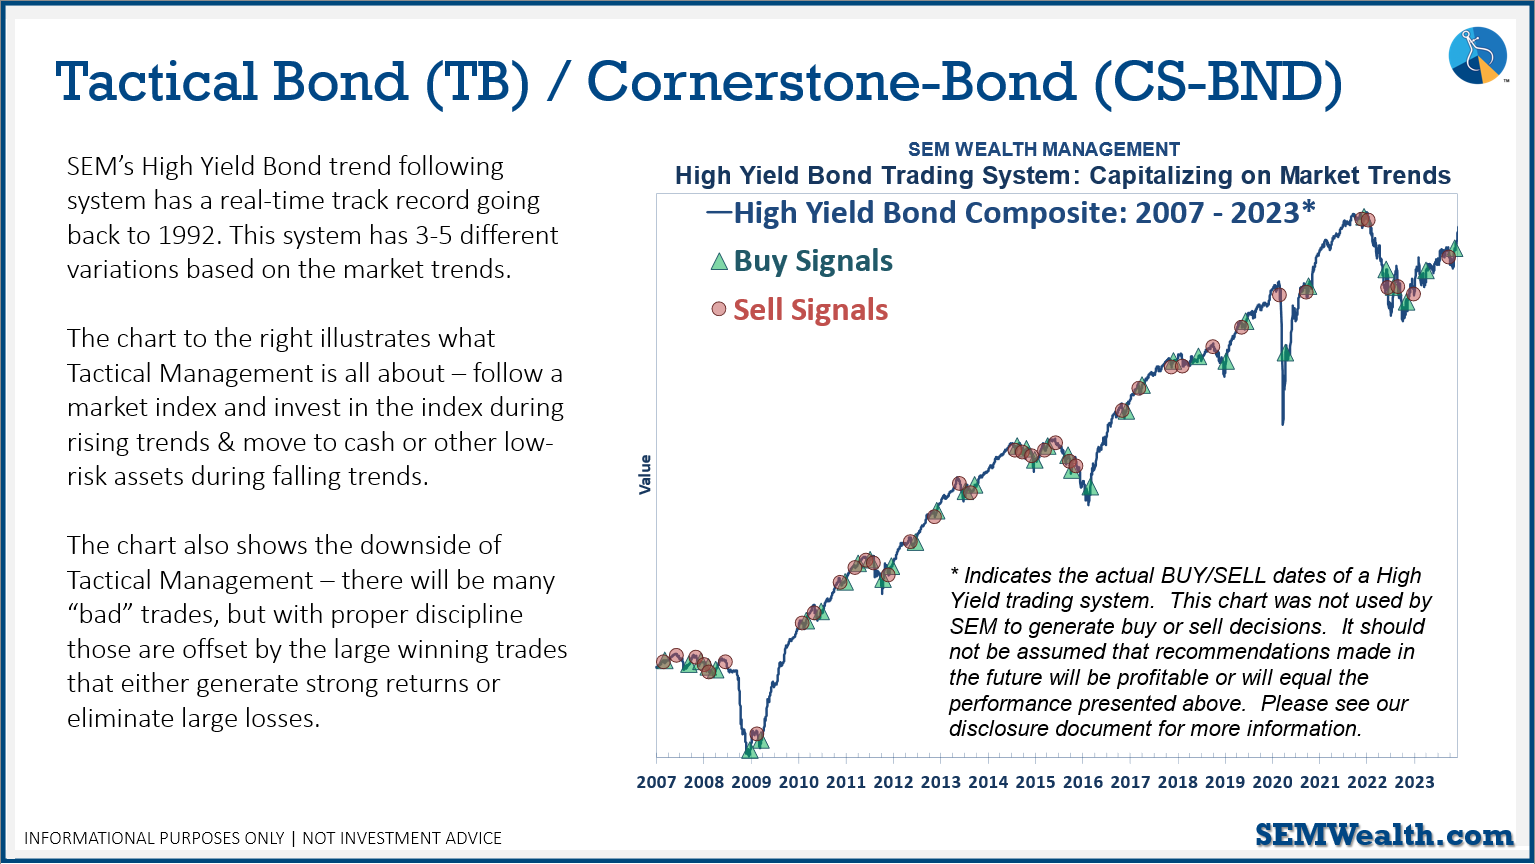
-Tactical High Yield went on a buy 11/3/2023
-Dynamic Models went to 'neutral' 2/5/2024
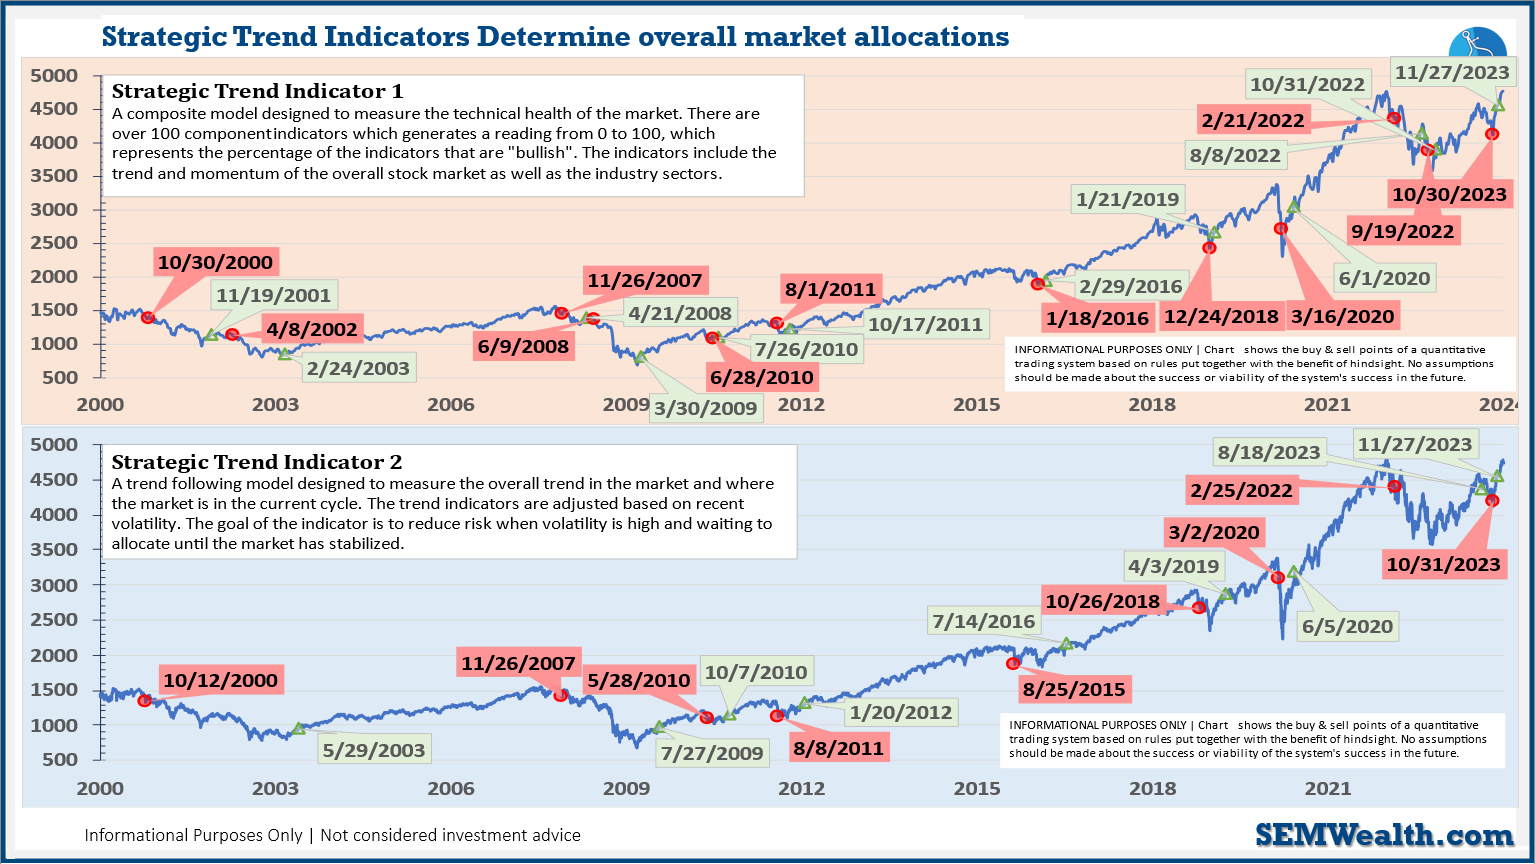
-Strategic Trend Models went on a buy 11/27/2023
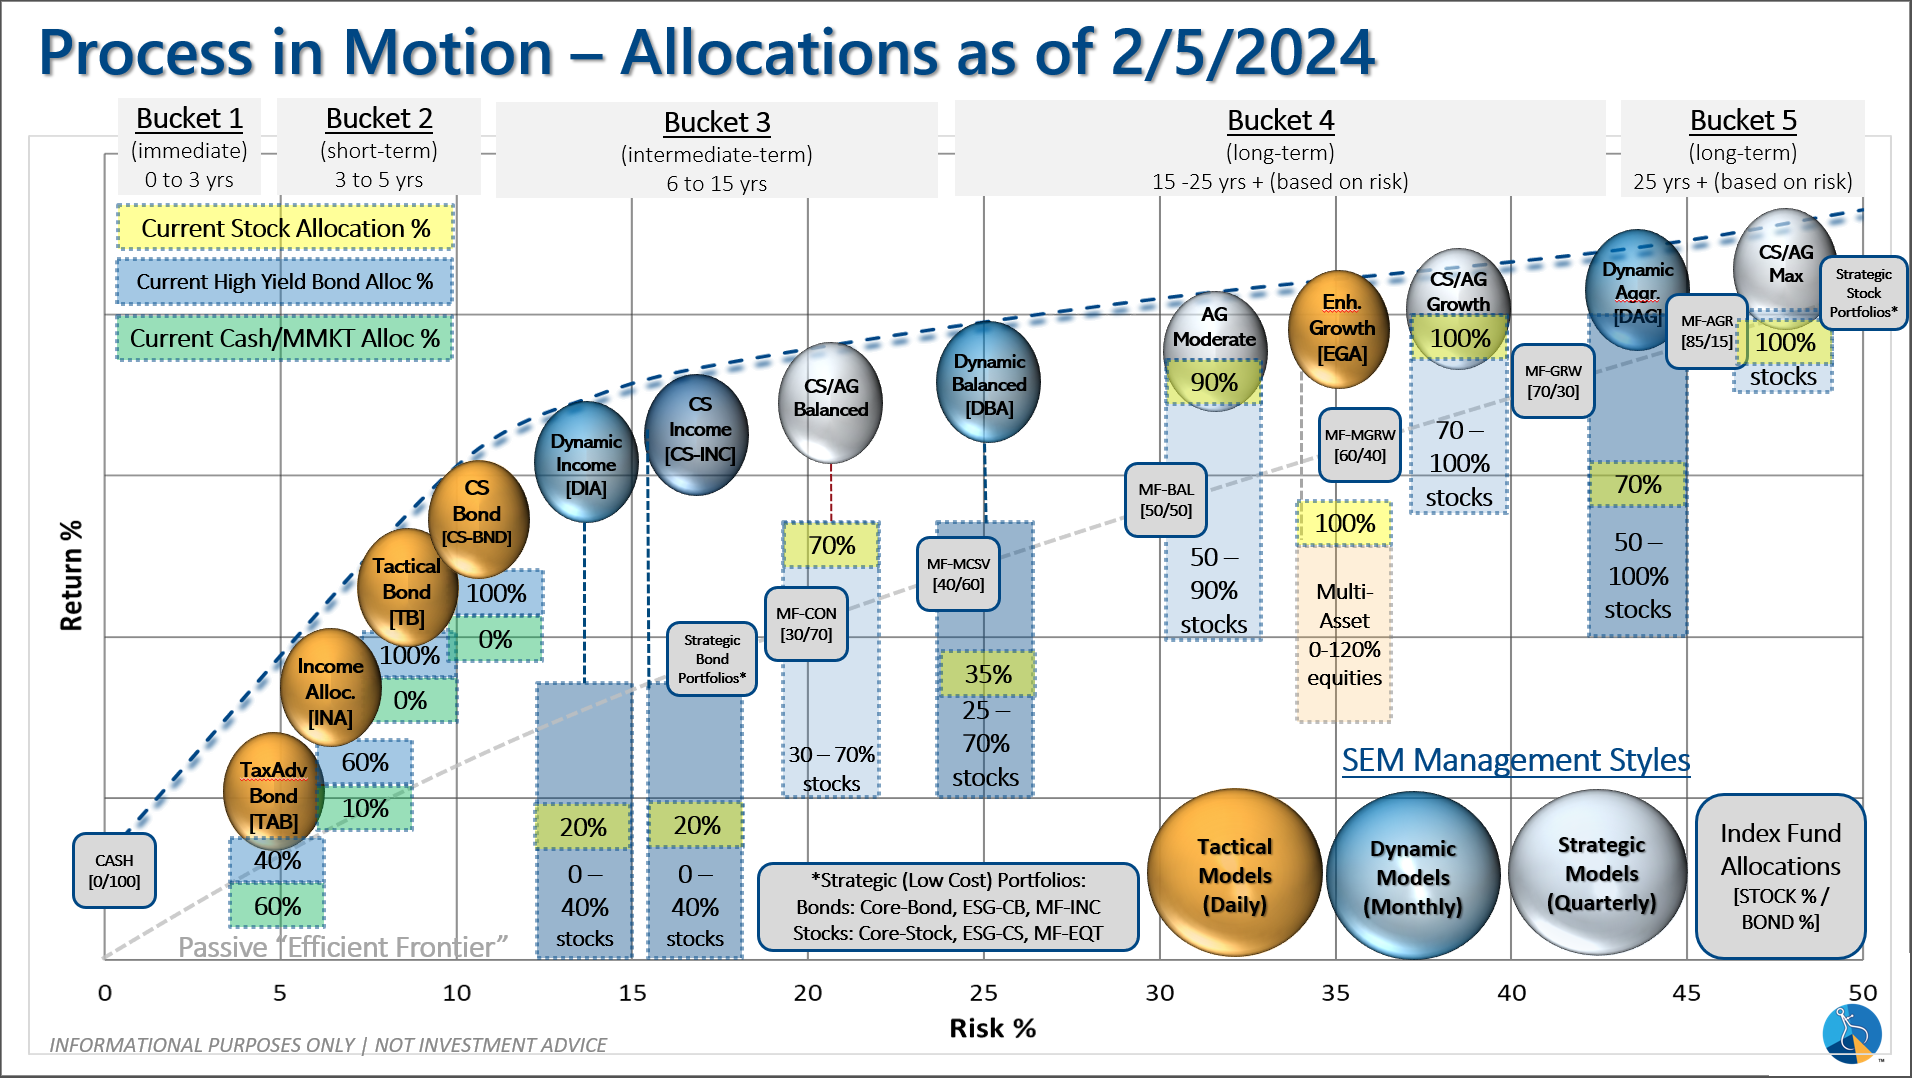
SEM deploys 3 distinct approaches – Tactical, Dynamic, and Strategic. These systems have been described as 'daily, monthly, quarterly' given how often they may make adjustments. Here is where they each stand.
Tactical (daily): The High Yield Bond system bought the beginning of April and issued all 3 sell signals 9/28/2023. All 3 systems were back on buy signals by the close on 11/3/2023. The bond funds we are invested in are a bit more 'conservative' than the overall index, but still yielding between 7.5 -8.5% annually.
Dynamic (monthly): At the beginning of December the economic model reverted back to "bearish". This was reversed at the beginning of Februrary. This means benchmark positions – 20% dividend stocks in Dynamic Income and 20% small cap stocks in Dynamic Aggressive Growth.
Strategic (quarterly)*:
BOTH Trend Systems reversed back to a buy on 11/27/2023
The core rotation is adjusted quarterly. On August 17 it rotated out of mid-cap growth and into small cap value. It also sold some large cap value to buy some large cap blend and growth. The large cap purchases were in actively managed funds with more diversification than the S&P 500 (banking on the market broadening out beyond the top 5-10 stocks.) On January 8 it rotated completely out of small cap value and mid-cap growth to purchase another broad (more diversified) large cap blend fund along with a Dividend Growth fund.
The * in quarterly is for the trend models. These models are watched daily but they trade infrequently based on readings of where each believe we are in the cycle. The trend systems can be susceptible to "whipsaws" as we saw with the recent sell and buy signals at the end of October and November. The goal of the systems is to miss major downturns in the market. Risks are high when the market has been stampeding higher as it has for most of 2023. This means sometimes selling too soon. As we saw with the recent trade, the systems can quickly reverse if they are wrong.
Overall, this is how our various models stack up based on the last allocation change: