Normal is a relative term. The definition even says "usual, average, or typical state or condition." For the past 4 years we've been living in anything but normal conditions with the pandemic, unprecedented actions to fight the pandemic (both health and economic policies), and then the fight to control the inflation caused by those policies. This has skewed every economic statistic out there and has left everyone wondering "what is normal?"
With the Payroll Report coming in last Friday, we once again end the economic month with a look at the SEM Economic Model. This model is a quantitative model I first started developing in 1995 and mechanized in mid-2001 when the Federal Reserve Database went online. It uses data back to 1947 where available, which is when the government decided it probably would be good to have a storehouse of economic data points to help government entities, businesses, and citizens make more informed decisions. Both in the testing period and in real-time we've obviously seen our fair share of 'shocks' and 'abnormal' periods.
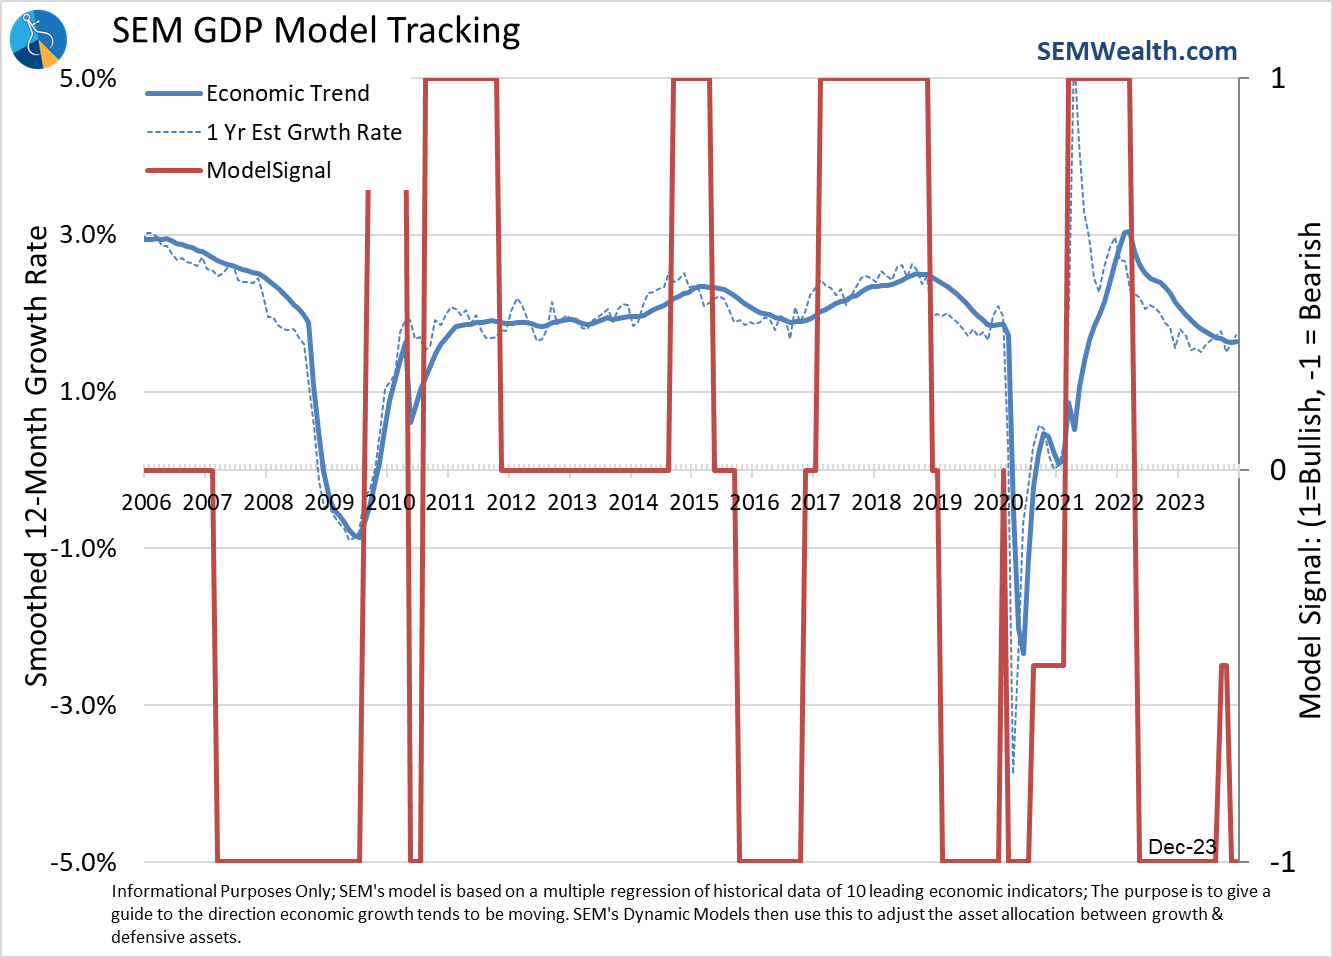
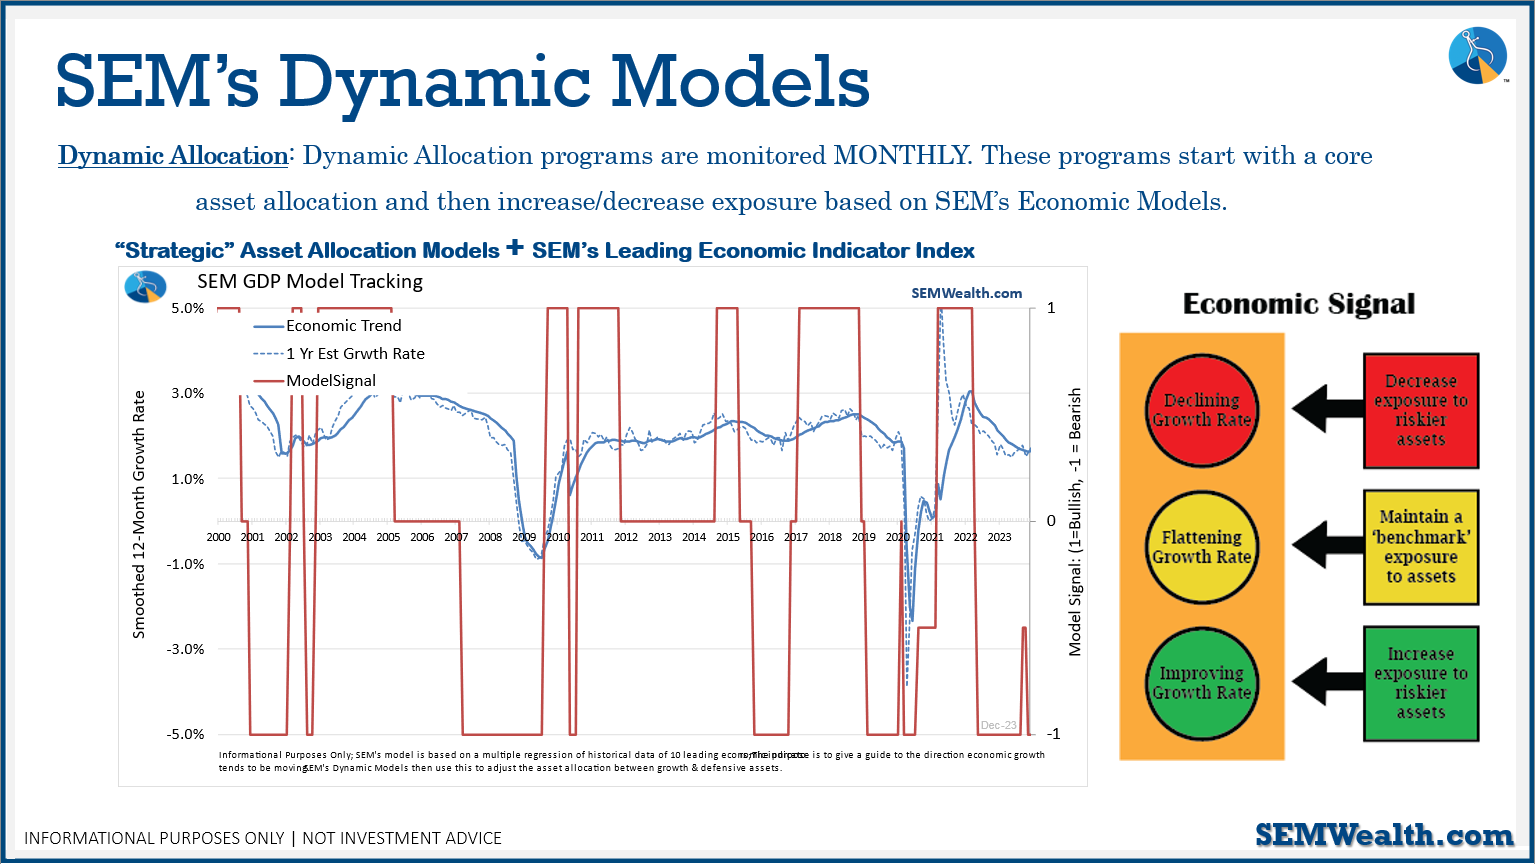
The model is designed to absorb and adjust to these shocks, but since we didn't have data from the 1920s - 1940s we couldn't plan for what happened from 2020-2023. As we do with all our models we are constantly evaluating the decisions they make and looking for ways to improve the model. Looking at the SEM Economic Model we can see the following decisions:
- Turned 'bearish' the beginning in February 2019 as the impact of the 2017 tax cuts quickly wore off. Went to 'neutral' in February 2020 before quickly reversing back to 'bearish' in March 2020. Rode out the beginning and worst of the pandemic until going bullish in February 2021.
- Went to 'bearish' in April 2022 as the impact of the stimulus quickly wore off.
- Other than a slight bump in the fall of 2023, the model has remained "bearish".
Some people have asked about how our model could be so "wrong" for so long. Before declaring it "wrong" we have to consider several things:
1.) The model doesn't call the beginning or the end of the recession, but instead looks at whether the growth trend is accelerating or decelerating. Another way to think of it is the model asks "are we growing at an above normal, below normal, or normal (average) rate?"
2.) The 1-year rate of GDP growth peaked in December 2021 at 5.4% and declined all the way down to 0.7% by December 2022.
3.) The 1-year rate of growth for 2023 was 2.9%. "Normal" long-term GDP growth is 3.1%, so even the 'great' year of 2023 was still slightly below normal.
Before going further, what is most important to know how this impacted PERFORMANCE. As I mentioned last week, while we aren't supposed to talk about performance on this page, I can say generally speaking all of the Dynamic models (Income, Balanced, Growth, and even our 'alternative' Dynamic Asset Allocator') which exclusively use the SEM Economic Model) not only are ahead of a passive 'total stock market' index fund return (net of all fees), but they are all our BEST performers over the past 2- years.
This is not a recommend to use any of these models. Please consult your financial advisor before making a decision to use these models. Past performance is not a guarantee of future results. All investments involve risk including those managed by SEM. It is important to evaluate any investment over longer periods of time than just 2-years. Please contact SEM or your advisor to learn more about the performance of these models.
While we certainly would have loved to see the model be "bullish" throughout 2023 to participate in more of the stock market's amazing year we know the market is a story of cycles. Everyone gets overly optimistic and then overly pessimistic. Studying the model's performance and the components inside the model we can see what happened in 2023 WAS NOT NORMAL.
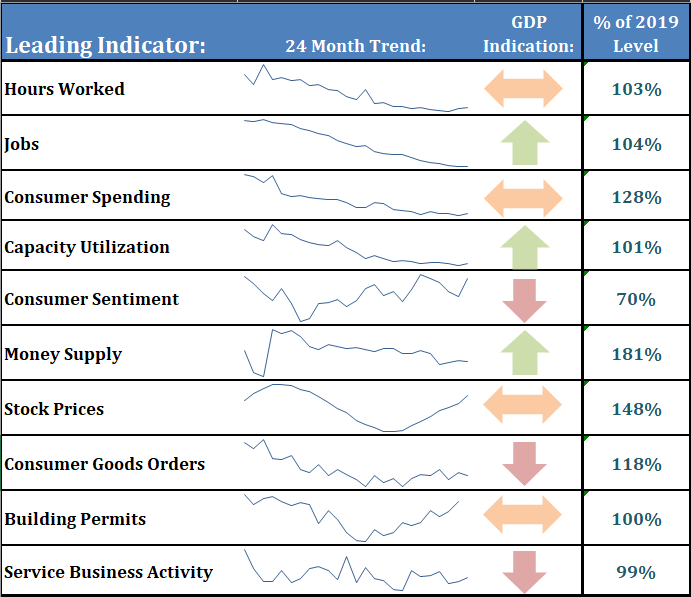
Rather than digging into each of the leading indicators this month, I thought we'd take a different approach. If we assume 2019 was 'normal', it is instructive to see where each indicator is sitting relative to where it was at the end of 2019.
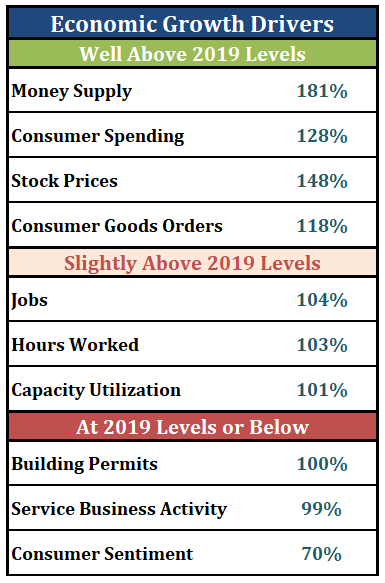
If you bought into the euphoria of 2023, you have to believe that an economy driven by an 81% spike in the money supply, which led to a 28% spike in Consumer Spending justifies the 48% jump in stock prices, then you are likely going to be disappointed in the future. The drivers of growth will come back down.
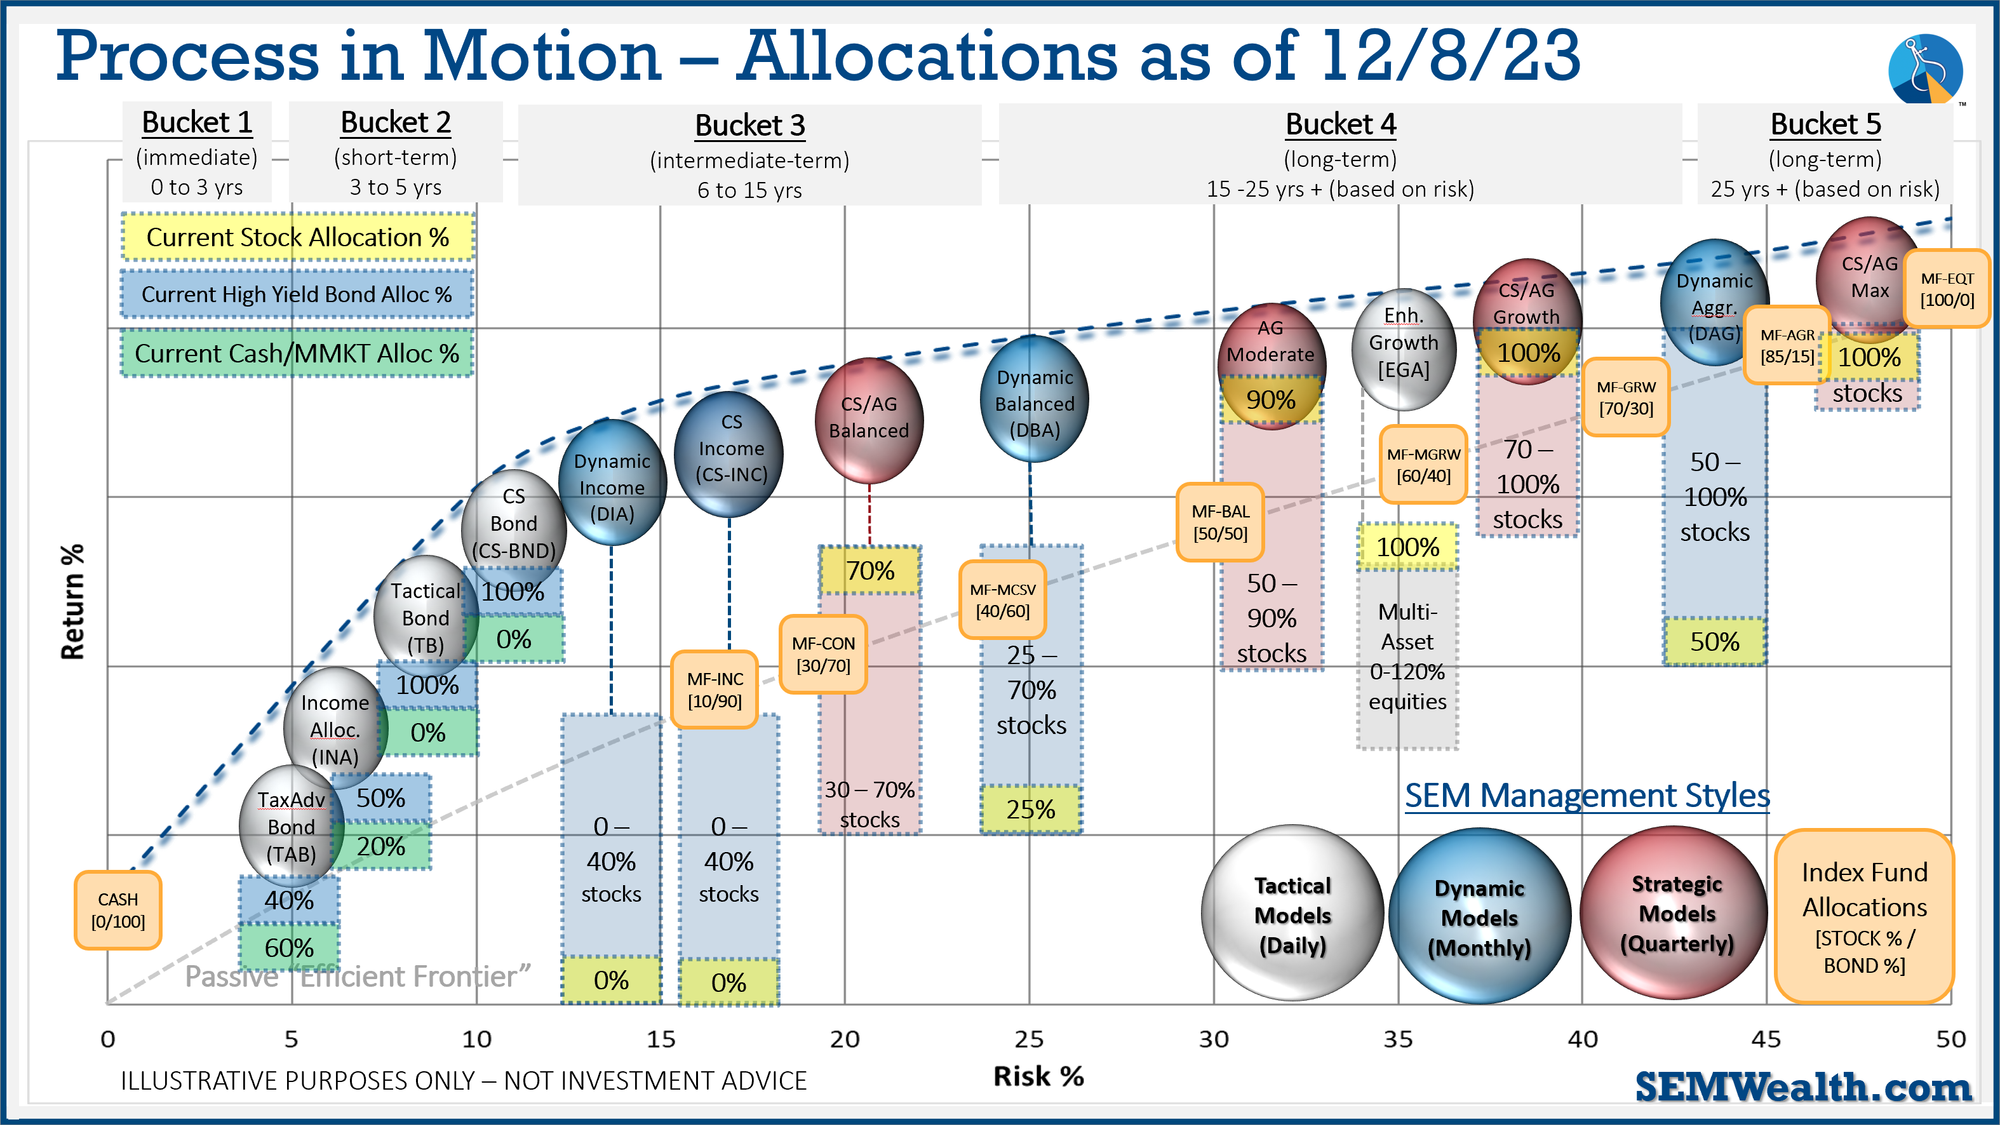
Our economic model is still saying to expect 'below average' growth, so we remain in a 'bearish' allocation. This simply means no exposure to small caps in Dynamic Aggressive Growth (and only a 50% allocation to stocks) and no exposure to dividend stocks in Dynamic Income (with most of the money deployed to 'tactical fixed income' managers along with Treasury Bonds.)
Overall, our dashboard hasn't changed too much the past couple of months.
Looking at the model trends, IF we see a bit of improvement in the coming months, we could be going back to 'neutral', but it's too early to tell.
Market Charts
We worried last week we could see some rebalance activity hit stocks. I mentioned the likelihood of large cap growth taking a bigger hit with small cap being the beneficiary, but instead it appears the allocation was OUT of stocks altogether. It is too early to say this is bad news for stocks, but the lack of rotation into small caps is certainly not an endorsement of a strong year for the stock market.
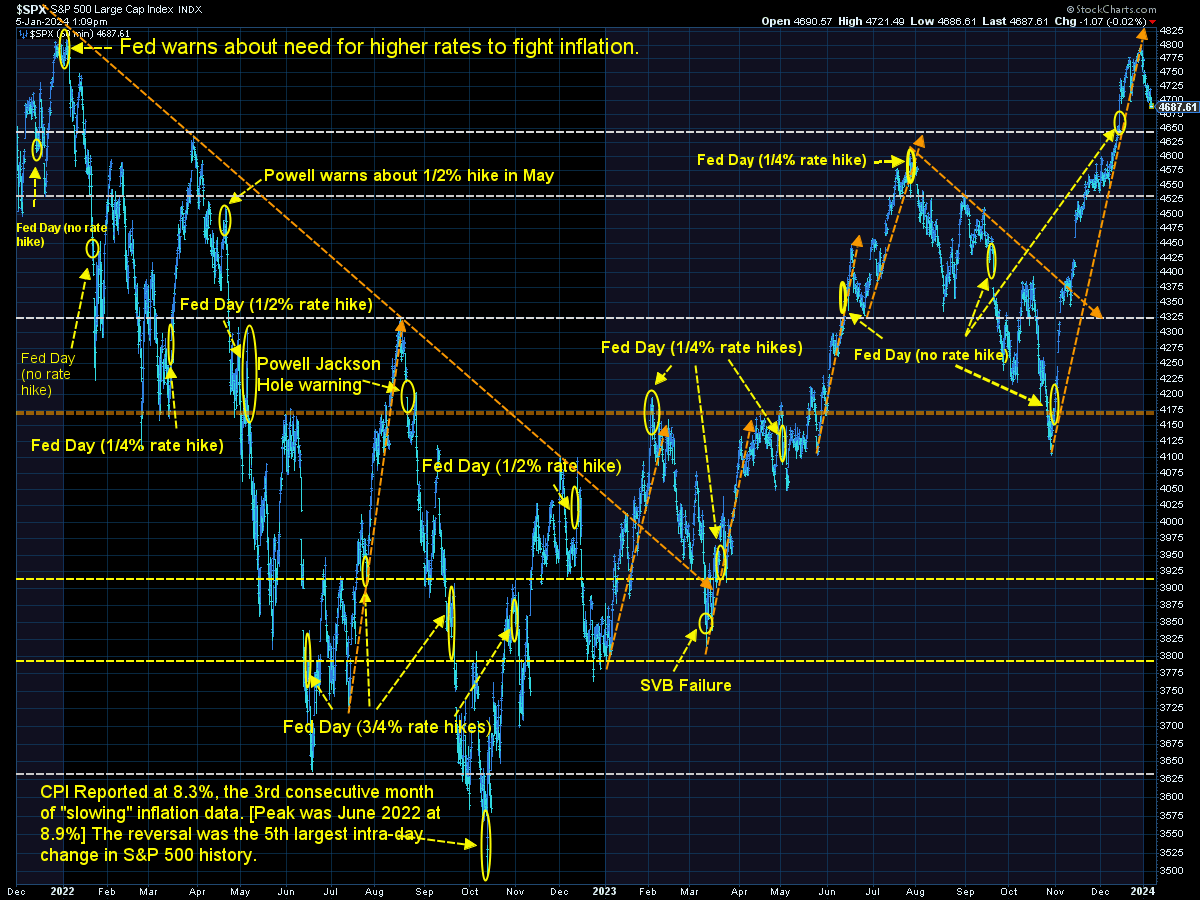
The S&P 500 had a rough week after failing to hit its all-time high at the end of 2022.
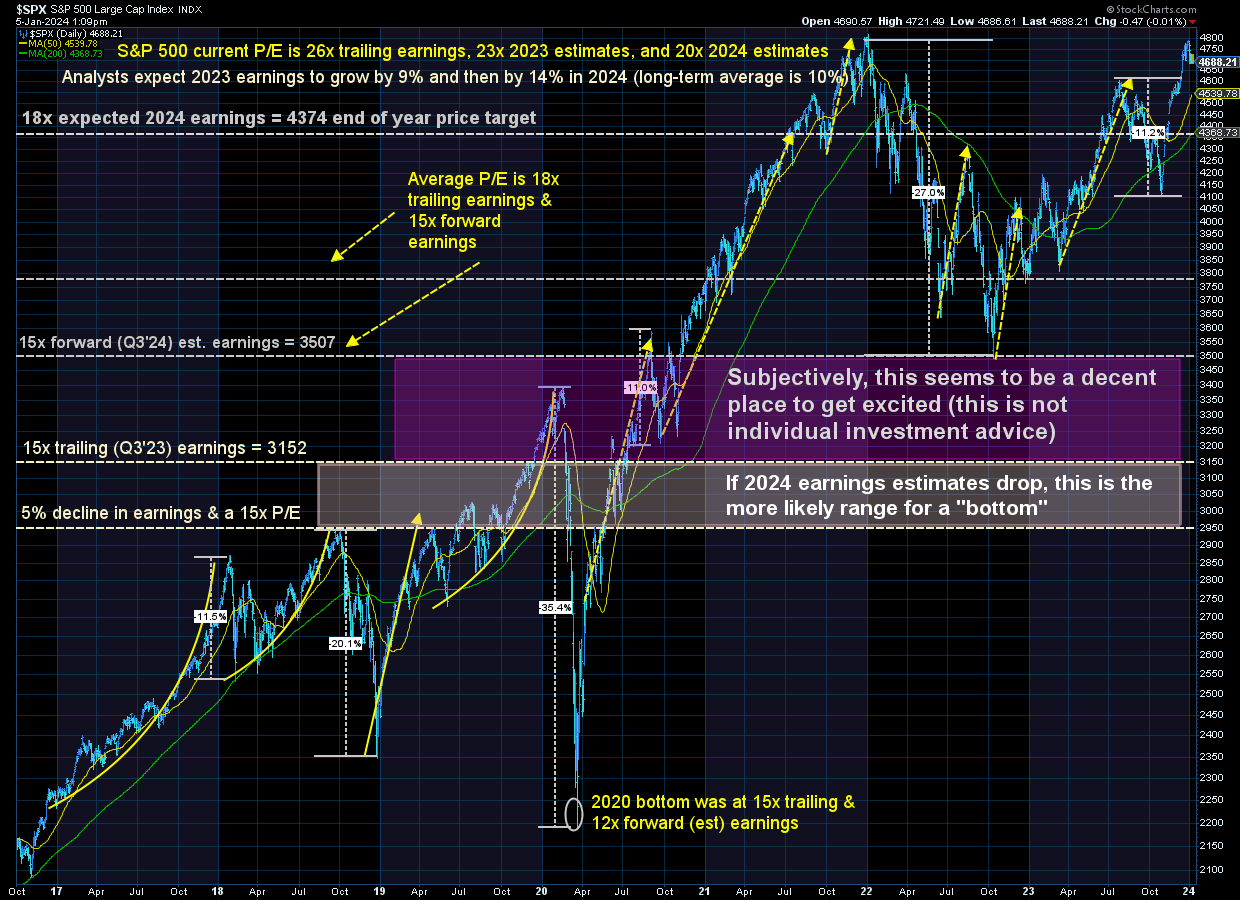
Longer-term the story remains – stocks are significantly overvalued. The only way they can justify these valuations is if corporate earnings come in better than currently expected. With earnings already expected to be above average and economic growth expected to be below average, that could be a problem.
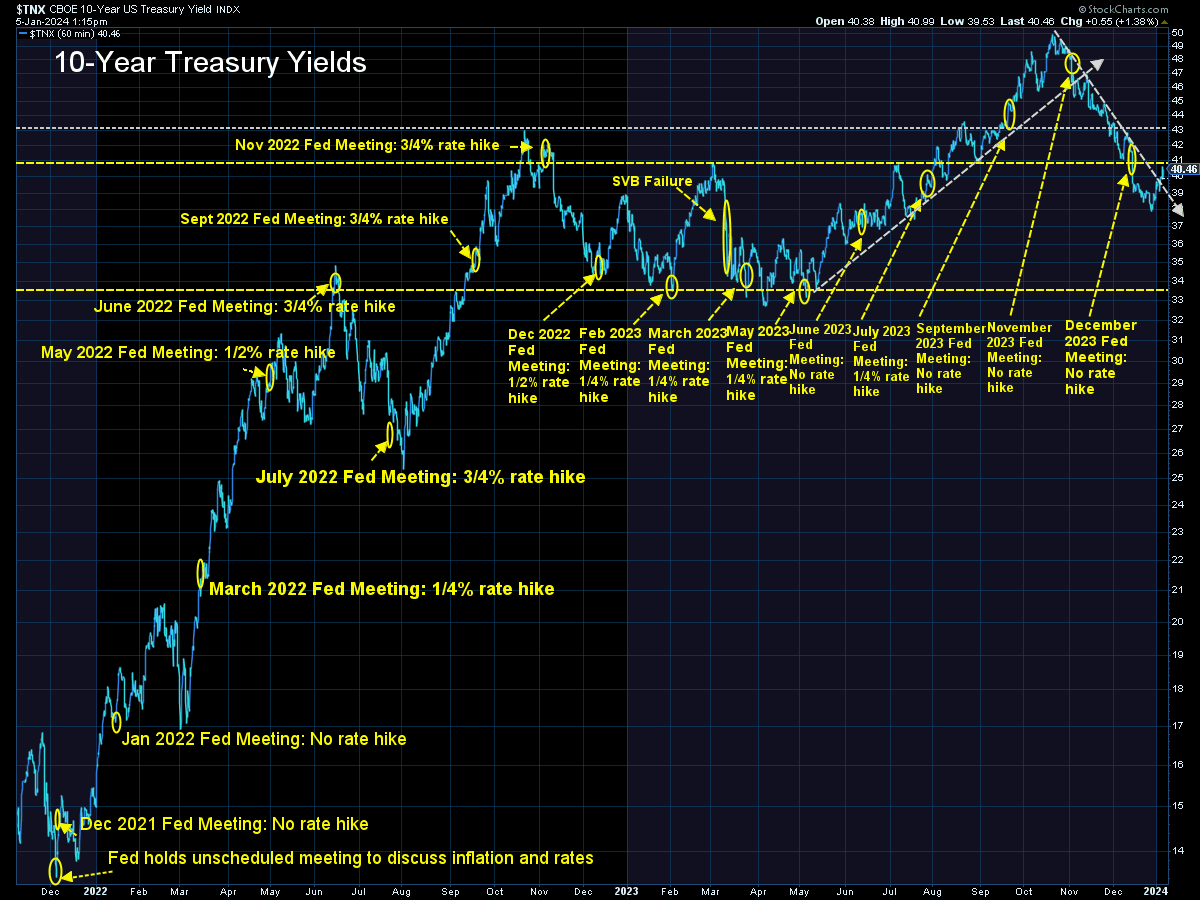
It was also a bad week for bonds. Going into the year the market was pricing in 6-8 Fed rate cuts. The jobs report was not that impressive in terms of economic growth, but it also wasn't bleak enough to warrant the Fed panicking and cutting rates aggressively (so far). This led the bond market to quickly adjust to the expectation of 5-6 rate cuts in 2024.....one data point changed expectations that quickly. Please be careful out there.
SEM Model Positioning
-Tactical High Yield went on a buy 11/3/2023
-Dynamic Models reverted back to 'bearish' 12/8/2023
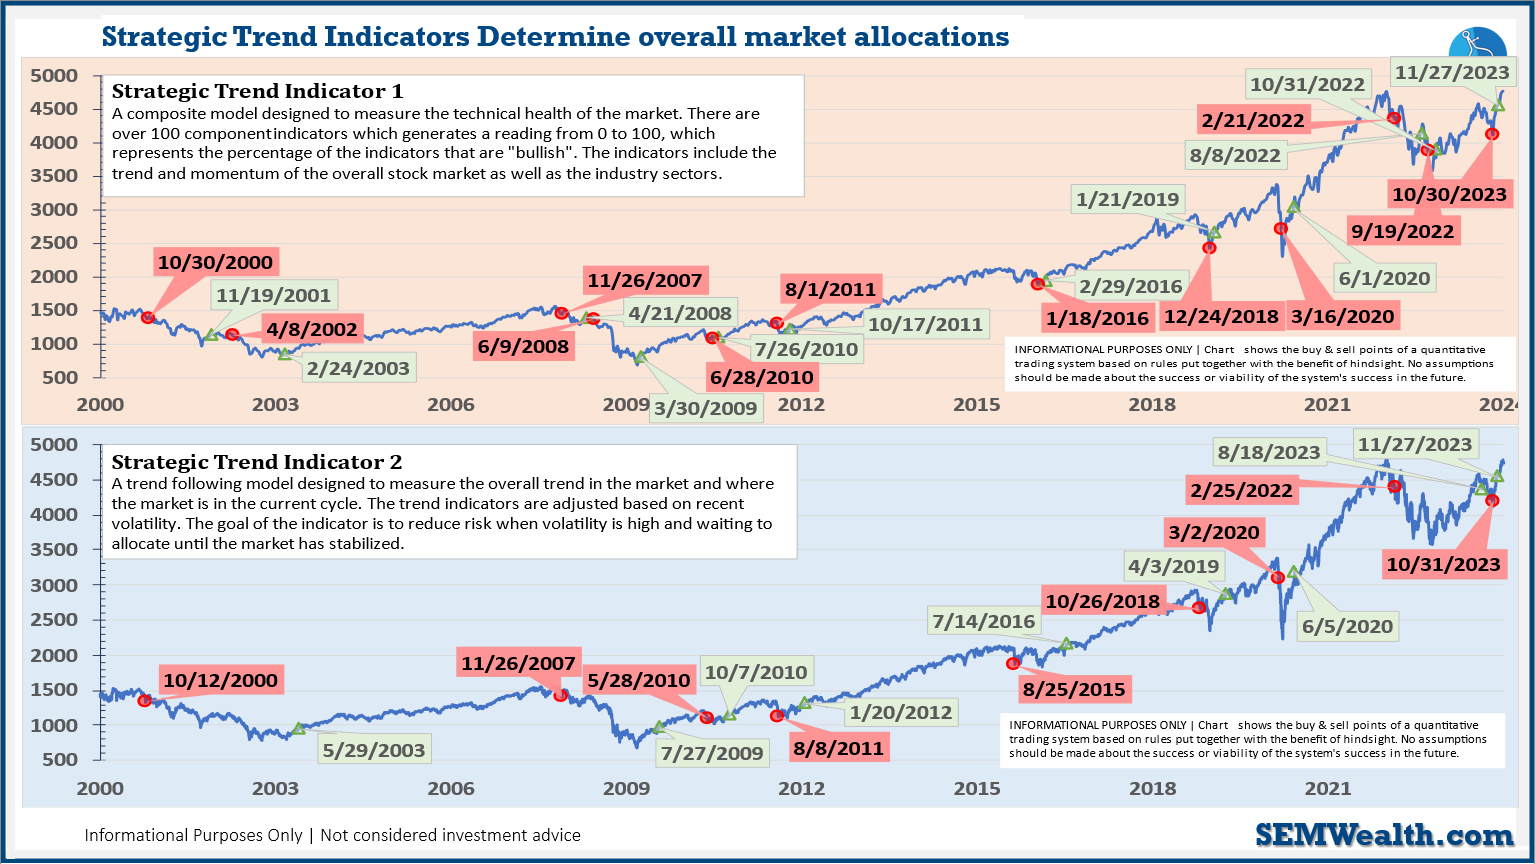
-Strategic Trend Models went on a buy 11/27/2023
SEM deploys 3 distinct approaches – Tactical, Dynamic, and Strategic. These systems have been described as 'daily, monthly, quarterly' given how often they may make adjustments. Here is where they each stand.
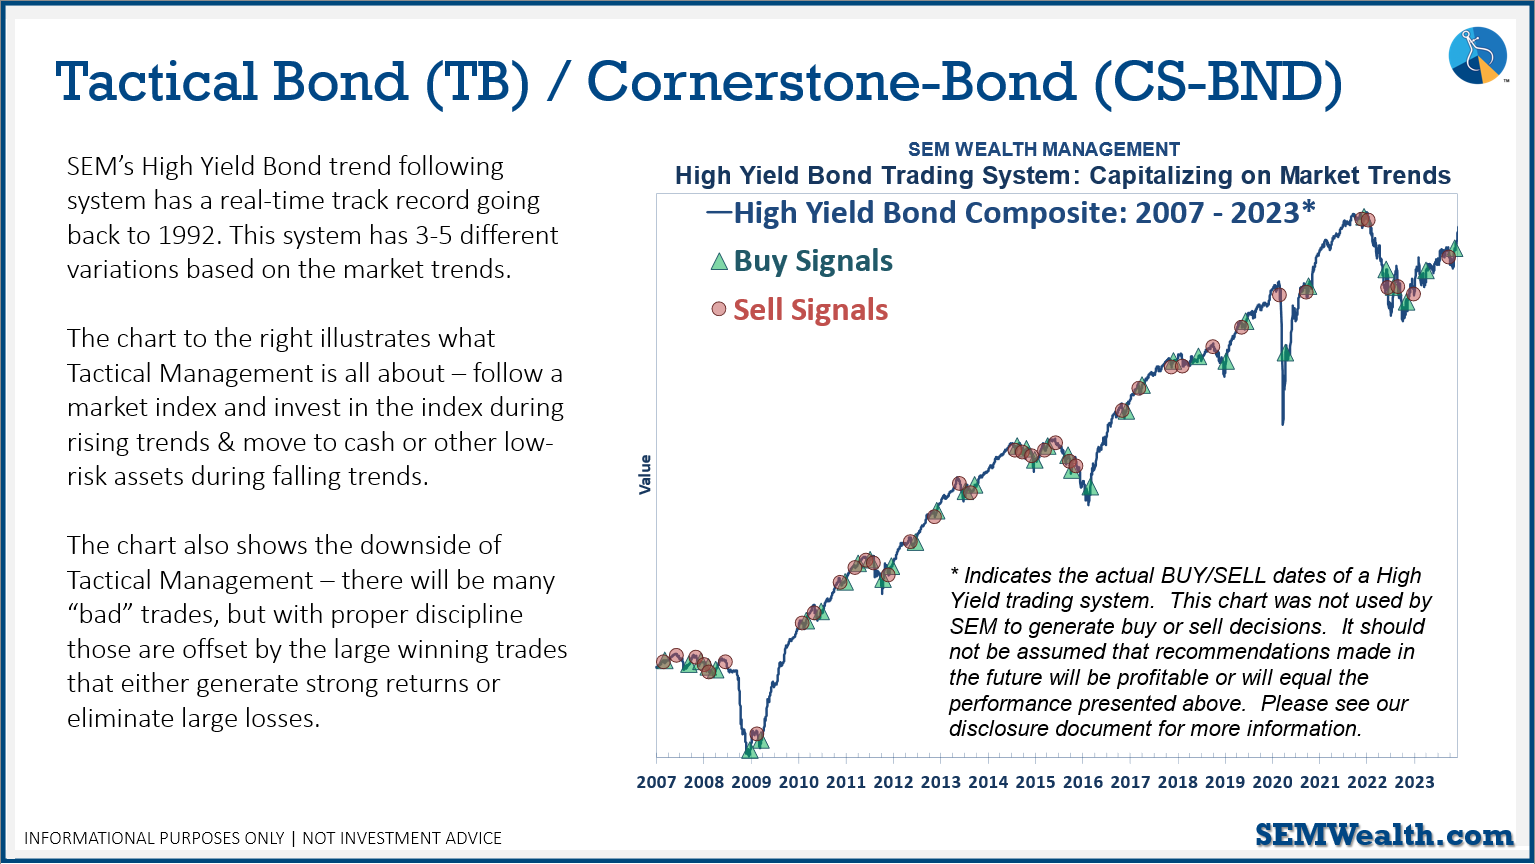
Tactical (daily): The High Yield Bond system bought the beginning of April and issued all 3 sell signals 9/28/2023. All 3 systems were back on buy signals by the close on 11/3/2023. The bond funds we are invested in are a bit more 'conservative' than the overall index, but still yielding between 7.5 -8.5% annually.
Dynamic (monthly): At the beginning of October the model moved slightly off the "bearish" signal we've had since April 2022. At the beginning of December it reverted back to "bearish". This means no positions in dividend stocks (Dynamic Income) or small cap stocks (Dynamic Aggressive Growth).
Strategic (quarterly)*:
BOTH Trend Systems reversed back to a buy on 11/27/2023
The core rotation is adjusted quarterly. On August 17 it rotated out of mid-cap growth and into small cap value. It also sold some large cap value to buy some large cap blend and growth. The large cap purchases were in actively managed funds with more diversification than the S&P 500 (banking on the market broadening out beyond the top 5-10 stocks.)
The * in quarterly is for the trend models. These models are watched daily but they trade infrequently based on readings of where each believe we are in the cycle. The trend systems can be susceptible to "whipsaws" as we saw with the recent sell and buy signals at the end of October and November. The goal of the systems is to miss major downturns in the market. Risks are high when the market has been stampeding higher as it has for most of 2023. This means sometimes selling too soon. As we saw with the recent trade, the systems can quickly reverse if they are wrong.
Overall, this is how our various models stack up based on the last allocation change: