The economy continues to chug along and the pundits continue to marvel at its strength. The Fed is doing all but taking a victory tour in their ability to beat inflation without causing a recession. Very few people seem to be concerned about the prospects of a recession.
Last week it was reported in 2023 the economy grew at 2.5%. With so many people expecting a recession when the year started, this number seems impressive. Few people are pointing out the fact this is BELOW average (3.1% is the average long-term growth rate for our economy.) Even fewer people are pointing out the Fed is expecting just a 1.5% growth rate for our economy in 2024. Neither are numbers which would point to paying ABOVE AVERAGE prices for stocks, yet that is exactly what is happening.
For more on that see:

Even fewer people are looking at the fact we had a very abnormal economy the past 3 years. Prior to COVID we were heading into a recession or at best a sharp slowdown in growth. Most economic data points are returning to 'normal'.
For more on that see:

We'll have our full economic update next week, but since sitting in on the Liberty University Student Asset Management Fund meeting last week and talking to several of the students there, the question of "what is normal" came to mind. We discussed this chart of some key economic indicators. January 1, 2020 is set as the index level of 100 to show what has happened since then:
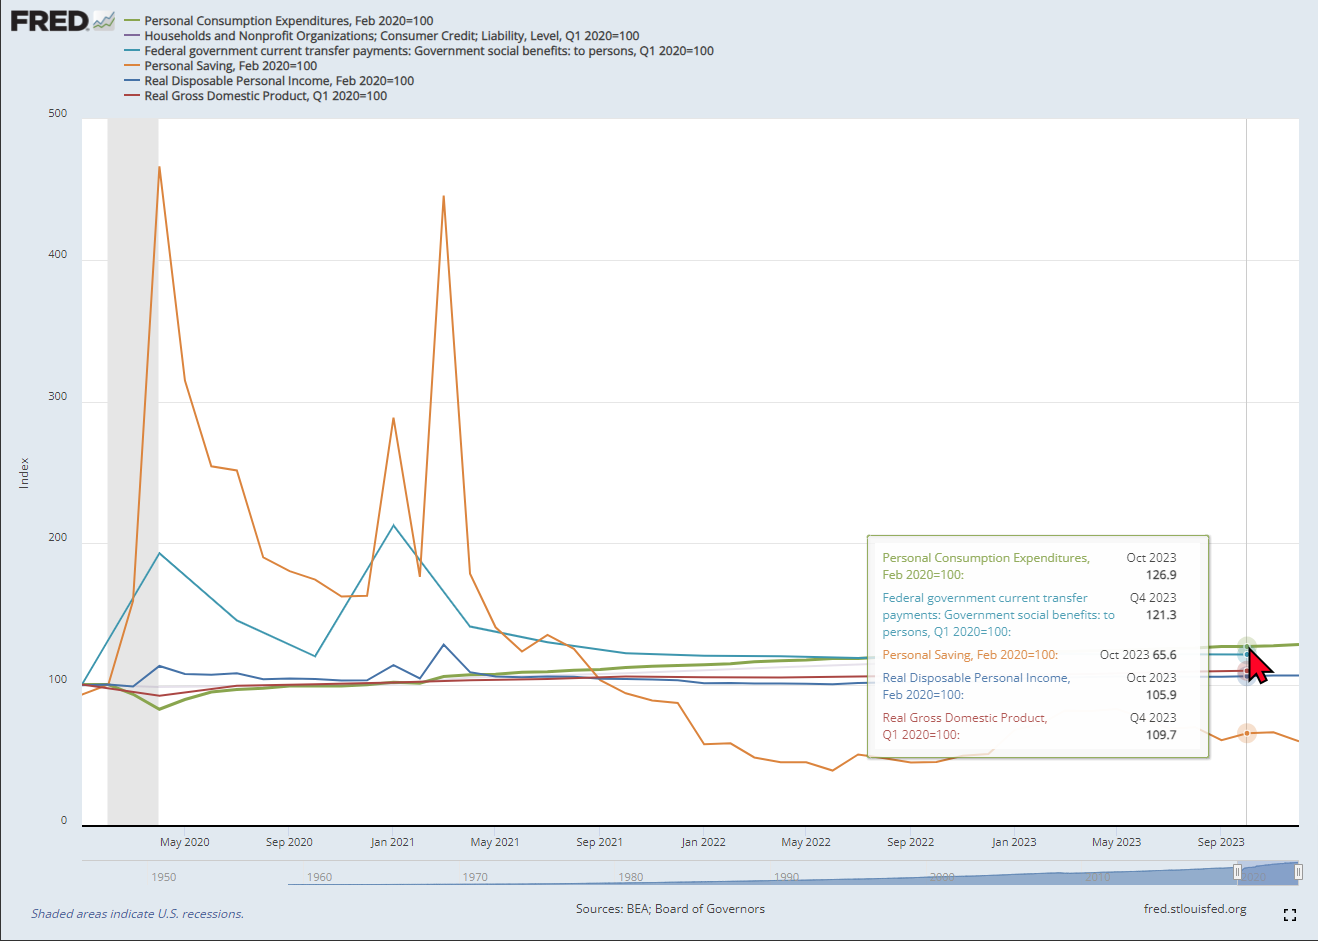
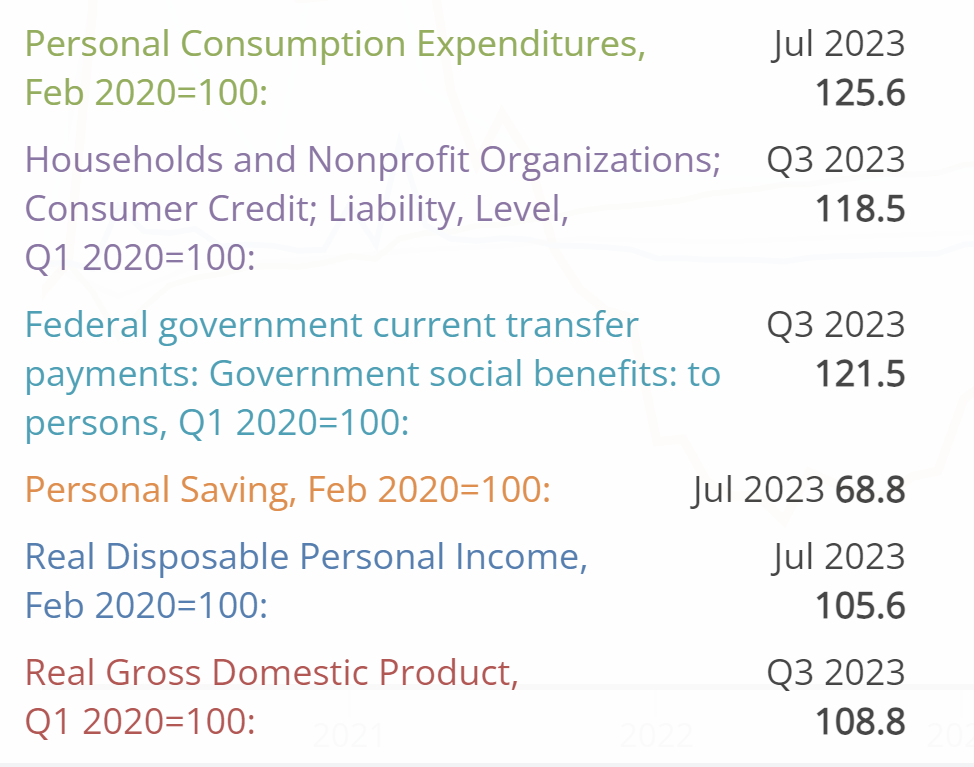
The lines above are color-coded. Here is the most recent comparable data (household debt levels are only through September of last year.)
About a year ago, we had a video series discussing the 'broken economy' or the "K-Shaped" economy I started discussing in the early-COVID days.
The chart highlights what happened:
1.) The economy shut down so those people who kept their income (those who could work at home, were receiving pensions, or living on social security) suddenly had all kinds of extra money because they couldn't go out to eat, do their regular shopping, or spend money on 'services'. The savings rate spiked.
2.) The government started sending stimulus checks and providing other payments whether people needed it or not (the transfer payments on the chart). Those people mentioned above who didn't have their income interrupted by the shutdown had excess savings. Both transfer payments and savings rates spiked.
3.) The last stimulus checks went out in April 2021 which is when inflation started roaring higher. The savings rate began to plummet (people began spending more than they were making.)
4.) Consumers kept spending & debt kept rising after the stimulus checks stopped.
Overall the economy has only grown by 9% since 2020 (2.2% annually), but debt has increased by 18%. Personal income is only up 5% TOTAL over that time.
The economy is being supported by runaway consumer spending funded by their excess savings from the COVID stimulus and debt. That is not sustainable and will be something we have to deal with in the years ahead.
For now, the trend is up and we are happy to see pretty much everything (still) going up. For more on that see below..........
Market Charts
As I said last week. New highs breed new highs. Until something fundamentally changes in the market's outlook the easiest path is up. The problem is as valuations get extended there is little to support the prices and everyone chasing stocks higher will sell quickly.
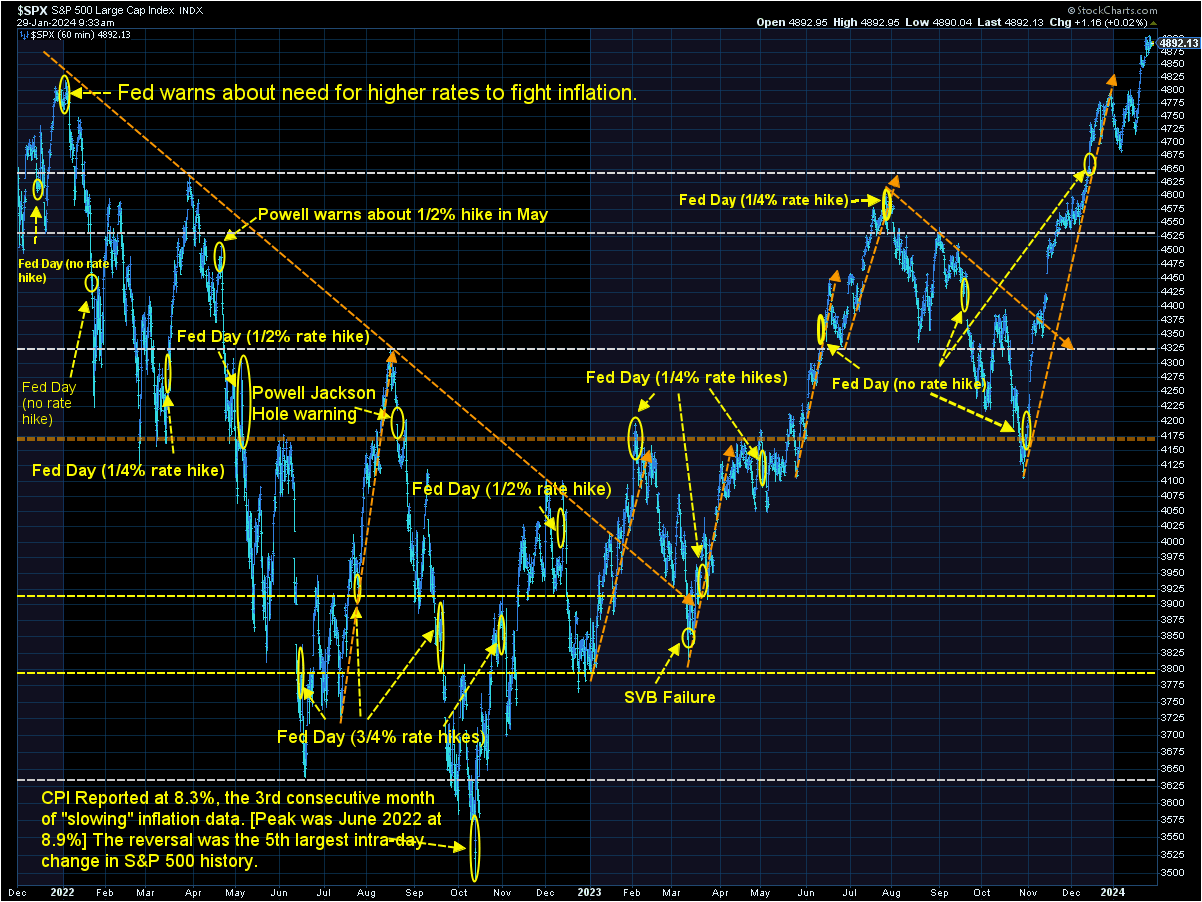
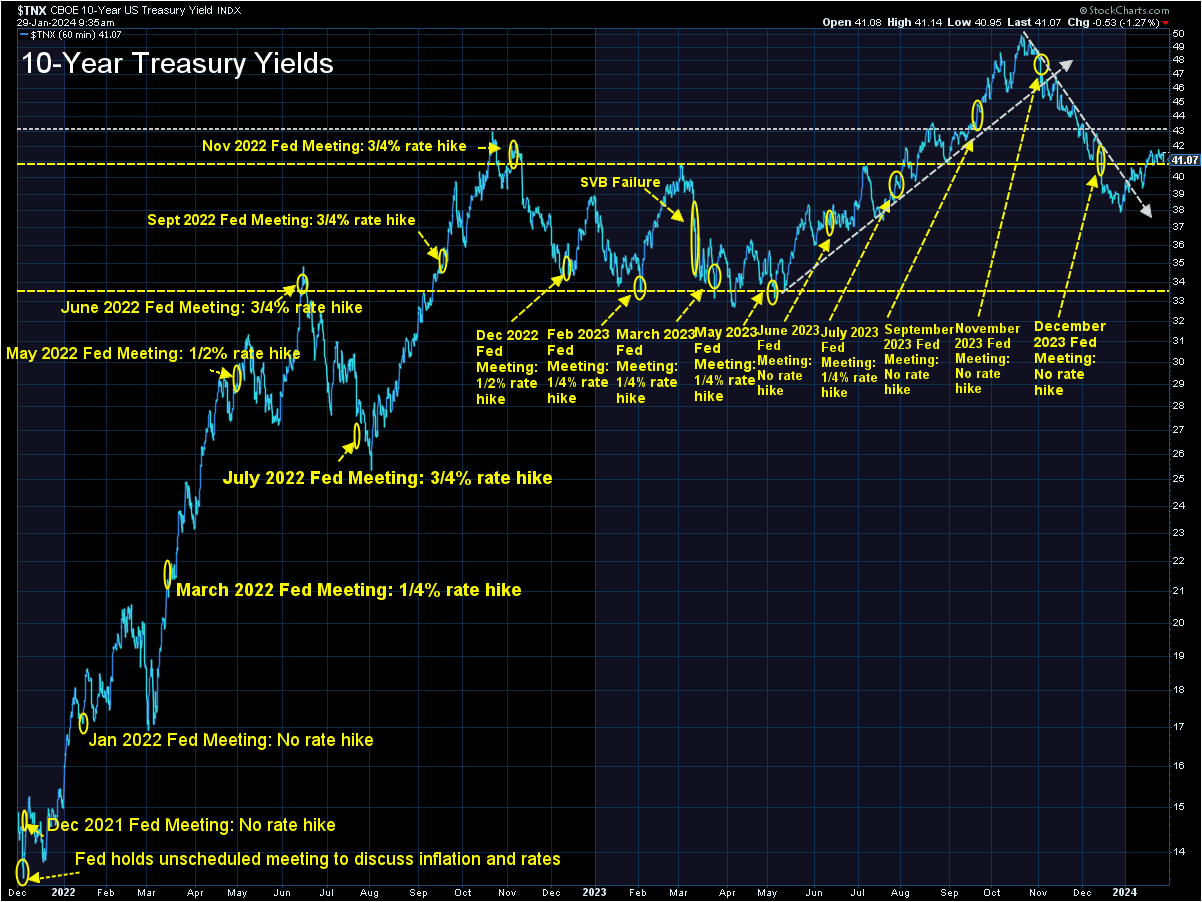
Interest rates could be the fundamental thing that changes sentiment. Rates dropped quickly and stocks rallied late last year with the belief the Fed will aggressively be cutting rates in 2024. Since then the bond market has started to question that logic, but it has yet to hit stocks.
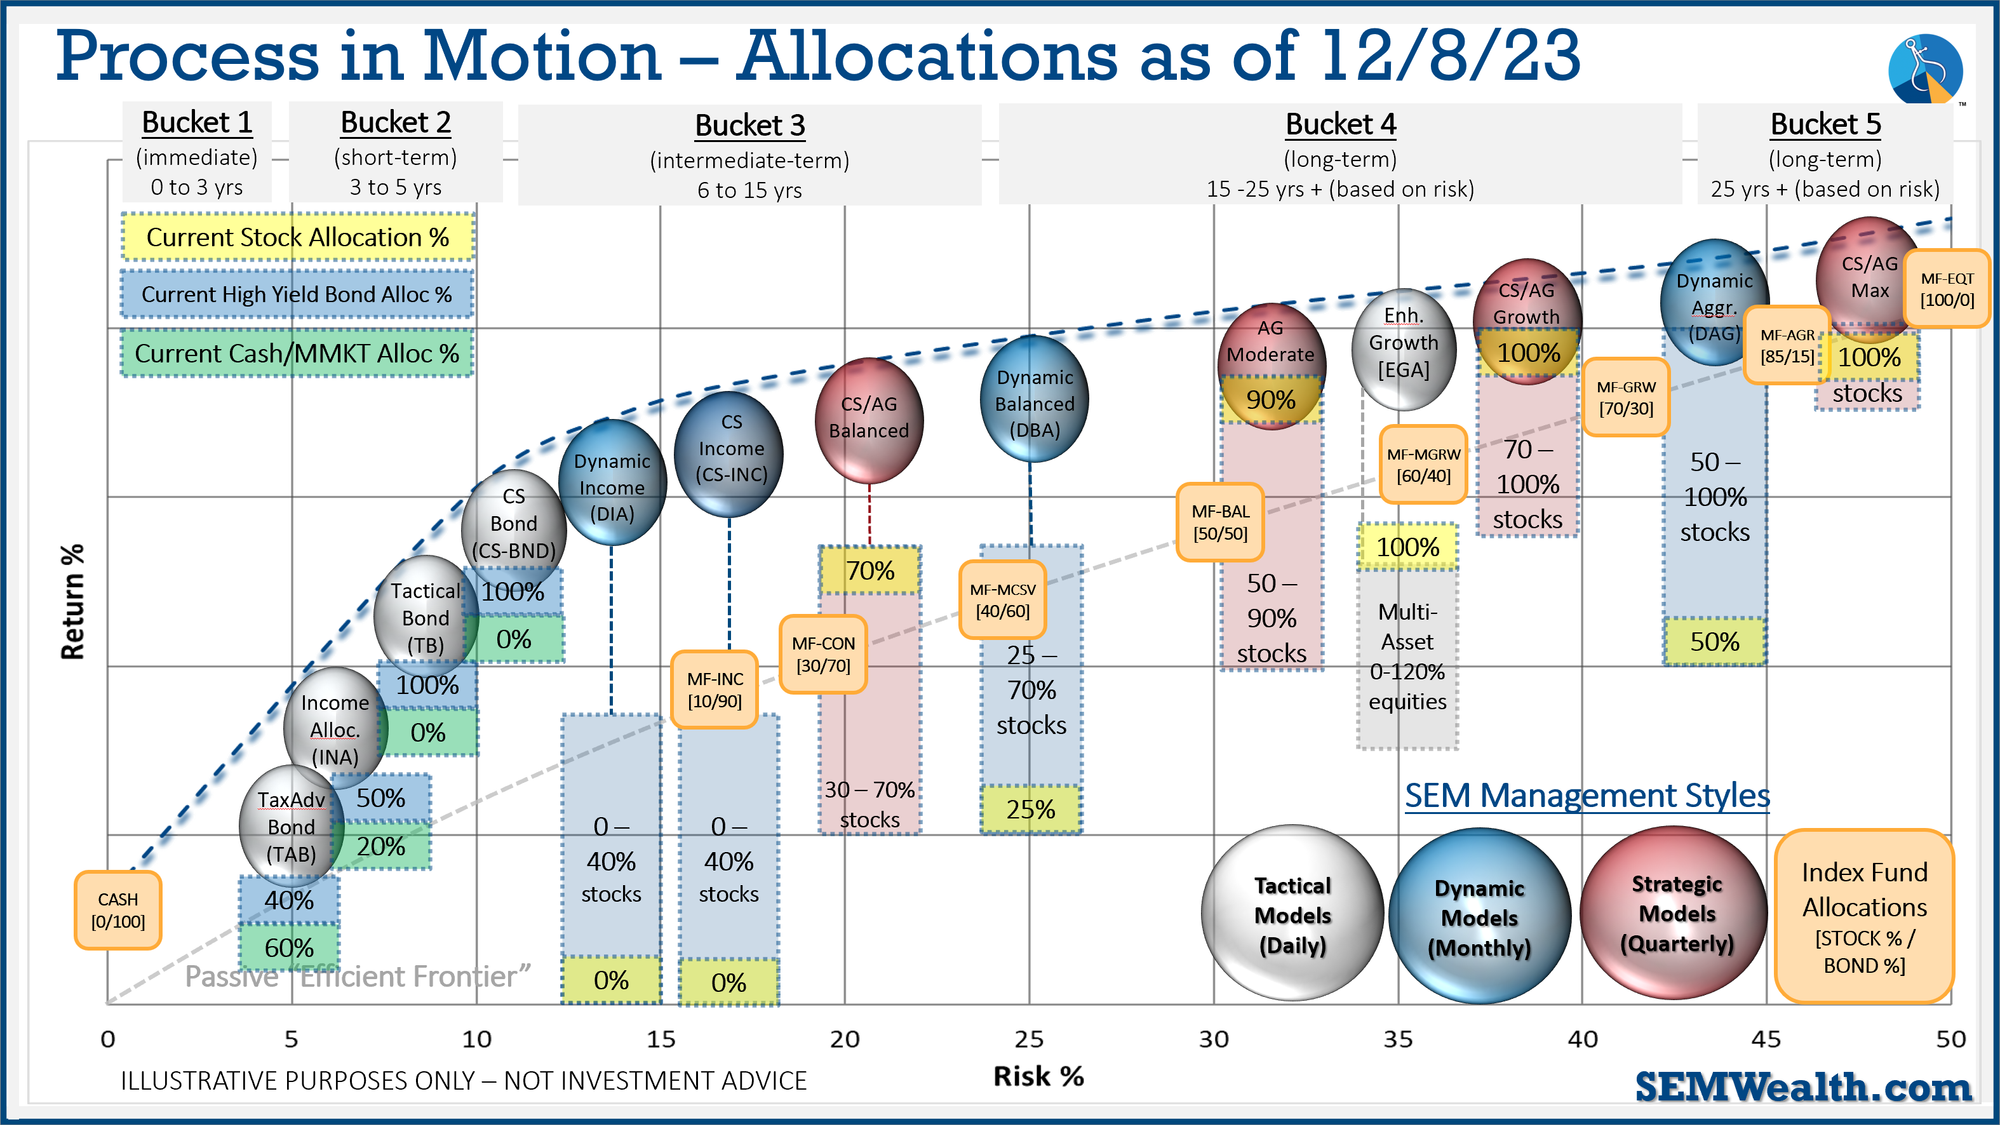
SEM Model Positioning
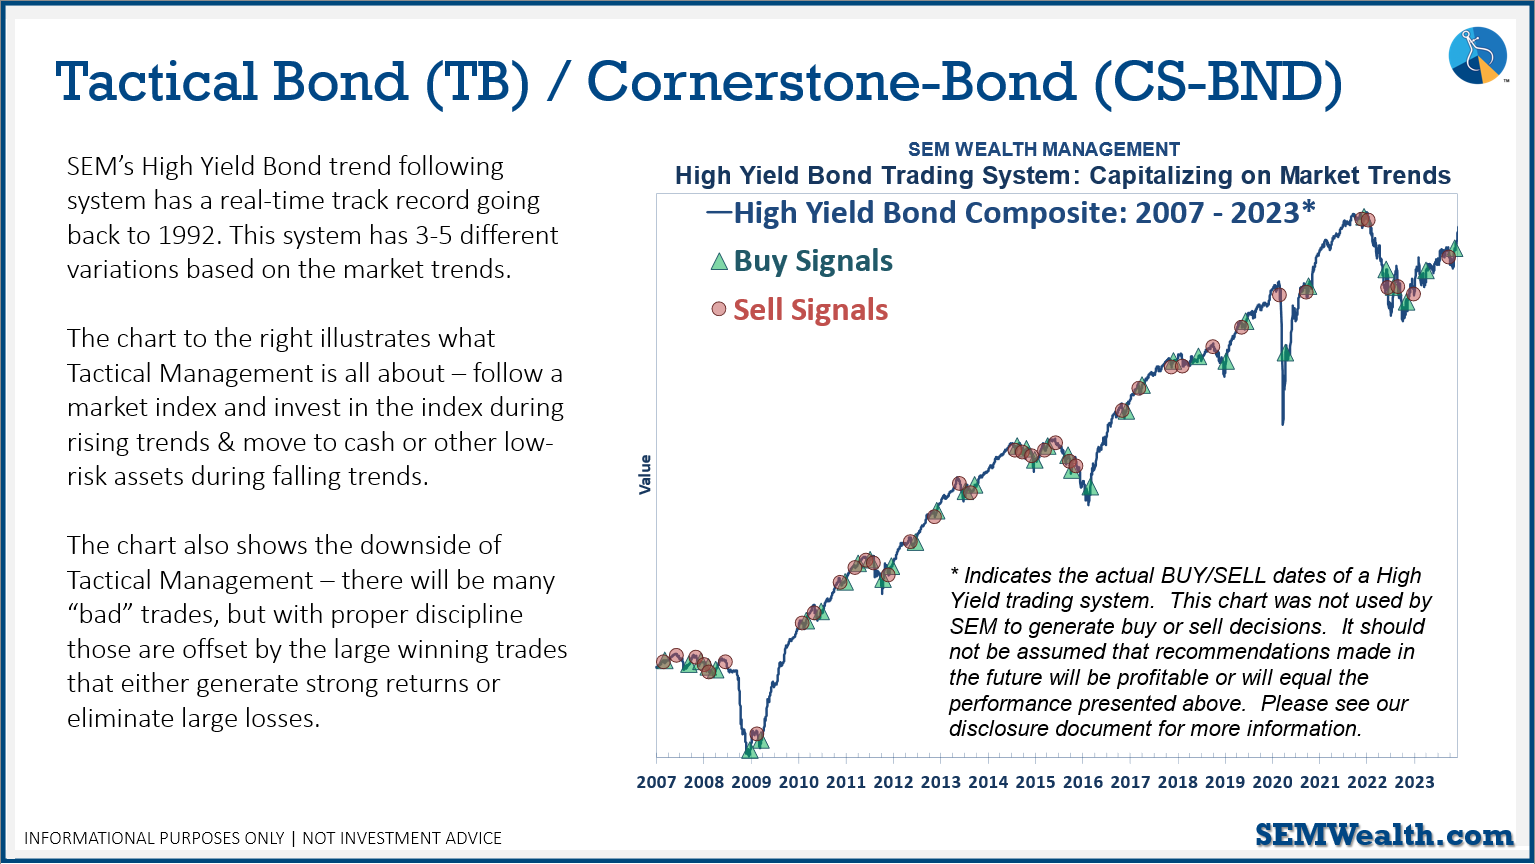
-Tactical High Yield went on a buy 11/3/2023
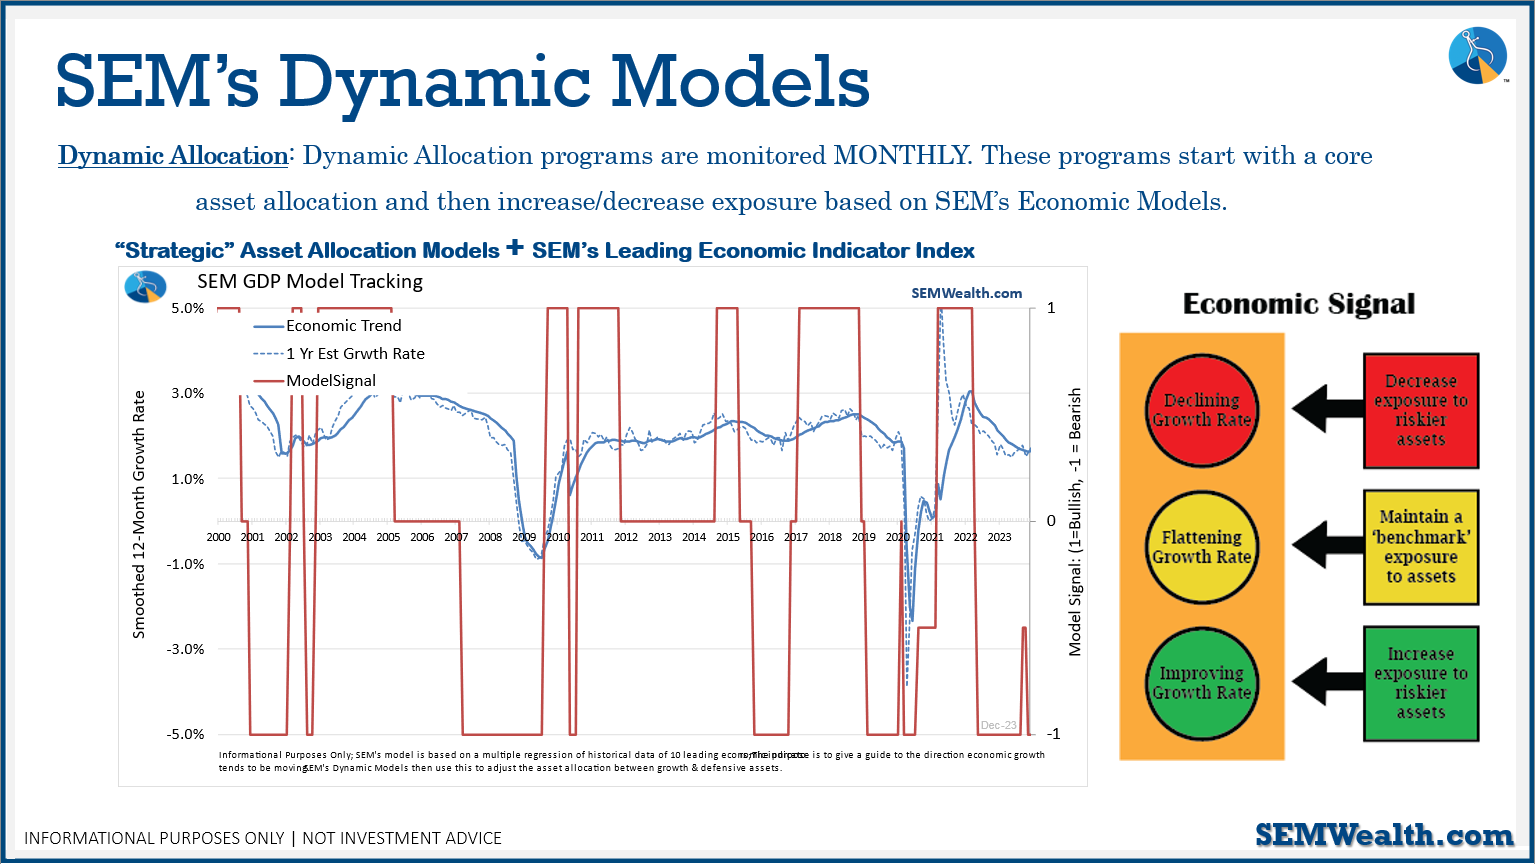
-Dynamic Models reverted back to 'bearish' 12/8/2023
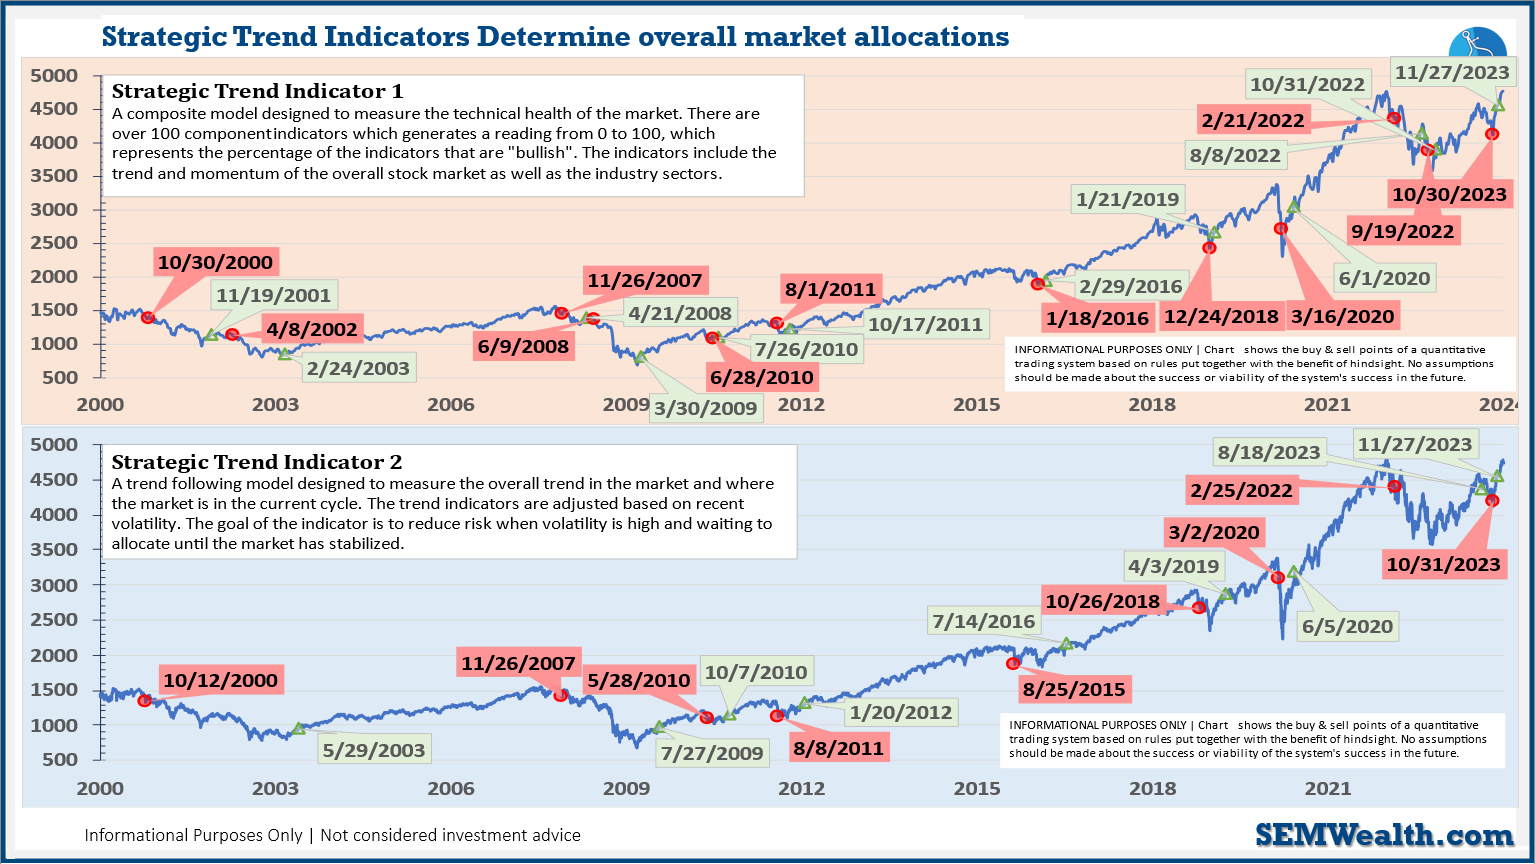
-Strategic Trend Models went on a buy 11/27/2023
SEM deploys 3 distinct approaches – Tactical, Dynamic, and Strategic. These systems have been described as 'daily, monthly, quarterly' given how often they may make adjustments. Here is where they each stand.
Tactical (daily): The High Yield Bond system bought the beginning of April and issued all 3 sell signals 9/28/2023. All 3 systems were back on buy signals by the close on 11/3/2023. The bond funds we are invested in are a bit more 'conservative' than the overall index, but still yielding between 7.5 -8.5% annually.
Dynamic (monthly): At the beginning of October the model moved slightly off the "bearish" signal we've had since April 2022. At the beginning of December it reverted back to "bearish". This means no positions in dividend stocks (Dynamic Income) or small cap stocks (Dynamic Aggressive Growth).
Strategic (quarterly)*:
BOTH Trend Systems reversed back to a buy on 11/27/2023
The core rotation is adjusted quarterly. On August 17 it rotated out of mid-cap growth and into small cap value. It also sold some large cap value to buy some large cap blend and growth. The large cap purchases were in actively managed funds with more diversification than the S&P 500 (banking on the market broadening out beyond the top 5-10 stocks.) On January 8 it rotated completely out of small cap value and mid-cap growth to purchase another broad (more diversified) large cap blend fund along with a Dividend Growth fund.
The * in quarterly is for the trend models. These models are watched daily but they trade infrequently based on readings of where each believe we are in the cycle. The trend systems can be susceptible to "whipsaws" as we saw with the recent sell and buy signals at the end of October and November. The goal of the systems is to miss major downturns in the market. Risks are high when the market has been stampeding higher as it has for most of 2023. This means sometimes selling too soon. As we saw with the recent trade, the systems can quickly reverse if they are wrong.
Overall, this is how our various models stack up based on the last allocation change: