
If you just follow the headlines, it feels like we’re in the middle of the next great market boom – SpaceX grabbing attention, AI companies lining up for IPOs, companies gaining 20-40% in one day after a strong quarterly earnings report, and record high after record high for the market indexes. It’s easy to get caught up in that mania. It’s also exactly what markets tend to feel like late in the cycle.
Step back from the excitement, though, and the data tells a more measured story. This has already been one of the longer and stronger bull markets on record. Investor exposure to stocks is at all-time highs, valuations are stretched relative to the economy, and leverage is creeping back into the system. None of that guarantees an immediate downturn, but it does suggest we should be thinking less about chasing returns and more about protecting what’s already been earned.
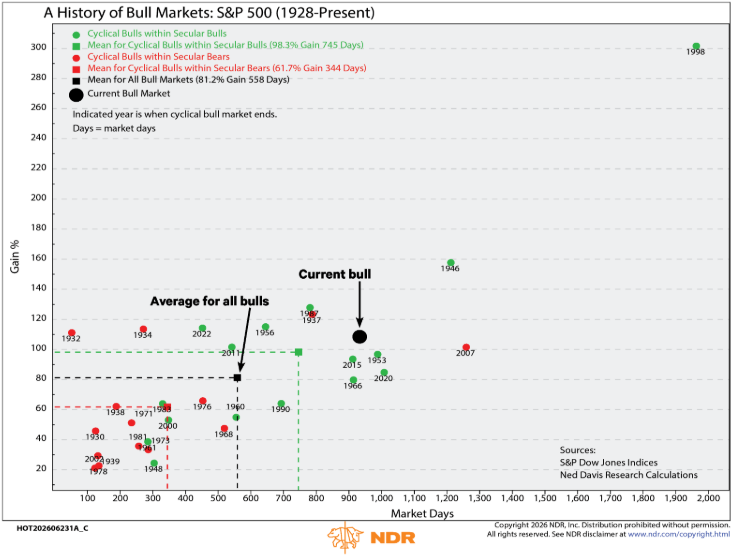
Last week, Ned Davis Research had a great report documenting from a data perspective where we are relative to past market peaks. They gratuitously allowed me to share some of their charts. Given the amount of posturing I'm seeing between the bulls and the bears the last few weeks, I think this is timely.
We are well past the average duration and gain for a cyclical bull market. Only 5 bull markets have lasted longer than the current bull. Just 8 had returns higher than we've enjoyed since the bottom in 2009. However, the 1990s bull ran twice as long and posted triple the returns we've had thus far.
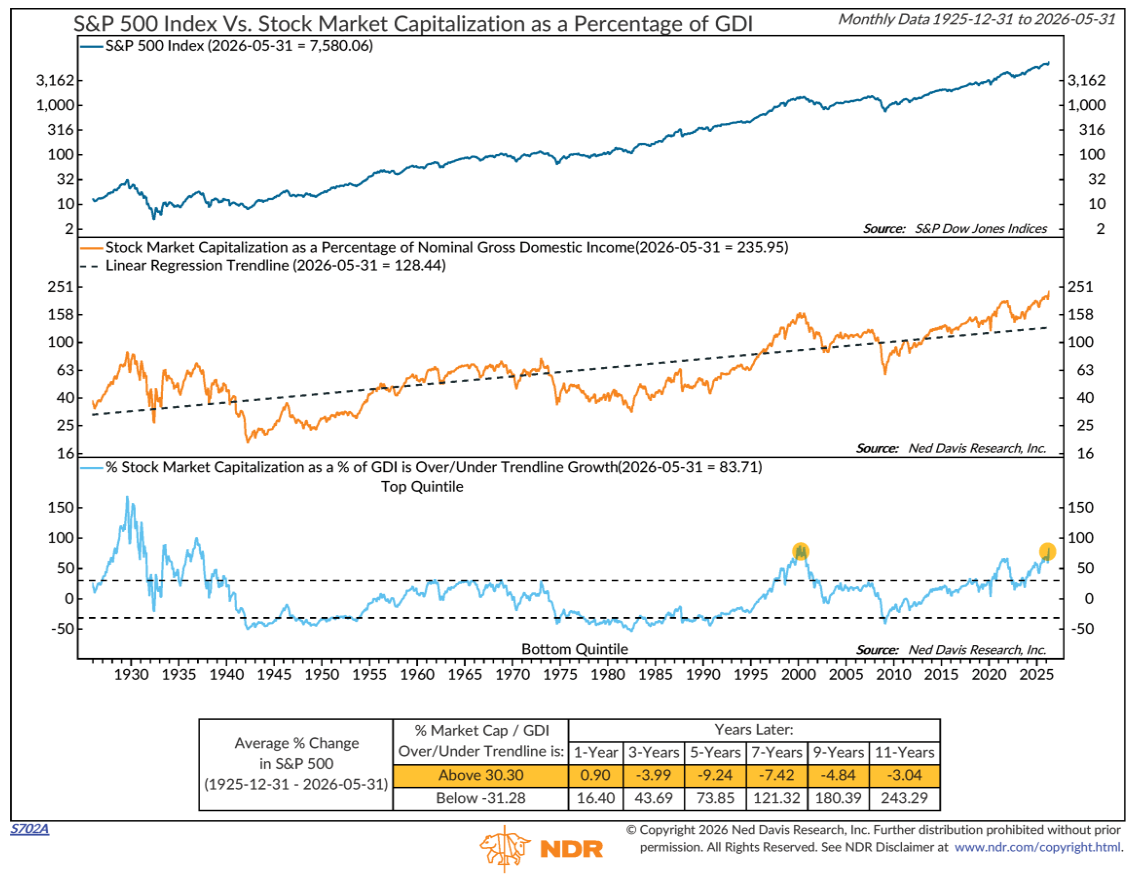
The stock market relative to the economy is at levels which were previously unsustainable.
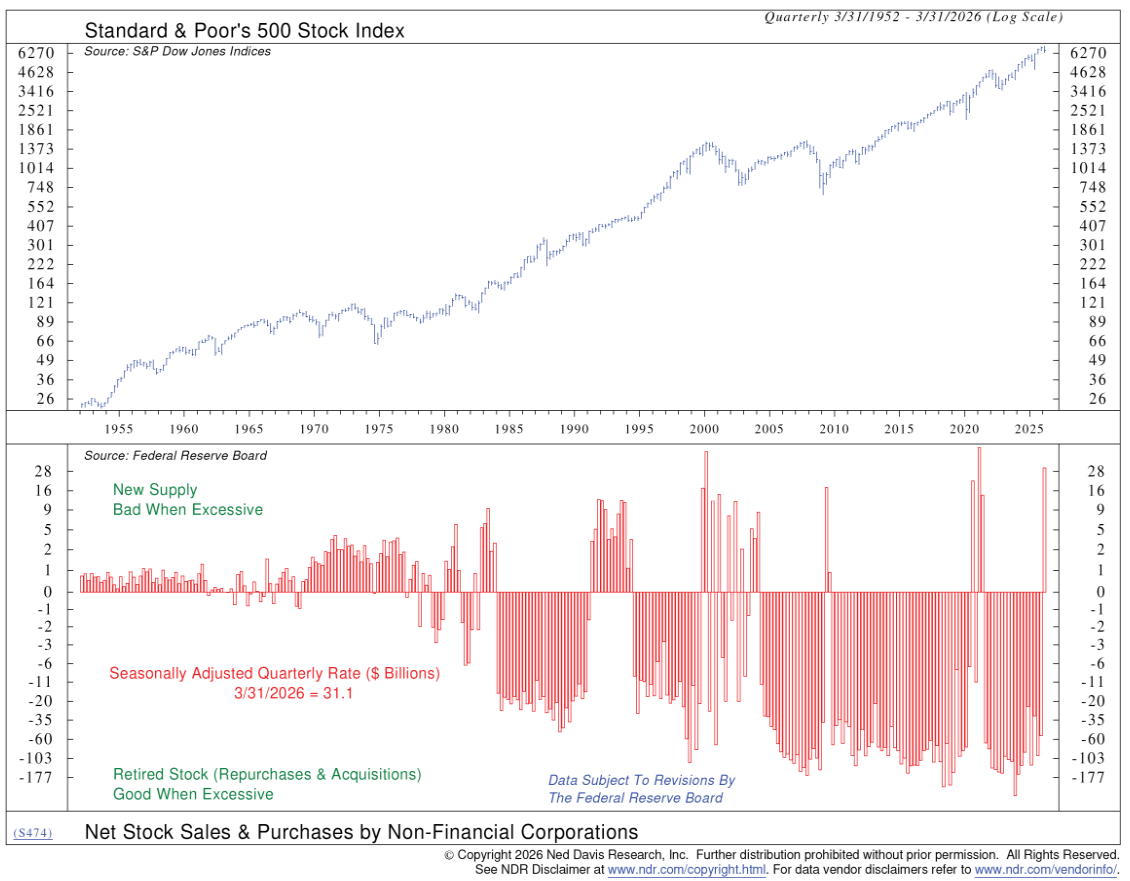
While everyone was paying attention to the SpaceX IPO and the upcoming Anthropic and Open AI offerings (the latter is now rumored to be pushed to 2027 due to concerns over the 'demand' for tech stocks), the net issuance of stocks shows the change from companies buying back their shares to now raising cash be selling shares. That typically is bad for the stock market.
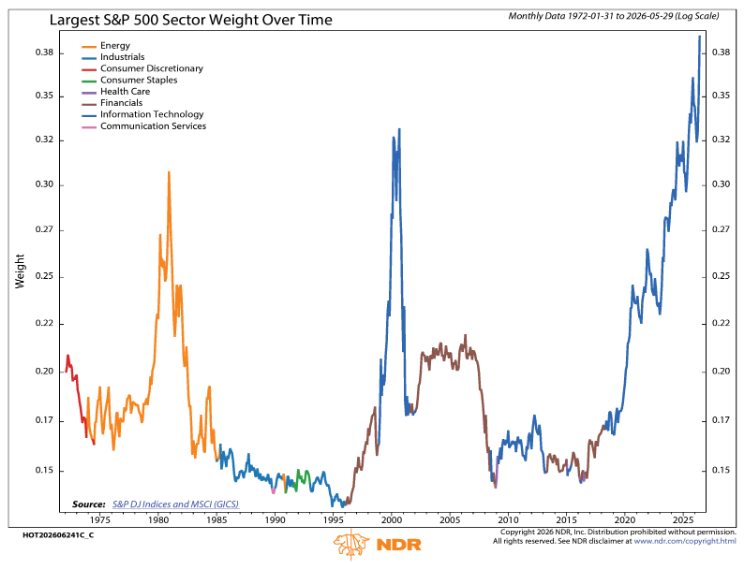
In 2024 we started warning about the dangers of over concentration around one sector, in this case technology. While so far that has not mattered as technology continues to drive stocks higher, historically when one sector becomes too much of the overall market, it is bad for the overall market.
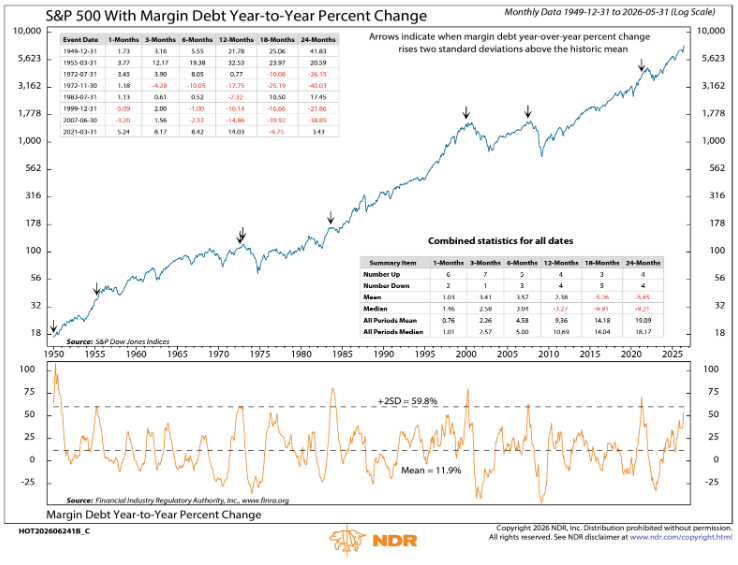
Investors have also been borrowing money to buy more stocks (margin debt). Margin debt is at an all-time high and the 12 month percentage change is again closing in on past peaks in the market.
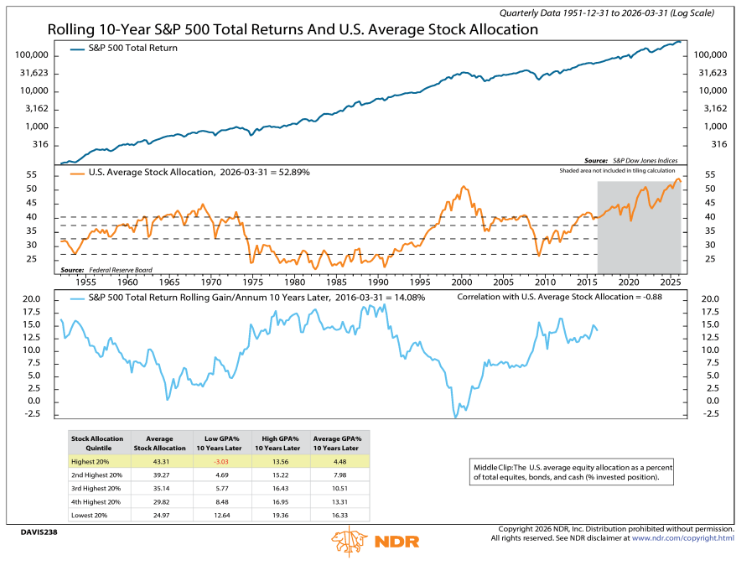
Probably a bigger concern than margin debt is the overall Average US Household stock allocation, which is now at an all-time high. We can see from the chart below the prior peaks in the late 1960s & 2000 (the middle panel) as well as the inverse correlation to the subsequent 10-year returns (the bottom panel).
This goes along with a recent Vanguard report studying how America saves, also gave a warning about the record high allocations investors at or near retirement age have invested in the stock market. For instance, 60-64 year olds have on average 64% of their portfolios in the stock market. Based on history, that 64% could lose half its value and take 7-10 years to recover. Assuming bonds were flat, that would be a 32% drop in the value of the account. For somebody planning on retiring by age 70 that is planning on using their investments to provide retirement income, that could be the difference between having a safe, secure retirement and not being able to fully retire at all.
Vanguard's recommendation for that group is 48% equity for 60-64 year olds. They also recently suggested due to high stock valuations and attractive bond yields, retirees shift from a 40/60 to a 30/70 portfolio. The average 65+ year old at Vanguard currently has 50% of their portfolio in stocks (or 20% more than they are recommending.)
One thing I keep emphasizing to anybody who will listen – over the last 1, 3, 5, 10, and even 15 years, the stock market has enjoyed returns significantly above the long-term averages. This should be looked at as a BONUS. Rather than taking on more equity exposure (or reducing the risk management from SEM in your account), perhaps it would be prudent to take this "bonus" money and REDUCE the equity exposure (or add more risk management) to LOCK IN those bonus returns. With history as a guide, it is likely in the next 3-5 years (or sooner) we get a "mean reverting" event where those above average years turn into below average years, taking the long-term averages right back to where they have been for the last 30, 50, and now 100 years (10% annually for stocks.)
What to think of SpaceX?
One thing I've been saying throughout the year based on my experience in the 90s is the thing that could likely burst the AI bubble we've been enjoying is a failure from a big name, highly anticipated IPO. My thought, which I still have is this will come after a surprisingly disappointing quarterly report from one of them. Remember, private companies do not have to report earnings, so SpaceX, Anthropic, and OpenAI are used to only being evaluated when they want to raise more money by selling more stock. The financials they disclose in those private offering documents are nowhere near the standards of a public company.
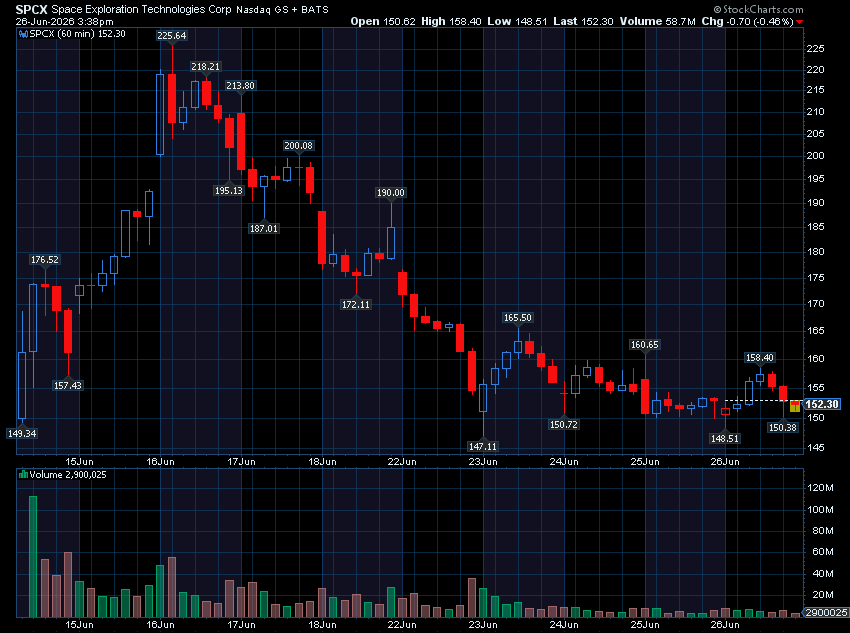
One other possibility is a big-name IPO going "under water" and staying there. SpaceX isn't there yet, but for everyone who was rushing to get into the stock after it opened last Friday hindsight tells us they could have waited for things to settle down. Although still volatile, the stock seems to have settled the last 3 days last week right around the original opening price. Keep in mind, the IPO price (what the initial investors paid) was $135, so they are still up around 11%.
If SpaceX doesn't go back up like a rocket, that may dampen the enthusiasm for the next "big" IPO. OpenAI, the creator of ChatGPT hinted already they may postpone their IPO until 2027, which would leave Anthropic as the next "big" thing.
By the way, this should not be considered investment advice. SEM does not analyze or recommend individual stocks. These are merely my observations. The way I have been describing SpaceX is – big risks, big potential rewards. Some people may have the appetite and capacity in their investment portfolios to take a little nibble if that's their thing. Some do not. That's why all disclaimers end with, "please consult your financial advisor prior to making investment decisions." Only your financial advisor knows your situation.
Is SpaceX in Your Index Fund?
Late on Friday NASDAQ confirmed SpaceX would be entering the NASDAQ 100 index on July 6, which means owners of the popular QQQ ETF and any index fund tracking that index will automatically have a position after that day.
NASDAQ twice changed their rules to win the SpaceX IPO and to get it into their index. First they removed their "seasoning" rule (waiting a certain amount of time for trading to settle down) for "hot" IPO issues. They ten added a "float multiplier" in an attempt to get a company like SpaceX which has only 4% of its shares currently trading to be a bigger portion of the index. Even with that, SpaceX will be a little less than 1% of the NASDAQ 100 or somewhere in the mid-teens in the holdings ranks.
Russell also changed its rules to allow SpaceX into their indices (in this case the Russell 1000 Blend and Growth indexes). Even though the "float" does not yet exceed their 5% threshold, Russell added them to those to indices at the close on Friday. Unlike NASDAQ, Russell did not add a float multiplier to boost SpaceX's allocation, so with just 4% of the shares outstanding available, SpaceX is a mere 0.1% of the Russell 1000 index (the largest 1000 US based companies in terms of market capitalization.)
In the months ahead, the "float" for SpaceX will increase significantly as employees and early investors have their restrictions lifted. SpaceX has a planned rolling release of the lock-up, mostly timed around earnings releases and specific calendar triggers. Elon's 42% of the shares (and his 80% of the voting rights) are locked for the first year of trading, which impacts the float adjustments used by the index providers. As it is currently scheduled, here is the changes to the float for SpaceX.
| Time | Float % (approx) |
|---|---|
| Today (June 2026) | ~4–5% |
| Aug 2026 | ~8–10% |
| Sep 2026 | ~20–25% |
| Nov 2026 | ~40–50% |
| Dec 2026 | ~60–70% |
| Mid-2027 (full unlock) | ~100% |
What this means for Russell and NASDAQ 100 index holders is you will see a greater and greater percentage of your index fund going to SpaceX. The 60-70% float by the end of the year would make SpaceX just inside the top 10 with a 2% position (assuming the price stays around the same level it is at today.) SpaceX would become a 3-5% position in the QQQ ETF, right around where Broadcom, Meta, and Tesla are currently.
The one index provider that refused to change their rules was S&P. S&P stuck to their "seasoning", "float", and "profitability" rules. SpaceX will surpass the "float" rules by September. S&P does not have a "fast-track" for IPOs, so the "seasoning" won't happen until June 2027. One of the biggest obstacles, however for SpaceX, is S&P's profitability rules. In order to be included in the index, a company must both post POSITIVE net income for the most recent quarter AND have POSITVE net income for the trailing 12 months.
During the most recent quarter SpaceX generated around $4.6B in revenue, but lost $4B overall. In 2025 they lost nearly $5B on $18B in revenue. They did make $0.7B in 2024 according to their filings. Starlink is generating lots of cash for SpaceX, but not enough for Elon's Starship division, and especially the xAI segment (which conveniently absorbed the money losing Twitter division and then was conveniently merged into SpaceX prior to the IPO.) Based on the fact SpaceX announced a $25B bond offering shortly after it raised $75B in its IPO, I'd venture to guess SpaceX is still burning through cash faster than Starlink can generate it.
Maybe it's good, or maybe it's bad to bend the rules or not. This has actually led to me having a greater understanding of the differences between the Russell and S&P rules and why those indexes may deviate at various points in the market cycle (since Russell does not require profitability to enter its indexes and S&P does).
What isn't like 1999
Despite companies beginning to tap the equity and debt markets much more heavily to pay for their AI investments, the biggest difference right now from the 1990s peak is the fact that overall the S&P 500 companies have been able to finance their capital expenditures with their internal funds.
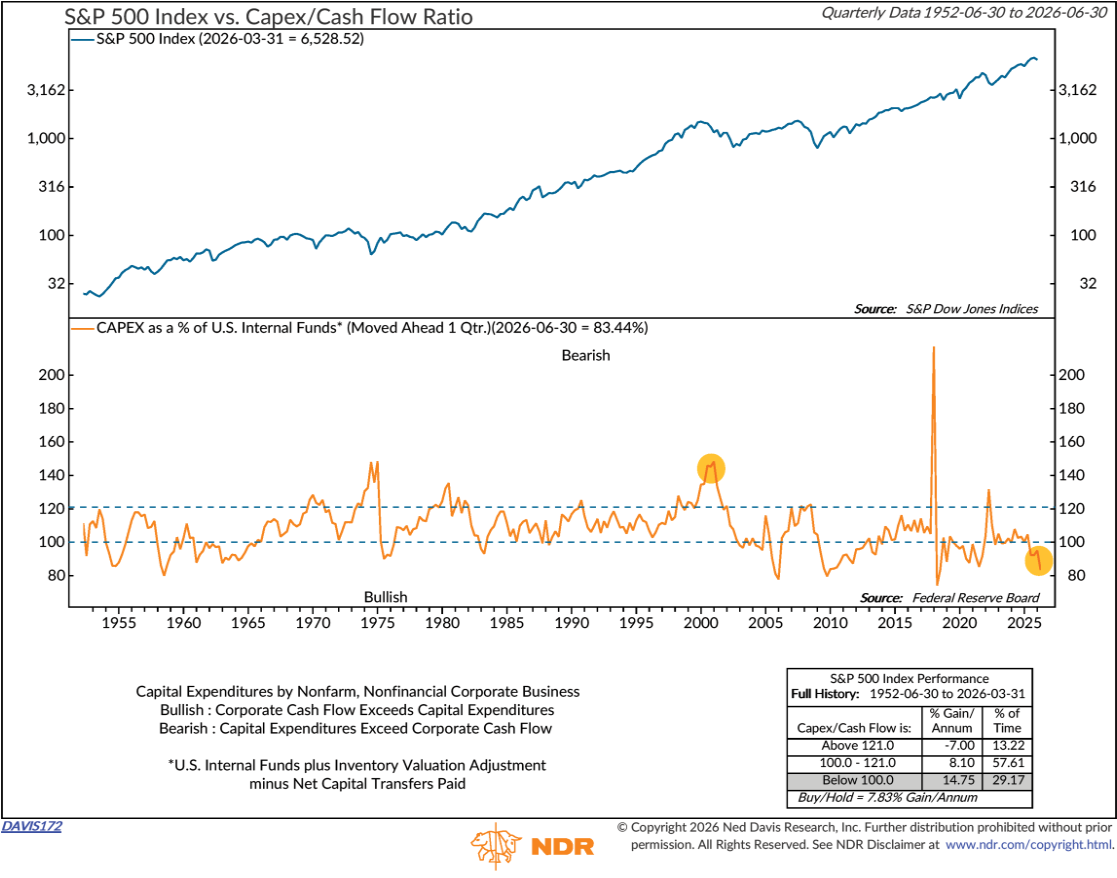
That doesn't mean we are in the clear, but simply the largest companies' ability to fund CapEx with cash flows gives those specific companies a longer runway. However, with investors holding record high allocations to stock, a high level of margin to hold those stocks, the market capitalization nearly surpassing our economic output, and technology stocks representing nearly 40% of the market, caution is most certainly warranted.
For our part, our models remain divided. On the bond side, Tactical Bond and Income Allocator remain heavily invested in high yield bonds as the trend continues to tick higher. If those bonds turn lower it is historically a good warning sign for the rest of the economy and thus the stock market. AmeriGuard and Cornerstone's trend indicators both remain fully invested. Our economic model remains "neutral", which leaves our Dynamic models holding their benchmark allocations.
The only real warning we are receiving is from our Enhanced Growth Allocator model, which is down to just 40% equity exposure, a far cry from the leverage adjusted 125% exposure it carried most of the year. The warnings have come over the past month as the new highs from the major indices has not been confirmed by the underlying market. This model is designed to be early and signals like this are not always perfect. It warrants our attention given the strong performance EGA has enjoyed over the past 12-15 months as it remained heavily exposed to stocks.
Stay tuned.
Market Charts
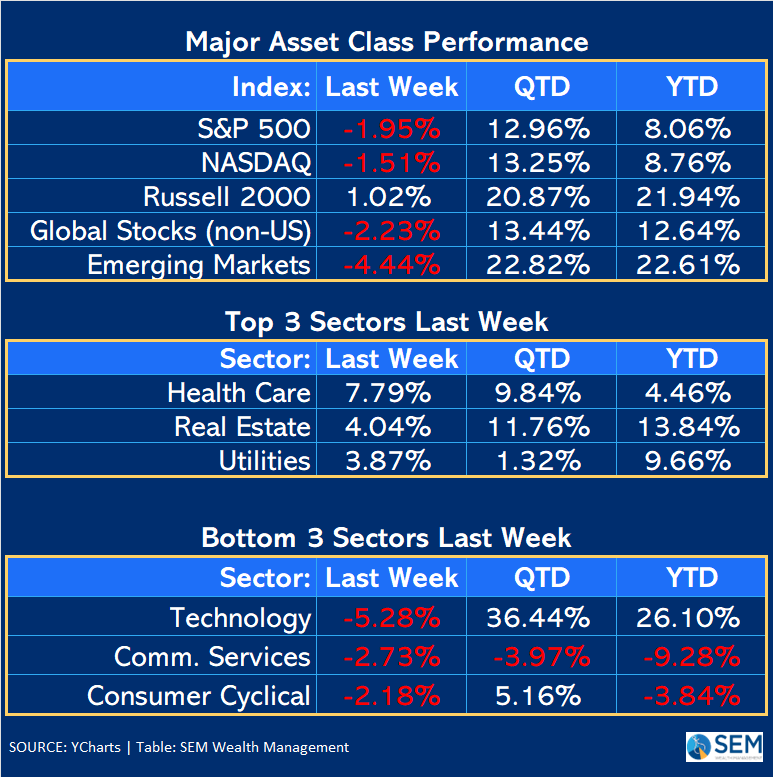
It was another generally down week for the stock market, although the Russell 2000 small cap index posted its best relative performance against the S&P 500 since 2020. As I mentioned many times since last fall, a broadening market, where the beneficiaries of the AI and other spending see their stocks go up and the ones SPENDING the money on AI go down isn't necessarily a bad thing. A narrow market is a risky market so the more we see "everyone else" outside of the "Mag-7" go up, the better it is for all of us (unless you don't have a diversified portfolio.)
The negative slide that began last week continued throughout the week.
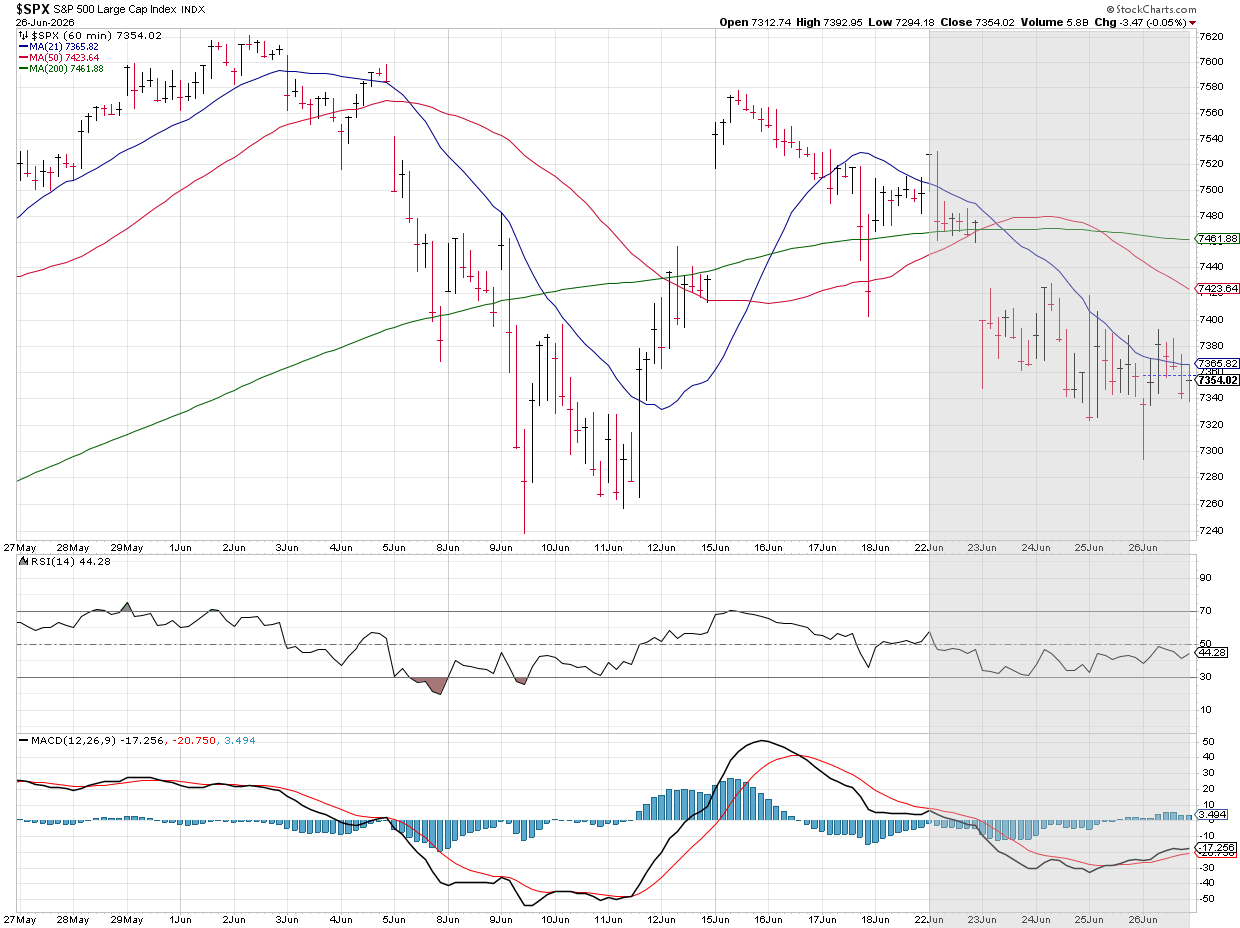
With the benefit of hindsight, we can see Broadcom's disappointing outlook after the close on June 3 flipped the script on the AI rally. Remember, anything related to AI had a furious rally in May, but Broadcom not raising their full year guidance and the stock getting crushed should have been a warning that the market was way too optimistic about AI-related growth. Micron, despite impressive earnings also 'disappointed' when they mentioned that the memory cycle may peak sooner than expected (as companies find ways around the memory crunch). Add in Apple and Microsoft raising prices on consumer products due to high chip and memory costs and the "everybody" wins trade that dominated in May (and really for the better part of the last 3 years) has at least temporarily been called into question.
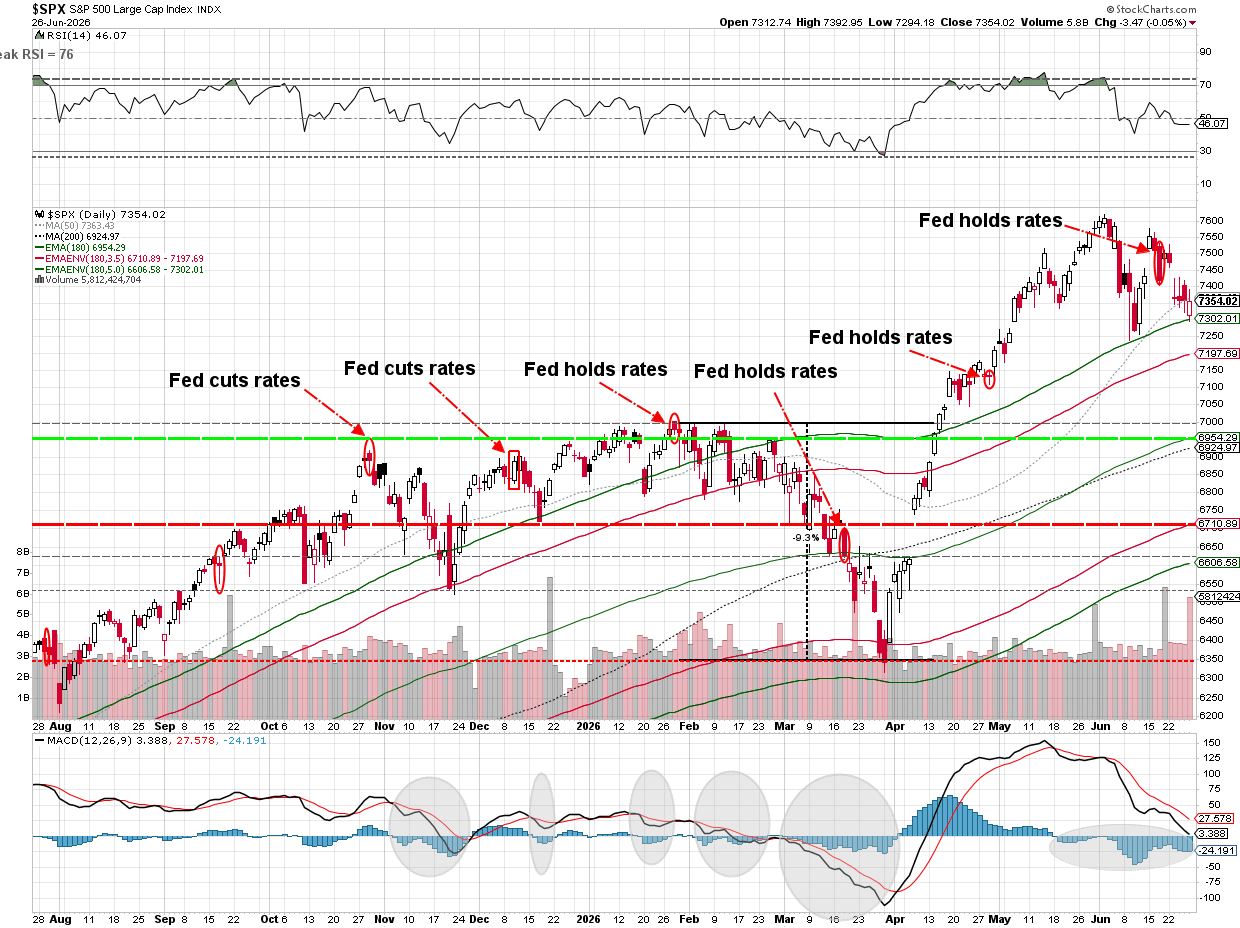
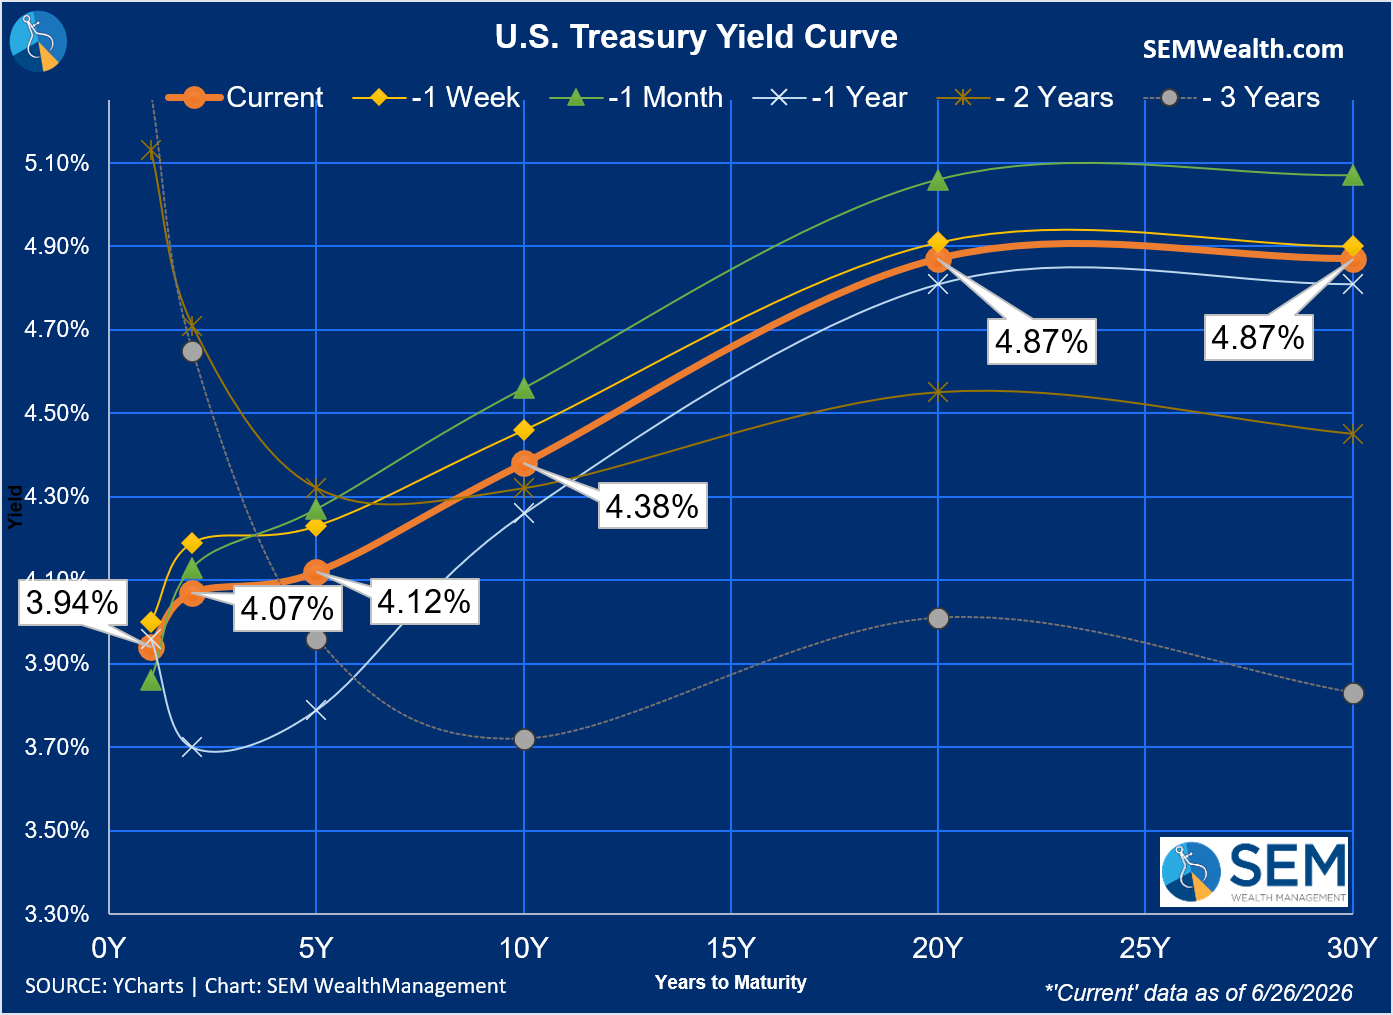
Inflation, a stabilizing labor market, and the Fed's "new" posture on interest rates also hasn't helped. Remember the lesson from 2022 – higher interest rates CRUSH growth stocks — please don't make me pull out my whiteboard videos explaining the sensitivity to interest rates based on the expected growth rates.
Interestingly enough, the free market has LOWERED interest rates since the Fed meeting (remember, the Fed only sets the shortest term rates – the market sets everything else.) I fully believe this is because the bond market was pleasantly surprised to hear the new Fed Chair talk about controlling inflation as their first priority. Remember – nothing destroys the value of your interest payments faster than inflation.
All in all, we have an interesting market as we head into the hottest part of the year.
SEM Market Positioning
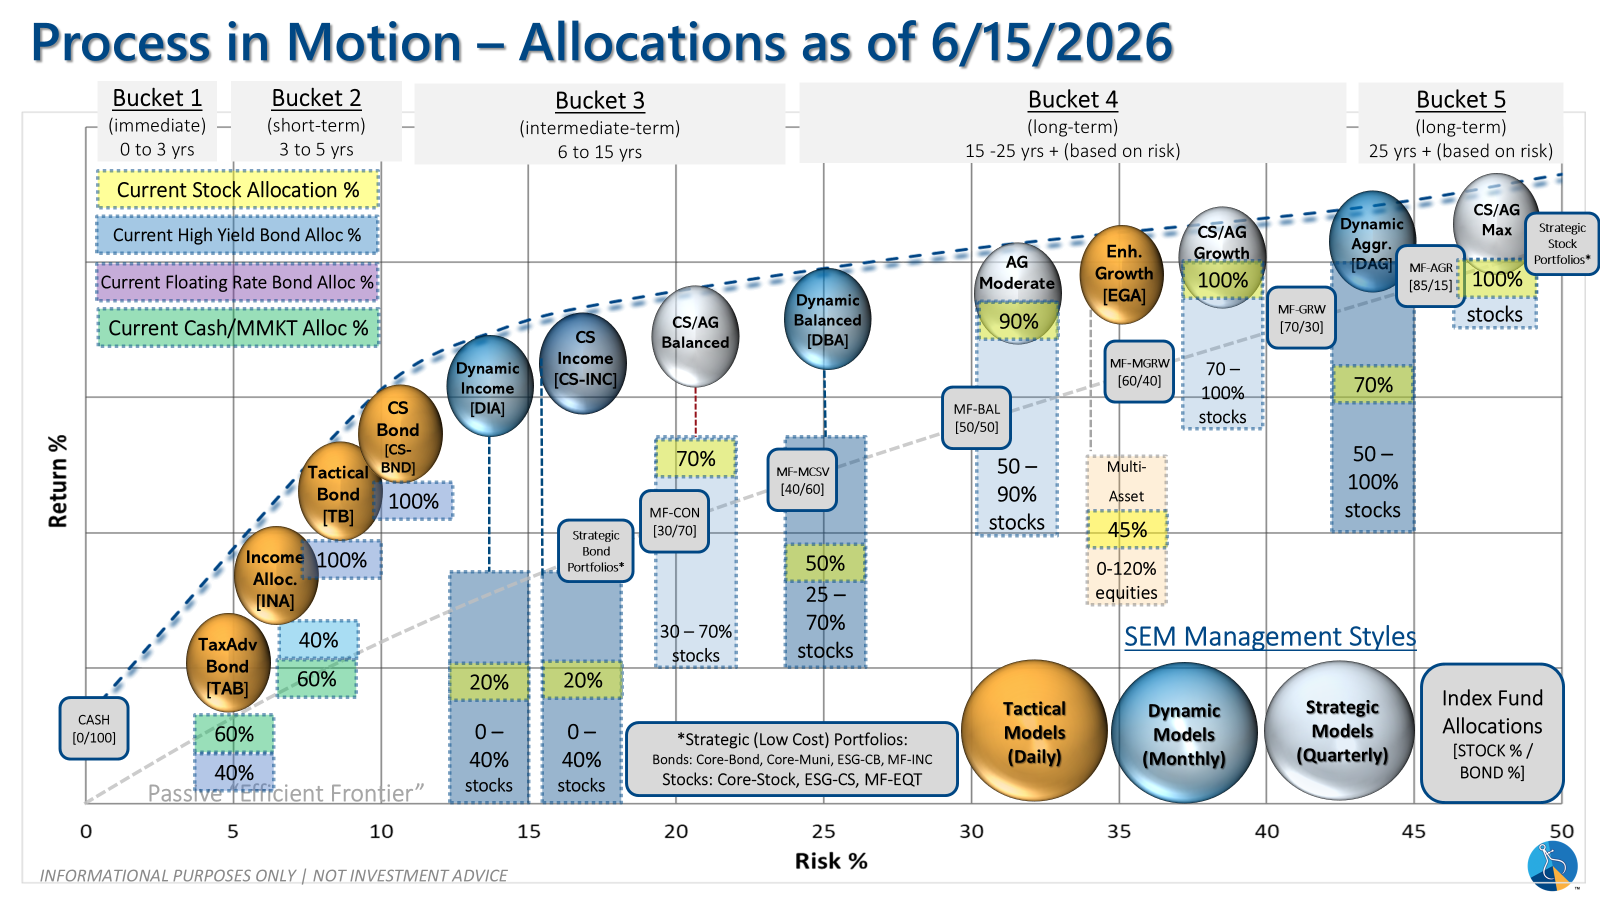
SEM deploys 3 distinct approaches – Tactical, Dynamic, and Strategic. These systems have been described as 'daily, monthly, quarterly' given how often they may make adjustments. Here is where they each stand.
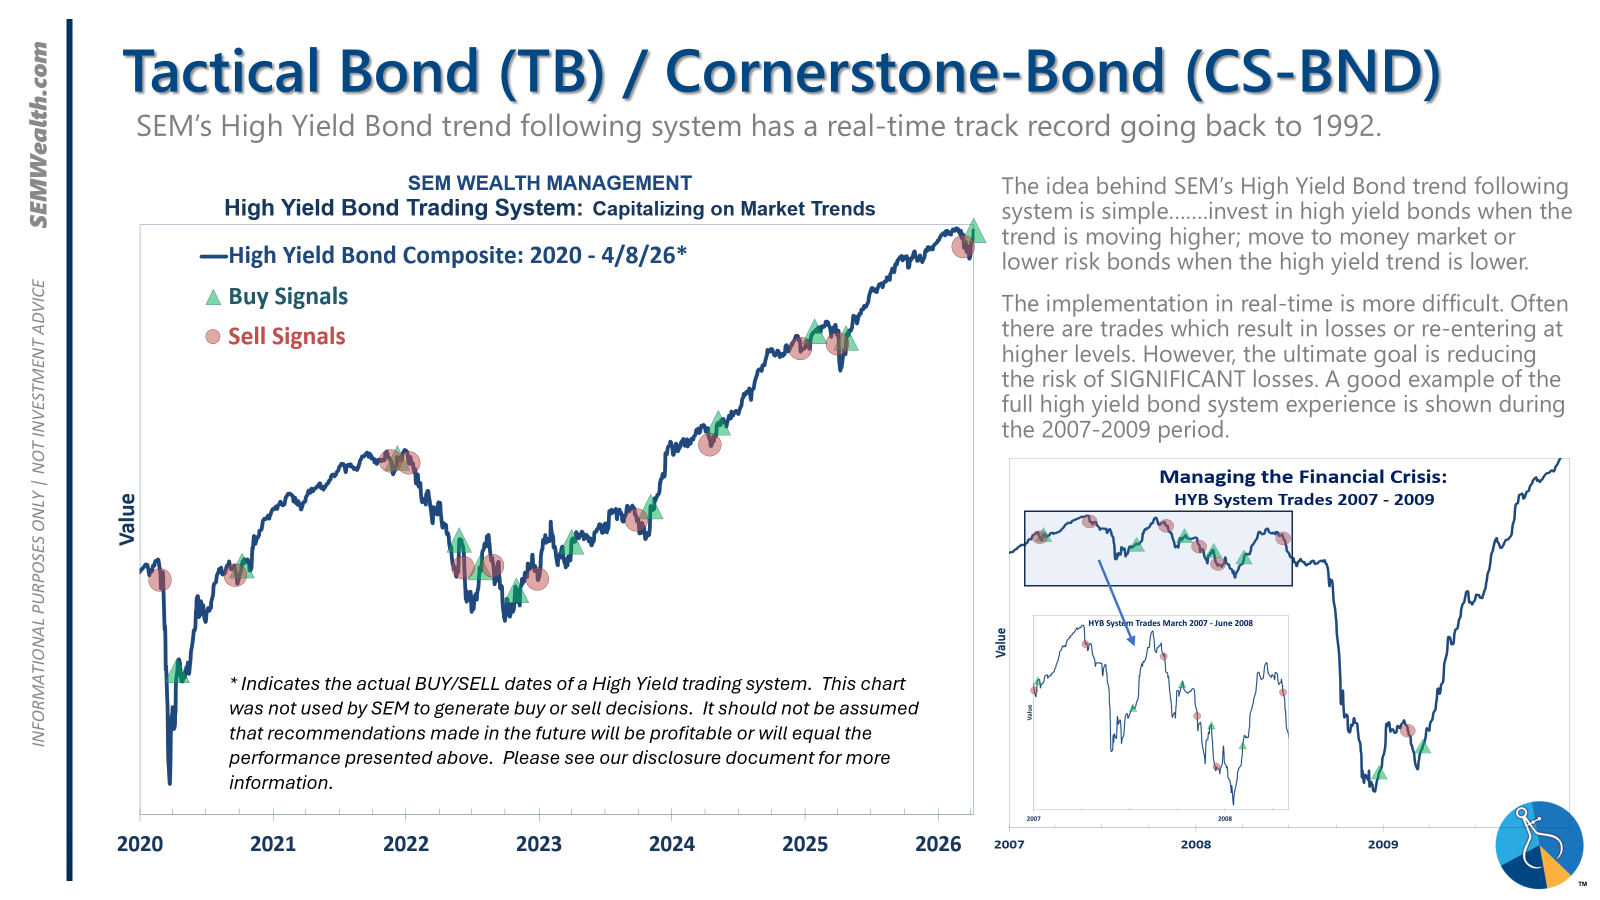
- Tactical = BULLISH | 100% High Yield Bond (4/8/2026) | High-yield spreads remain narrow but trend is slightly higher
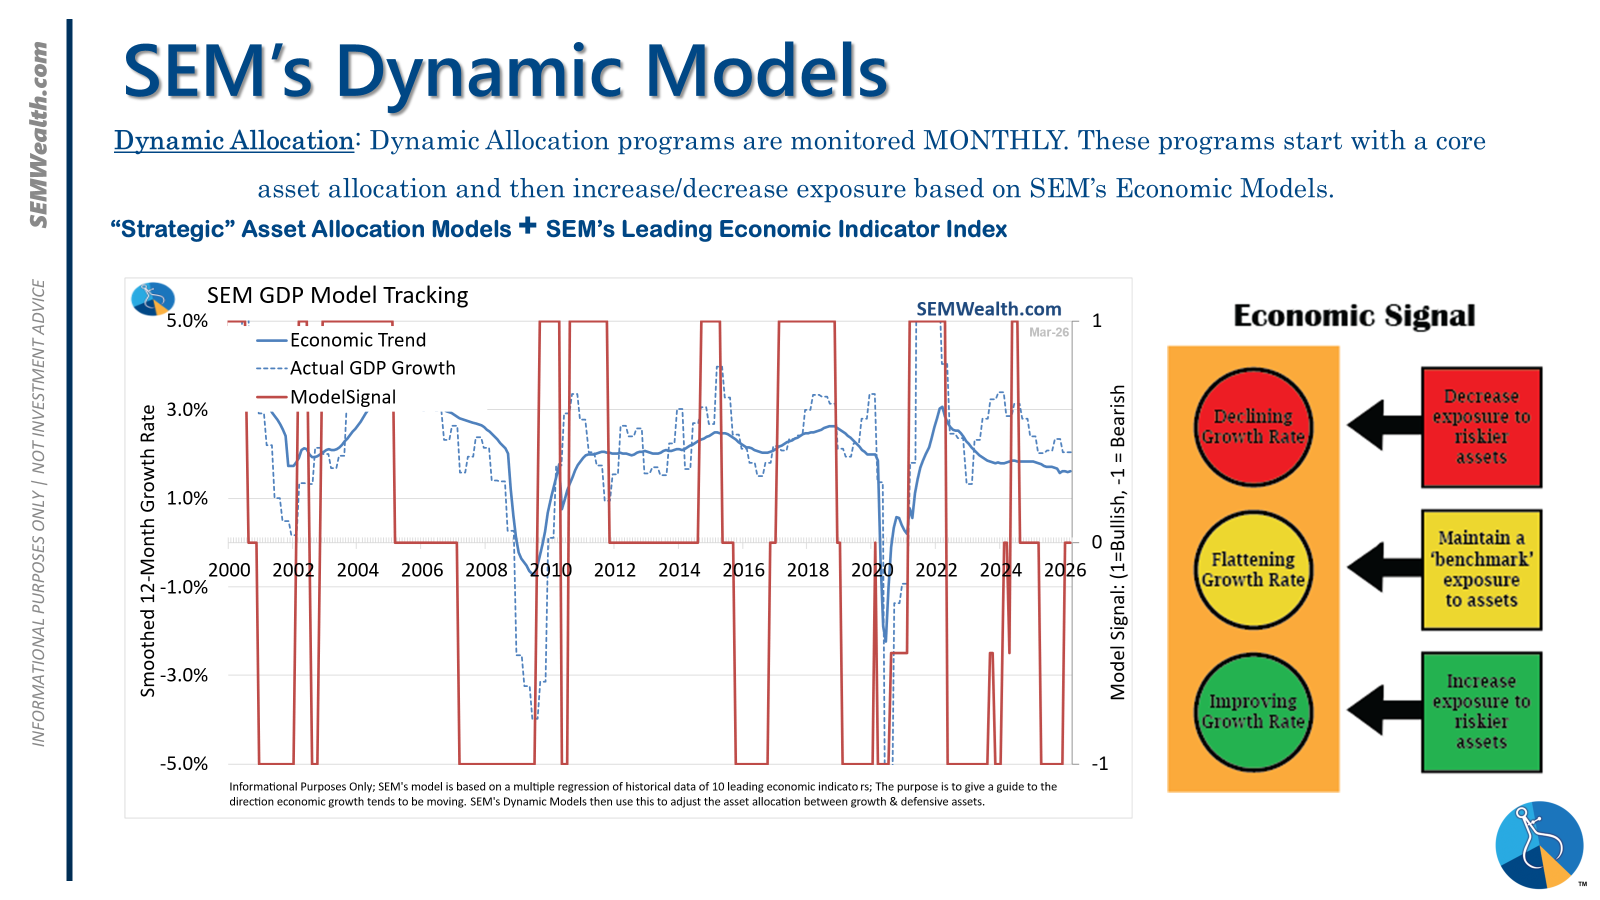
- Dynamic = NEUTRAL (2/15/2026) | "Benchmark" Allocation | Economic model inconclusive
- Strategic = BULLISH (4/15/2026) | V-Bottom projecting "end" of Iran War
Tactical (daily):
- Monitored DAILY
- Models: Tactical Bond, Cornerstone Bond, Income Allocator, Tax Advantaged Bond
- Designed to follow the trends for use in our lower risk models
- BUY Signal issued April 8, 2026 (exiting the sell from March 13)
Dynamic (monthly):
- Monitored MONTHLY
- Models: All "Dynamic" Models (Income, Balanced, Growth, and Asset Allocator)
- Uses SEM's Quantitative Economic Model
- Designed to overweight riskier assets if economic trend is higher & underweight those assets if economic trend is lower.
- NEUTRAL signal issued February 15, 2026 (following BEARISH signal from July 2025)
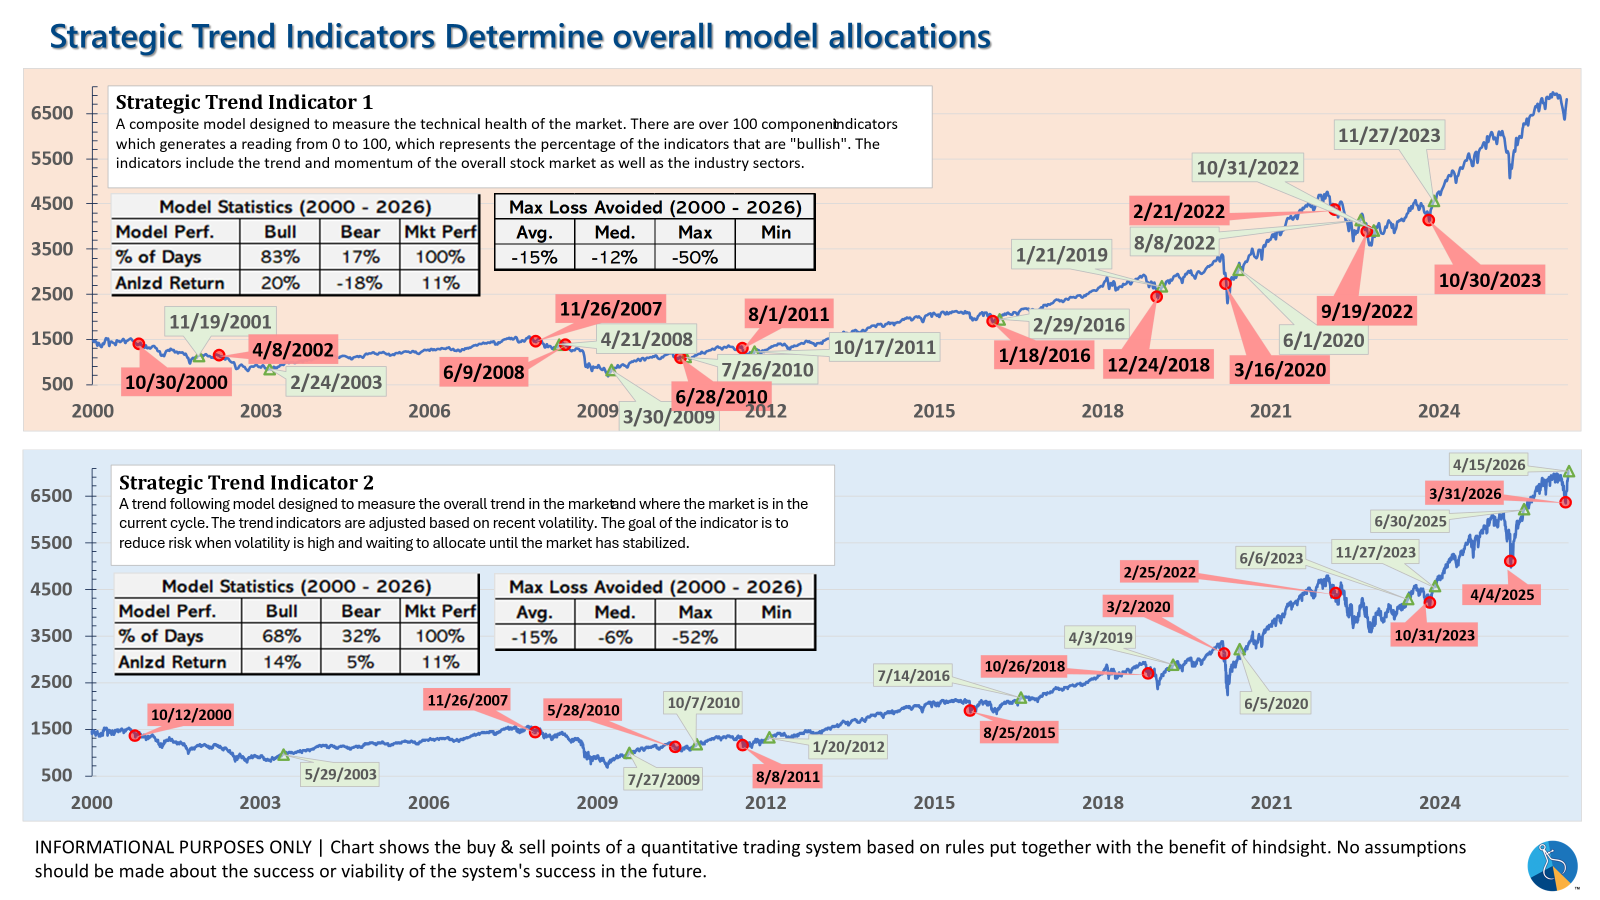
Strategic (quarterly)*:
- Monitored QUARTERLY
- Models: AmeriGuard (Balanced, Moderate, & Growth) and Cornerstone (Balanced & Growth)
- Core Component: Quantitative Filter using 4 different time horizons across universe of asset classes
- Trend Indicator: Two different Quantitative Systems monitoring the intermediate-term trend, health of the market, and volatility
- CORE has been overweight small cap and international since October 2025 – overweight increased slightly in January
- Both TREND INDICATORS are BULLISH following 10% drop and "V-Bottom" reversal in early April
- AmeriGuard & Cornerstone Max DO NOT use the Trend indicator and are always 100% invested in stocks using our CORE rotation model.
The core rotation is adjusted quarterly. This quarter we saw half of our international positions reduced (we sold developed markets and kept our emerging markets exposure). We also saw the remaining share of mid-cap reduced in favor of more small cap exposure. We remain with a "barbell" core portfolio – about half in large cap and half in small cap as the models expect the market to "broaden".
The * in quarterly is for the trend models. These models are watched daily but they trade infrequently based on readings of where each believe we are in the cycle. The trend systems can be susceptible to "whipsaws" as we saw with the recent sell and buy signals at the end of October and November. The goal of the systems is to miss major downturns in the market. Risks are high when the market has been stampeding higher as it has for most of 2023. This means sometimes selling too soon. As we saw with the recent trade, the systems can quickly reverse if they are wrong.
Overall, this is how our various models stack up based on the last allocation change:
Curious if your current investment allocation aligns with your overall objectives and risk tolerance?


