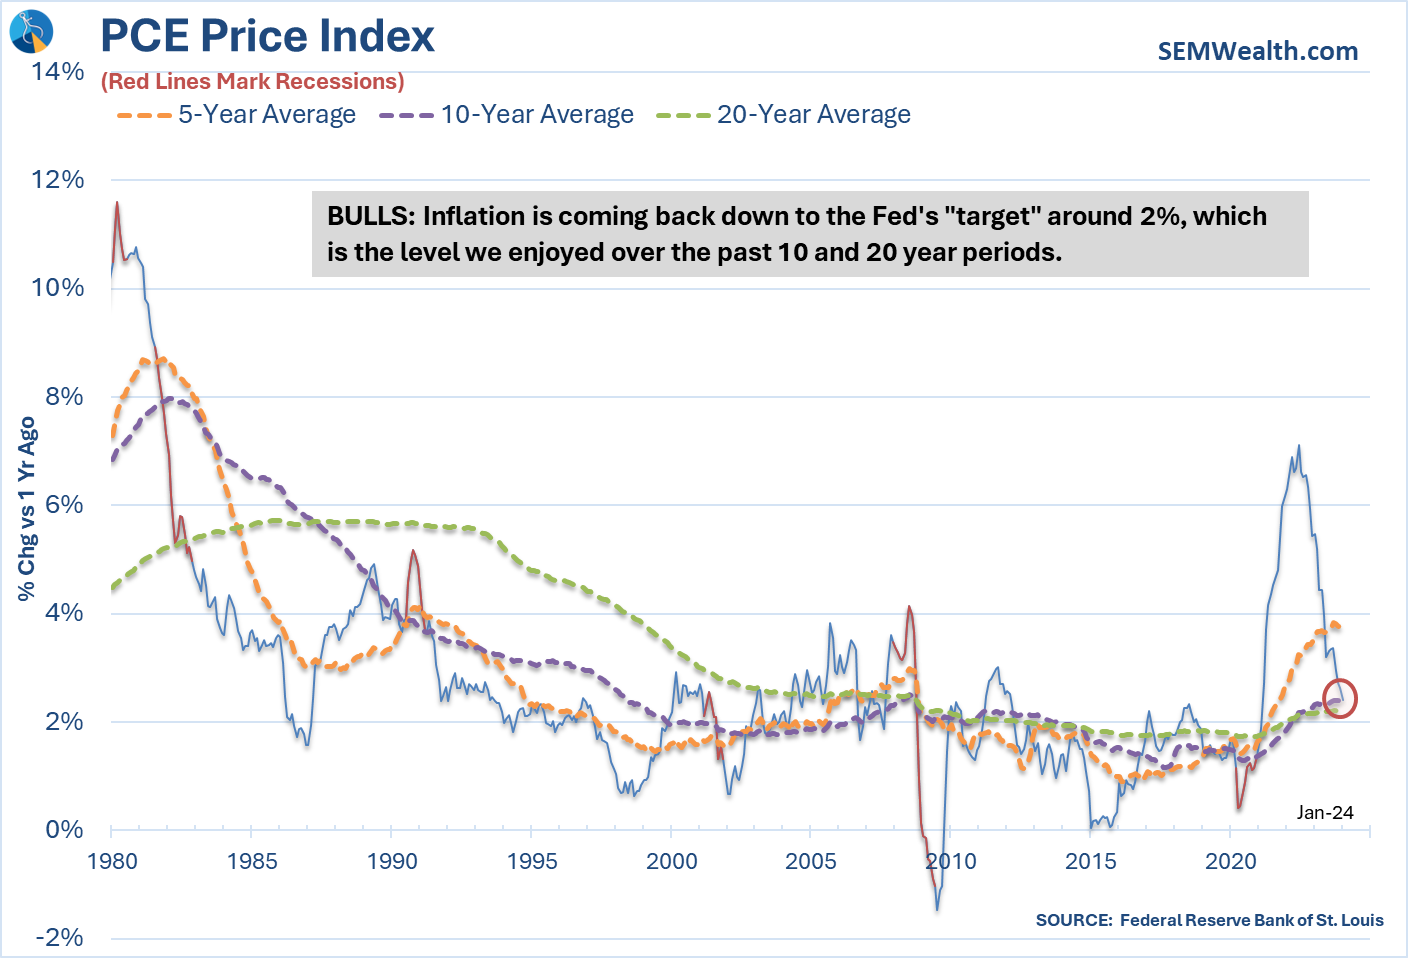
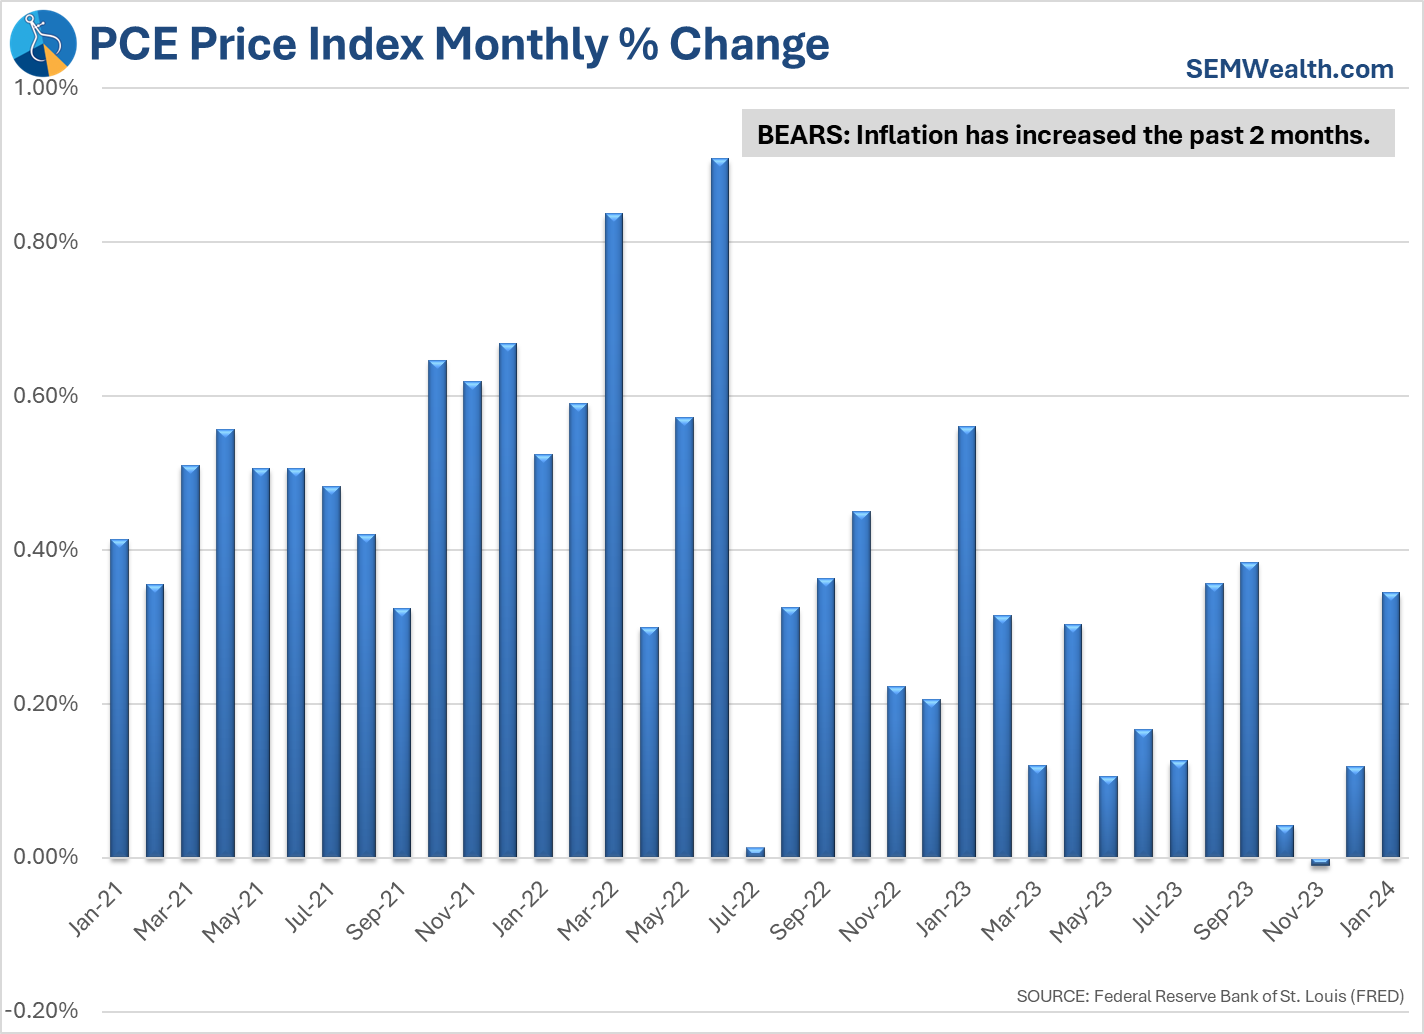
Following the release of the Fed's 'preferred' inflation measure Personal Consumption Index (PCE) Price Deflator last week, both the bulls and the bears had something to point to to make their case. The bulls highlighted the continued decrease in the year-over-year inflation levels (now 2.4% versus 5.2% a year ago). The bears point to an increase in the month-over-month rate of inflation to the highest level since last September.
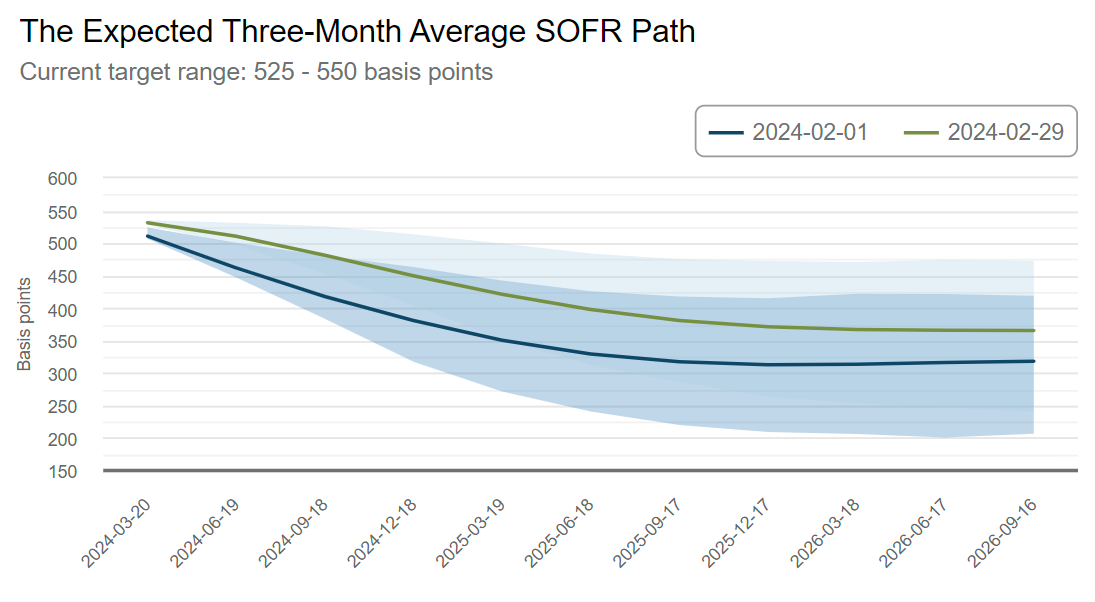
Who is correct? So far the bulls have the most supporters. While the expectations of 6 rate cuts starting in March totaling 1.5% came down following the release of the CPI a few weeks back, the market is still betting on a sharp decrease in rates. Based on the Futures market, the expectations are now calling for the first 25 bp rate cut in June, followed by another 50 bp rate cut in September, and another 25 bp in December.
This chart shows the change in expectations from the beginning of February until the end.
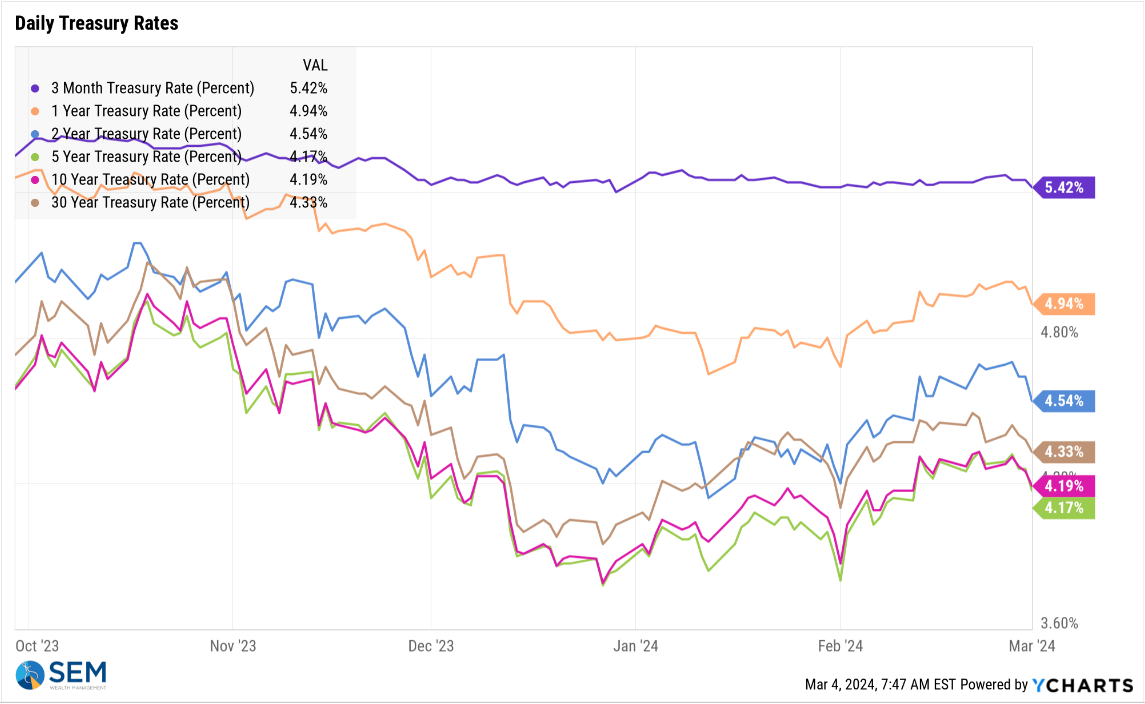
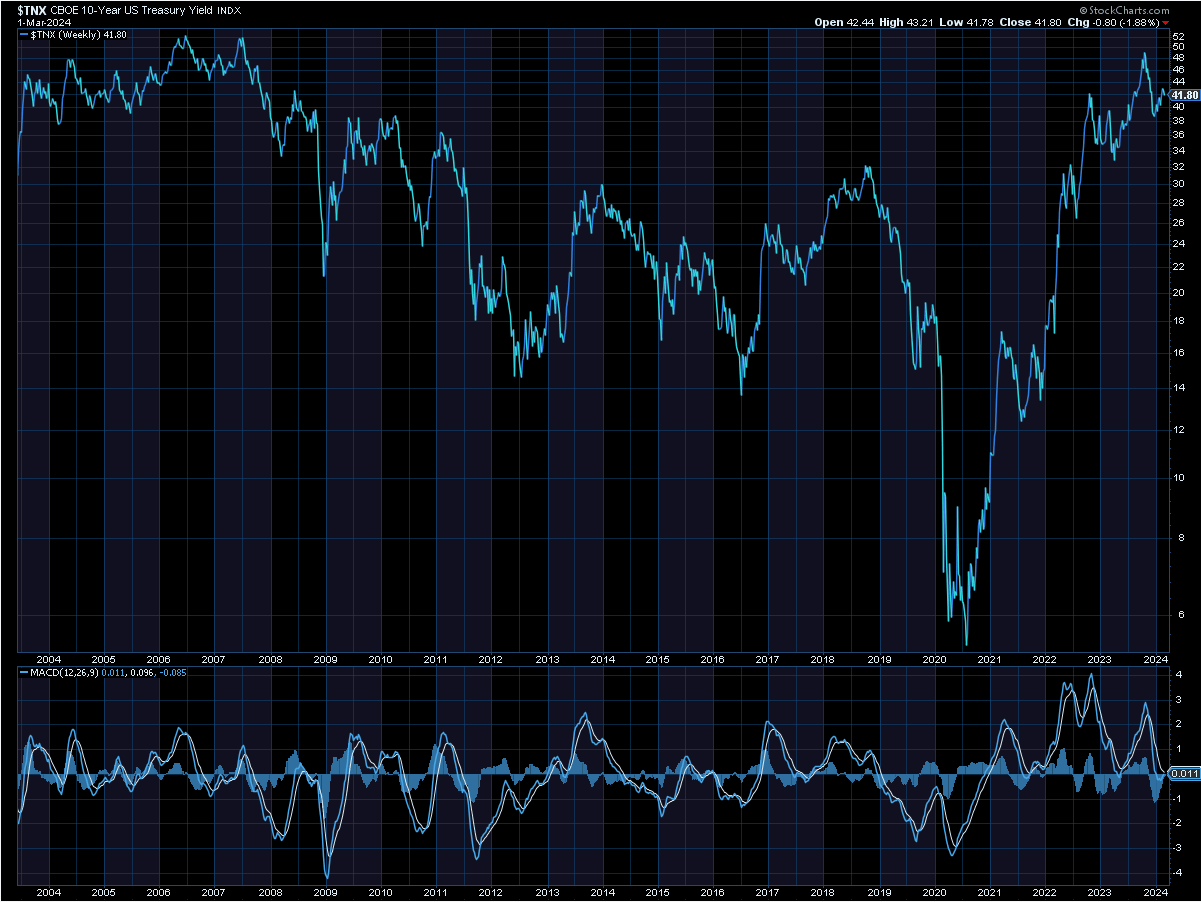
Despite this, the markets have barely shrugged their shoulders. Look at interest rates going back to the beginning of the current furious rally.
We'll dive deeper into the economy next week after we close out our economic data for the month following Friday's Jobs report.
Market Charts
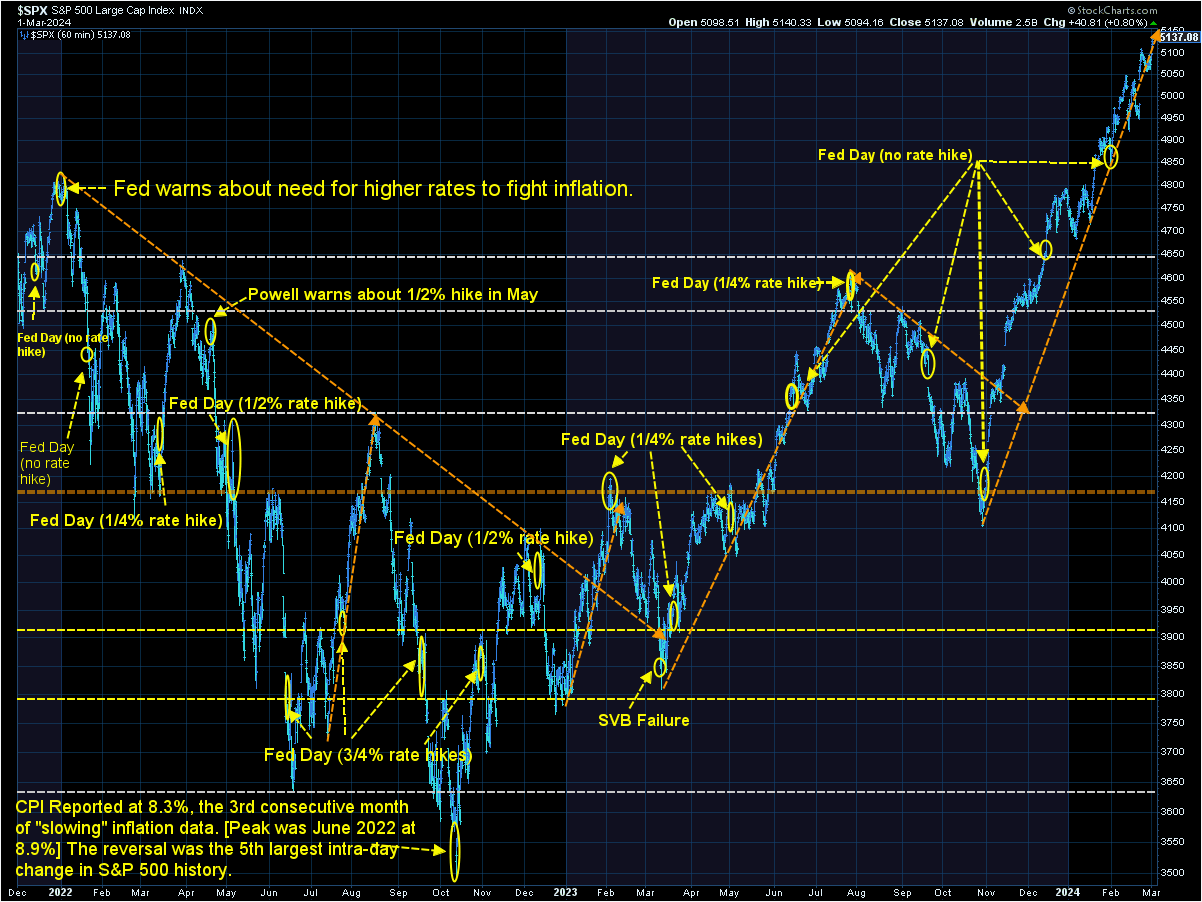
Last week I discussed the 'single best indicator'. As we've been saying all year, higher highs tend to breed higher highs — until something STRUCTURALLY shifts the trend. That could be a shift in interest rate expectations if inflation doesn't make it down to the Fed's target (which is a possibility). Until then, enjoy this uptrend while noting the steepness and length of this move has now surpassed the move from last Spring. That move started when the Fed essentially said they'd bail anybody out. It ended when the Fed emphasized their 'higher for longer' policy on interest rates. This current trend began when the Fed took away that 'higher for longer' statement and started talking about cutting rates.
As I said at the beginning, it's all about rates. Both the Fed and the markets have been wrong constantly about the direction of rates and the next move, so please be careful chasing an uptrend this steep. As we always say, you shouldn't jump into riskier investments simply because those investments are going up. The only thing that would necessitate a change is a change in your overall financial plan that warrants more risk. Even then, this uptrend is due for at least a small pullback at somepoint.
In terms of health of the market/economy, call me 'old', but I tend to be much more excited about the LONG-TERM prospects of the market when small cap stocks are participating. The Russell 2000 is nearly back to its peak from 2022, but a long way from its all-time high from late 2021. A healthier market would have the trend line at the bottom, which shows the Russell 2000 vs the S&P 500 moving higher.
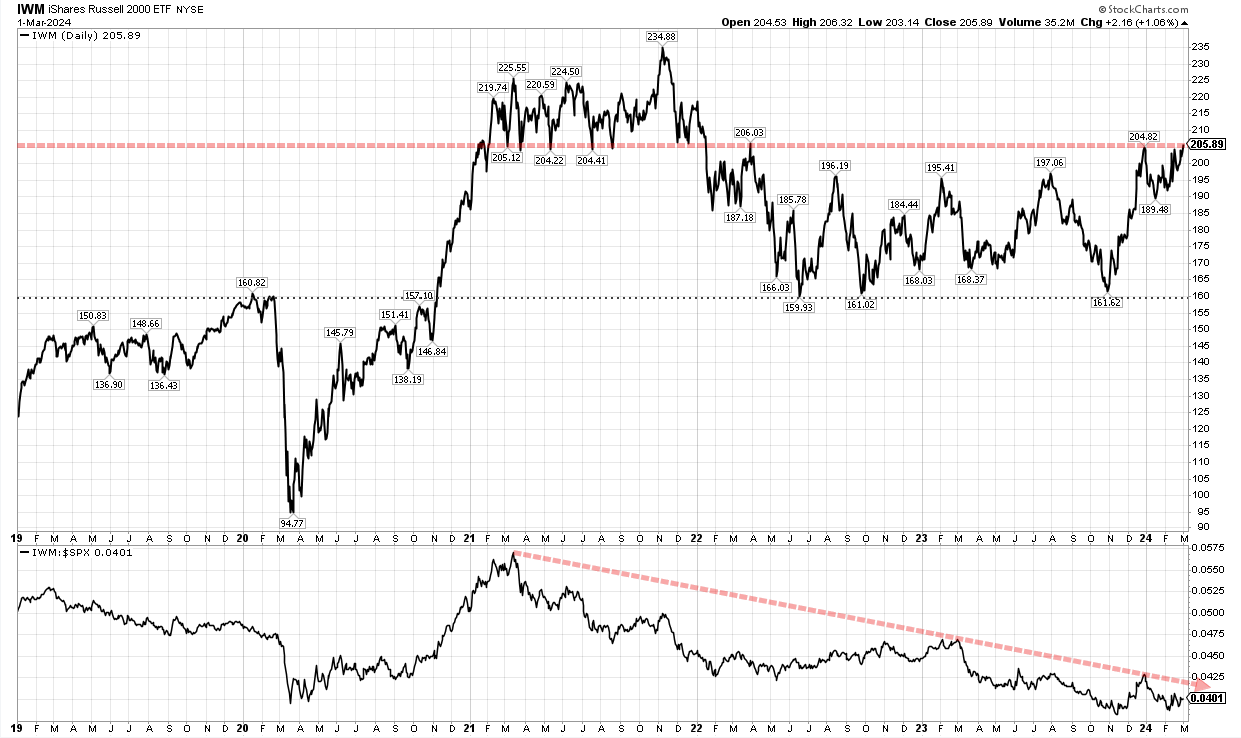
This chart also helps to keep things in perspective. Diversification has hurt as mega cap stocks have pulled the S&P 500 higher. Everyone else is struggling. This has happened at times throughout history and every time we've had a market this overweight a handful of stocks it has ended badly for those chasing the non-diversified mega cap indexes.
The 10-year continues to be non-decided on the next direction of rates. A move above 4.3% would be bad news for everyone in risky assets. A move below 4.1% could be a sign that yet another push higher is coming (and be good news for small cap stocks.)
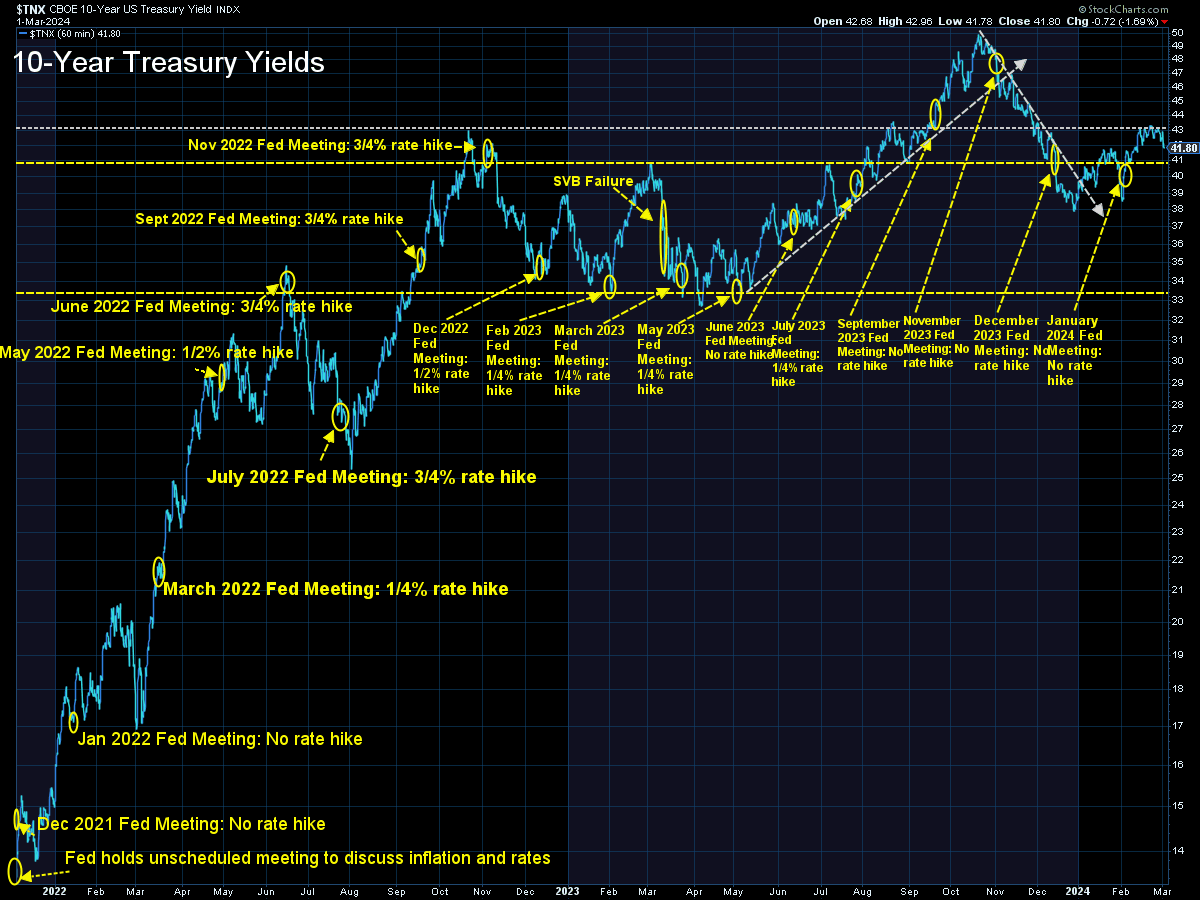
On a longer-term basis, our interest rate direction model just shifted to a "higher" signal, which could be bearish for bonds.
I noted this chart last week and is something we should keep on our radar – Corporate Bond Spreads, both investment grade and high yield are approaching the LOWS of 2006, meaning the perceived level of risk is nearing the same levels of complacency we saw just before the financial system nearly crumbled to the ground.
We are obviously monitoring this closely.
SEM Model Positioning
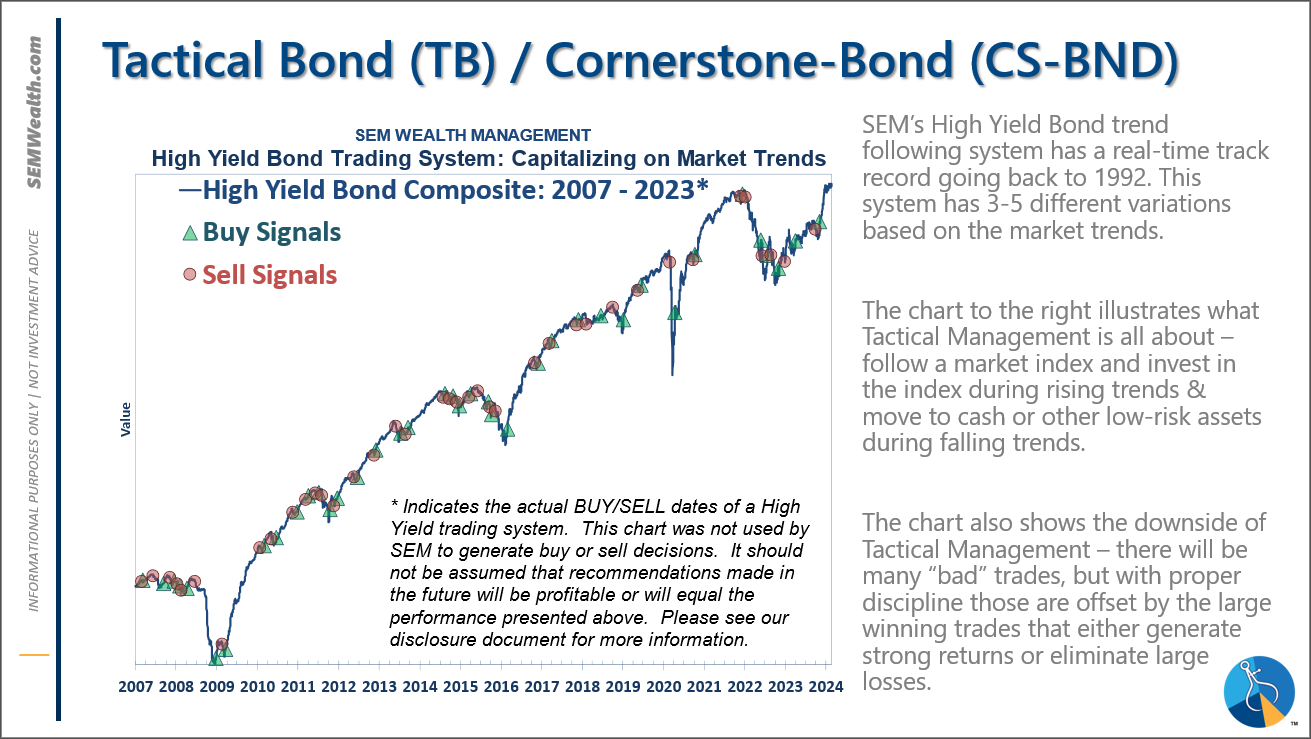
-Tactical High Yield went on a buy 11/3/2023
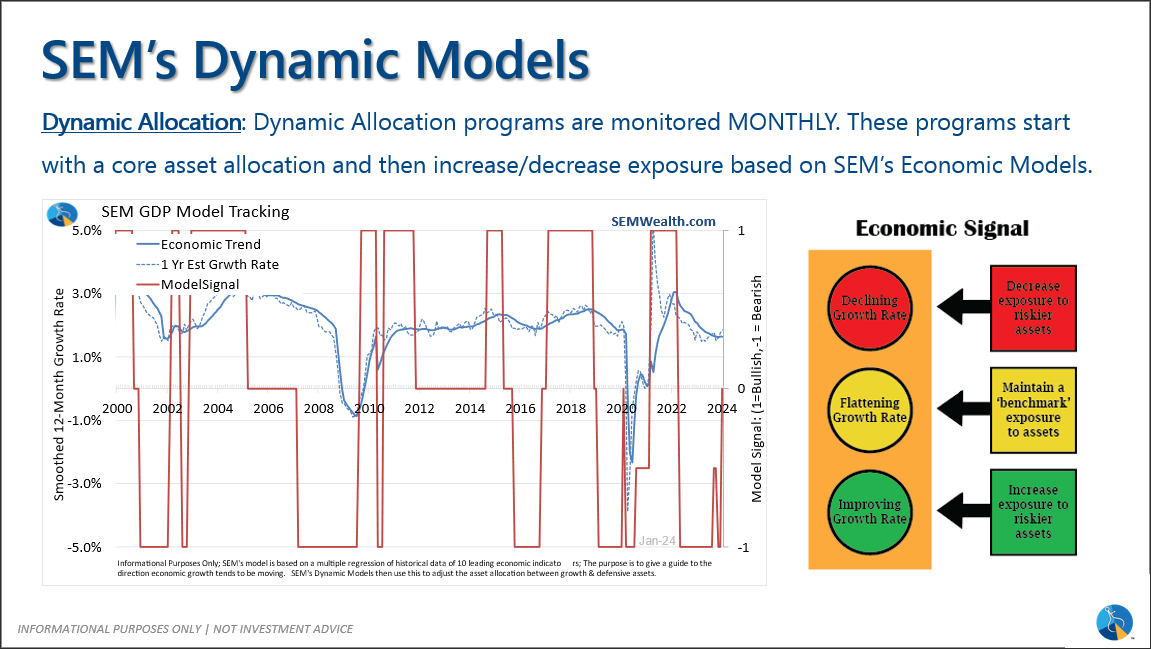
-Dynamic Models went to 'neutral' 2/5/2024
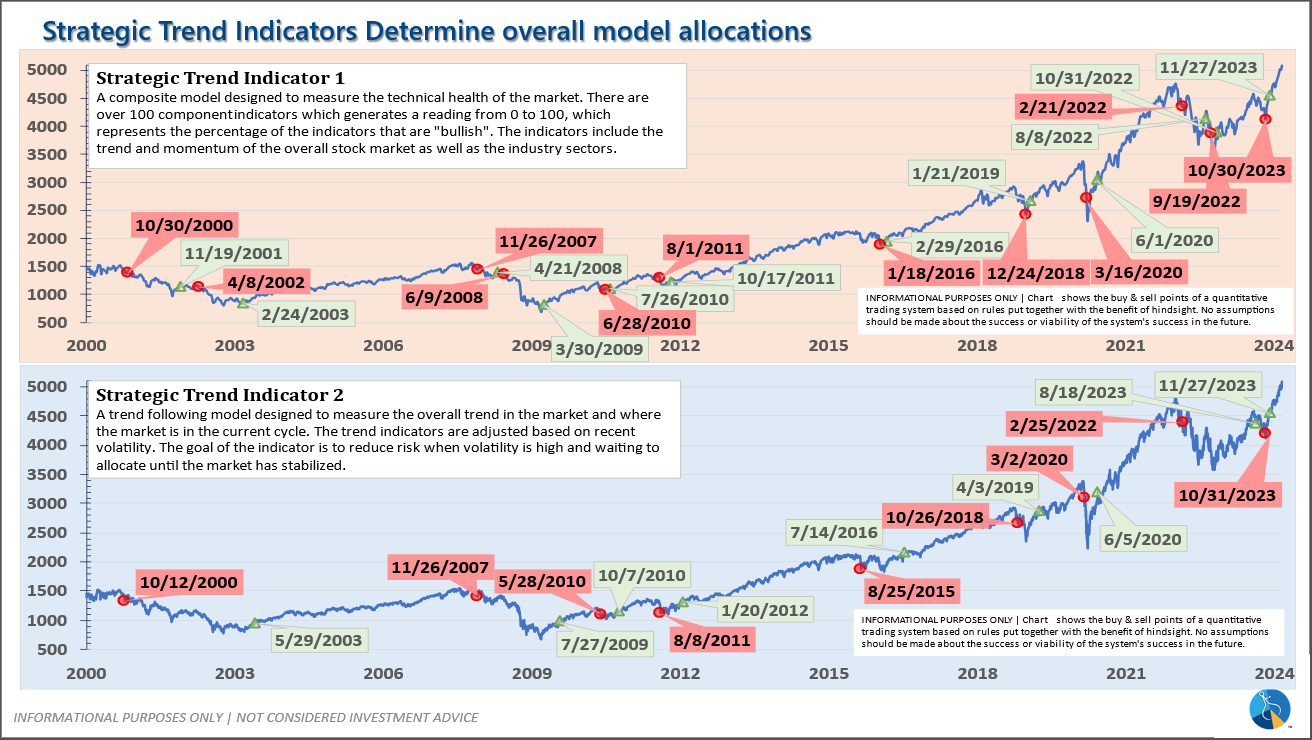
-Strategic Trend Models went on a buy 11/27/2023
SEM deploys 3 distinct approaches – Tactical, Dynamic, and Strategic. These systems have been described as 'daily, monthly, quarterly' given how often they may make adjustments. Here is where they each stand.
Tactical (daily): The High Yield Bond system bought the beginning of April and issued all 3 sell signals 9/28/2023. All 3 systems were back on buy signals by the close on 11/3/2023. The bond funds we are invested in are a bit more 'conservative' than the overall index, but still yielding between 7.5 -8.5% annually.
Dynamic (monthly): At the beginning of December the economic model reverted back to "bearish". This was reversed at the beginning of February. This means benchmark positions – 20% dividend stocks in Dynamic Income and 20% small cap stocks in Dynamic Aggressive Growth.
Strategic (quarterly)*:
BOTH Trend Systems reversed back to a buy on 11/27/2023
The core rotation is adjusted quarterly. On August 17 it rotated out of mid-cap growth and into small cap value. It also sold some large cap value to buy some large cap blend and growth. The large cap purchases were in actively managed funds with more diversification than the S&P 500 (banking on the market broadening out beyond the top 5-10 stocks.) On January 8 it rotated completely out of small cap value and mid-cap growth to purchase another broad (more diversified) large cap blend fund along with a Dividend Growth fund.
The * in quarterly is for the trend models. These models are watched daily but they trade infrequently based on readings of where each believe we are in the cycle. The trend systems can be susceptible to "whipsaws" as we saw with the recent sell and buy signals at the end of October and November. The goal of the systems is to miss major downturns in the market. Risks are high when the market has been stampeding higher as it has for most of 2023. This means sometimes selling too soon. As we saw with the recent trade, the systems can quickly reverse if they are wrong.
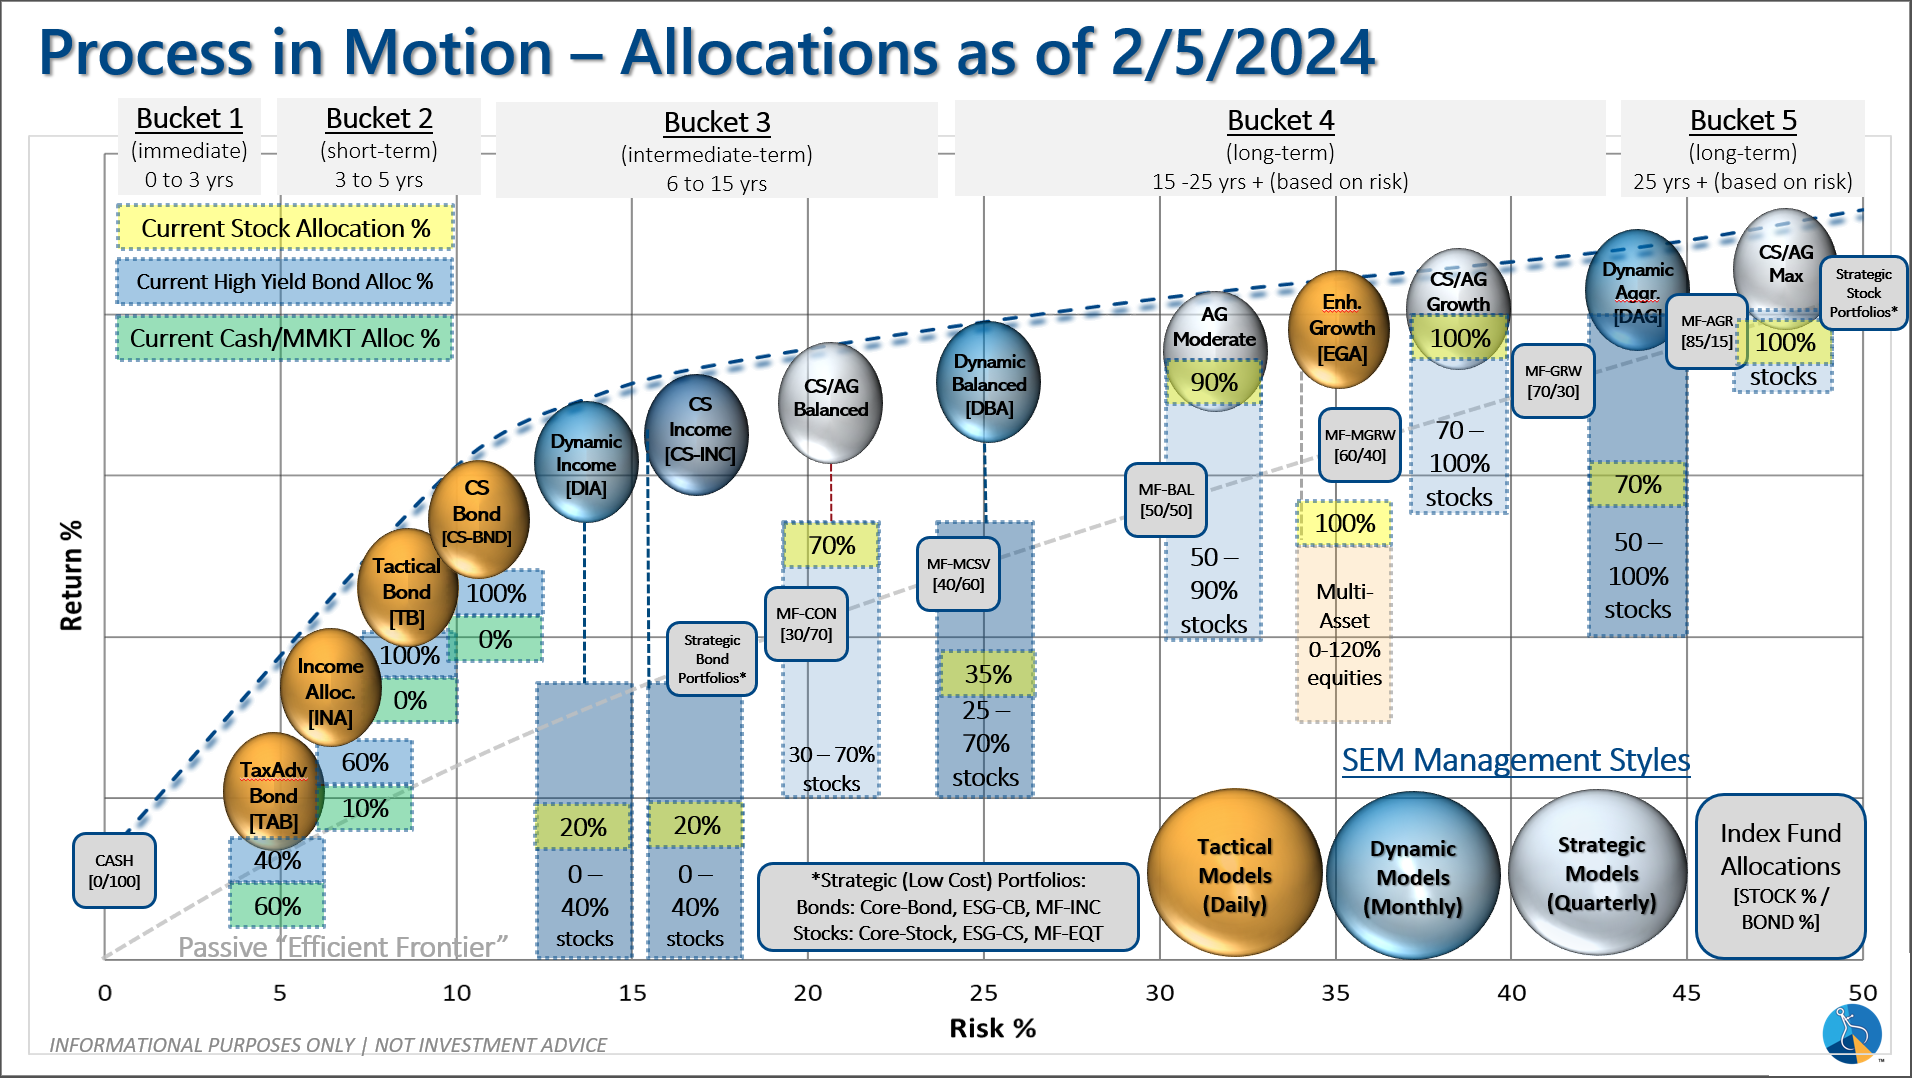
Overall, this is how our various models stack up based on the last allocation change: