Working with thousands of clients across the country we receive quite a bit of commentary forwarded by clients to their advisors and then to SEM. No matter the current market environment there always seems to be a group afraid of missing out on the upside and another afraid of the potential downside. There isn't anything wrong with being in either camp and certainly nothing wrong with forwarding the article or concerns to an advisor to get their take. That's what we're here for.
No matter which camp the concern comes from I always end it the same way. Now this may seem like a cop-out, but it's not. It's the reason SEM has been around for over 30 years — if your goal is to manage risk while still having the ability to still participate in the upside of the markets we have found the single best indicator to accomplish this.
So when somebody voices concerns that they aren't making as much as the headline indexes, I will address those concerns but bring it back to momentum and how we use it. When somebody expresses a concern about the damage (fill in the blank) is going to do to the economy, markets, or our country, I will address those concerns but bring it back to momentum and how we use it.
I won't bore y'all with the details, but we've tested dozens of indicators and hundreds of versions of those indicators. The only ones that meet our goal consistently across all types of markets are the ones based on momentum. Which direction is the market going, how much money is behind the direction, and how does this compare to historical data.
You see, some momentum is good and relatively easy to ride. Too much momentum is dangerous and can lead to big losses (in both directions).
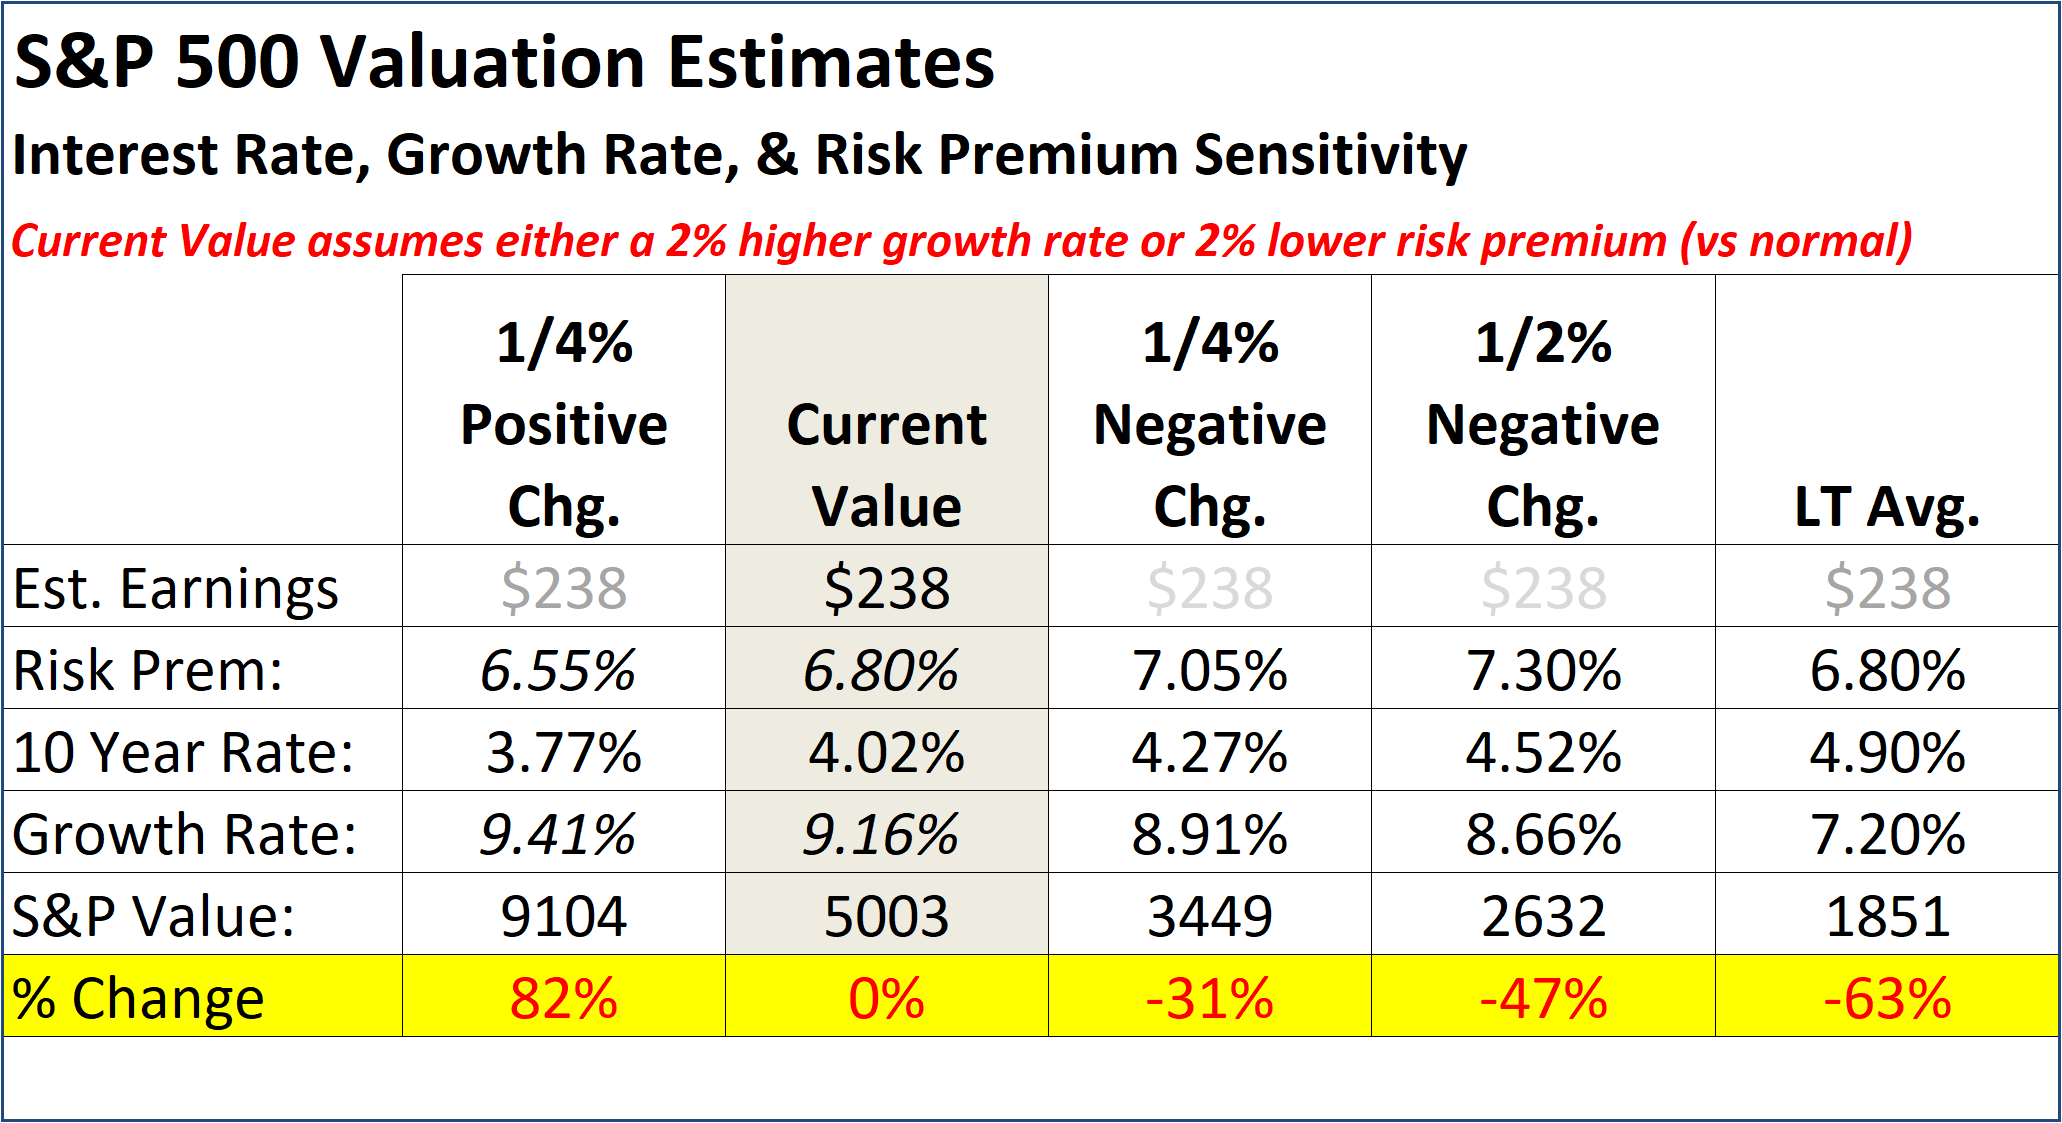
The reason this works is simple — the direction and how much money is behind it comes down to how everyone feels about the markets. We illustrated this a few weeks back as we discussed how sensitive the Wall Street valuation models are to small changes in the inputs. If everyone feels better, markets can move significantly higher. If everyone starts to feel pessimistic, markets can crash.
Right now the momentum is higher and everyone feels pretty good. This can be a good thing in moderation, but if it gets going too far it exposes the markets to huge drops behind relatively minor disappointments.
Last week we saw Nvidia absolutely destroy all expectations. The stock moved up over 12% and became the 3rd largest company in the S&P 500, just behind Microsoft and Apple. That's all fine and good except Microsoft is reported to be Nvidia's largest customer, yet both stocks are going up like crazy along with 3 of Nvidia's other largest customers – Amazon, Google, & Meta.
We don't disagree that AI has the potential to make our lives better and easier and potentially make some companies a lot of money. But the same was true for the microprocessor, the personal computer, the internet, and the smart phone. There will certainly be some winners, but can it be both the company making the chips that power AI and its customers who are buying the chips?
How many NEW chips will Nvidia's largest customers need to buy?
Will other cheaper alternatives come along (Google and Apple are reported to be working on their own chips)?
Will Amazon, Google, Microsoft, and Meta be able to charge more for their services and/or gain new customers because of their significant AI investment?
These are just some of the questions that come to mind after reading too many reports on Nvidia's blow-out earnings. If you want to dive deep into the financials of Nvidia and its largest customers, here's a good place to start.


I'm not saying don't invest in the market, or technology, or any other AI related trends. I'm just saying to be careful out there.
For more on momentum and the current market environment, keep reading............
Market Charts
Sit back and enjoy the ride. The market perceives there are no risks in sight and nothing seems capable of stopping it. As I've been saying, higher highs tend to bring even higher highs. The trend (momentum) is up until something forcibly changes the current environment. Guessing what that is and trying to find it is a fools game. All we can do is monitor the price and volume behind the price and be ready to take money off the table.
Keep in mind our stock market systems allow for 'noise' in the form of 7-10% drops before they should be expected to act. A 5% drop should happen 3-4 times a year on average and a 10% drop at least once. What we are hoping to avoid are the 15-35% drops that can wipe out a lot of the gains from the prior uptrend.
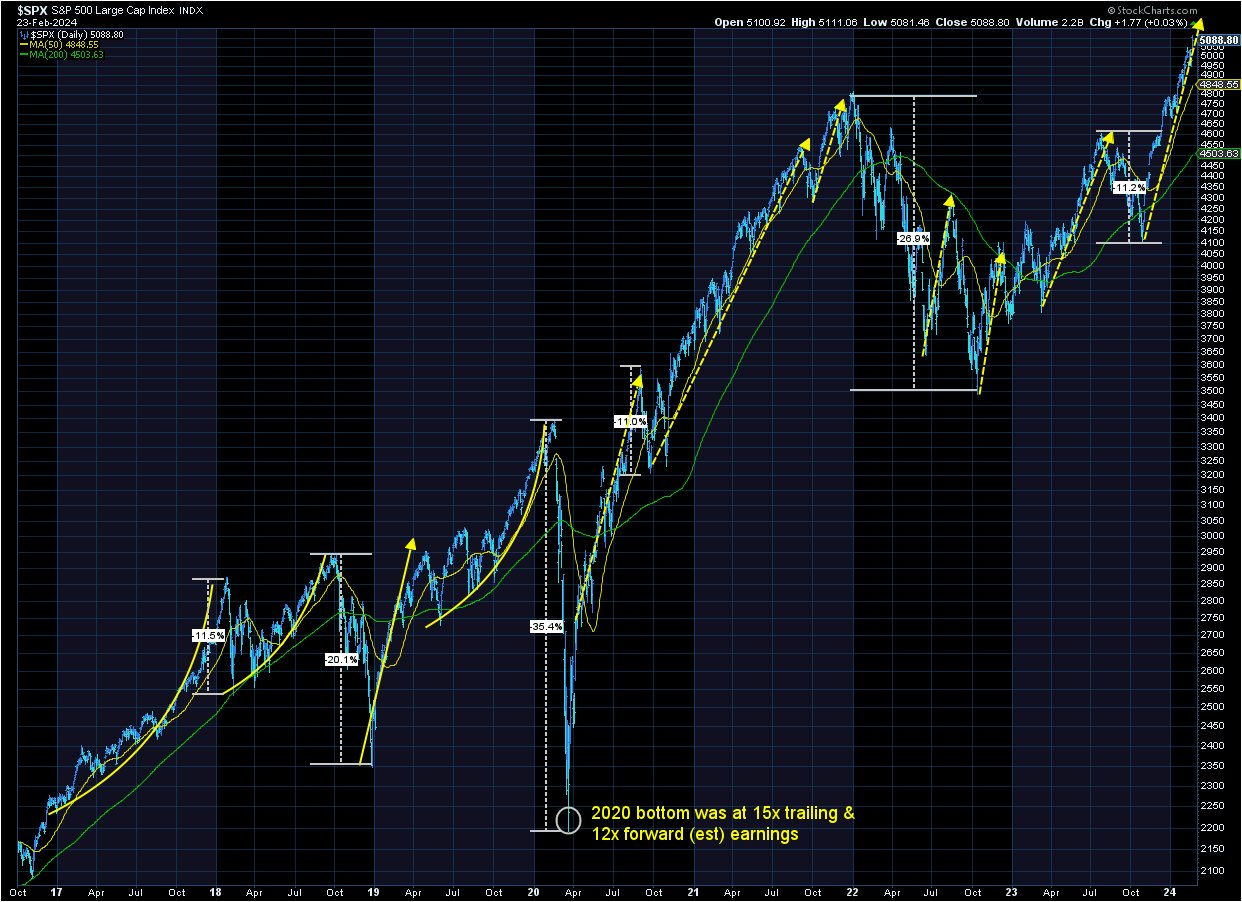
Like we saw in 2019 and 2021, the nearly vertical climb can end without any real news to start the decline. When that happens momentum begins to work against us on the downside.
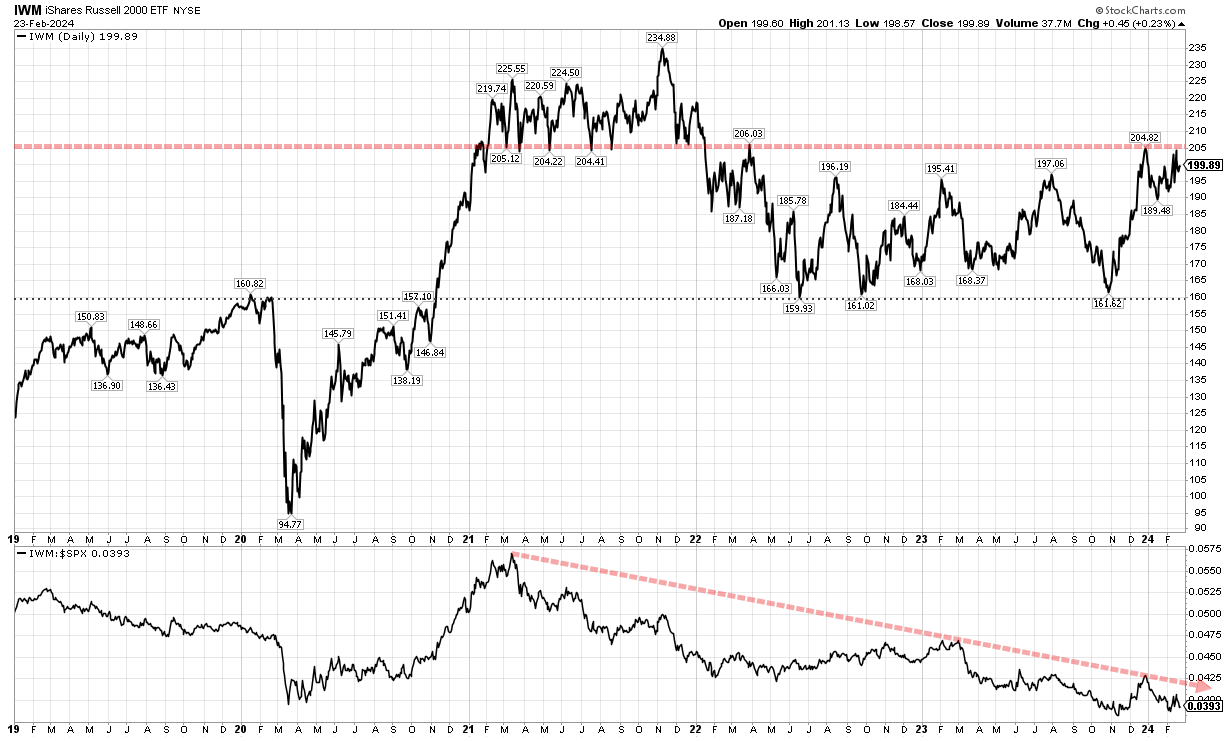
I started showing the chart of the Russell 2000 a few weeks ago to keep the large cap stock market rally in perspective. From a momentum stand point we'd like to see smaller companies joining the party because fundamentally the large companies can only make so much money off the current AI-mania, but in theory if it is something positive for the long-term future of our economy smaller companies should be able to make SIGNFICANT amounts of money (and become mid and large cap companies.) For now, small company stocks continue to struggle.
I also put together this chart last week to compare the various asset classes available for investment. It starts at the beginning of 2021 (when the GameStop/AMC Meme stock craze started).
Small company stocks are barely positive over the 3 year period. Note how much bonds have lost during the same time.
What's more interesting and important based on where we are today, is the chart starting AFTER the Meme Stock craze ended. The average stock (represented by the equal weight S&P 500 ETF) is flat over that time frame. Bonds remain significantly under water.
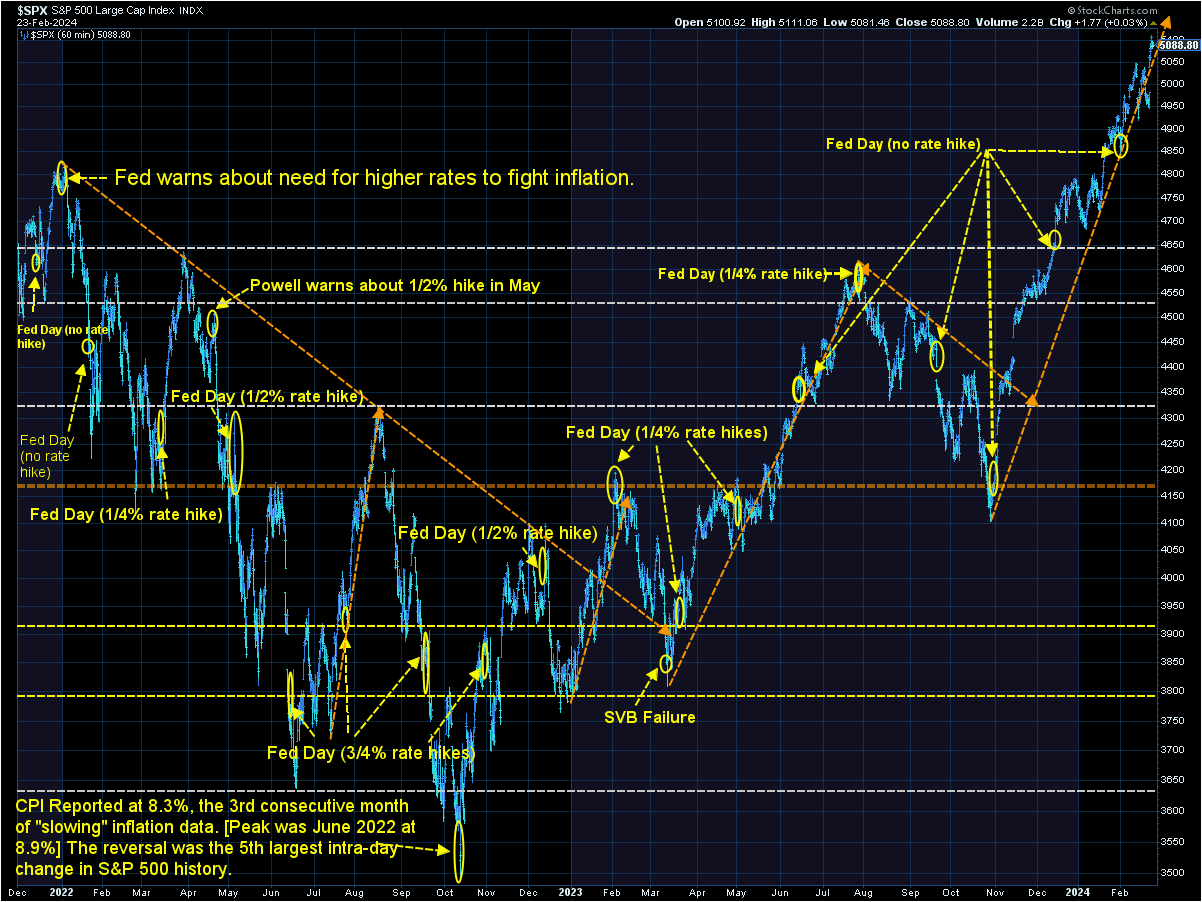
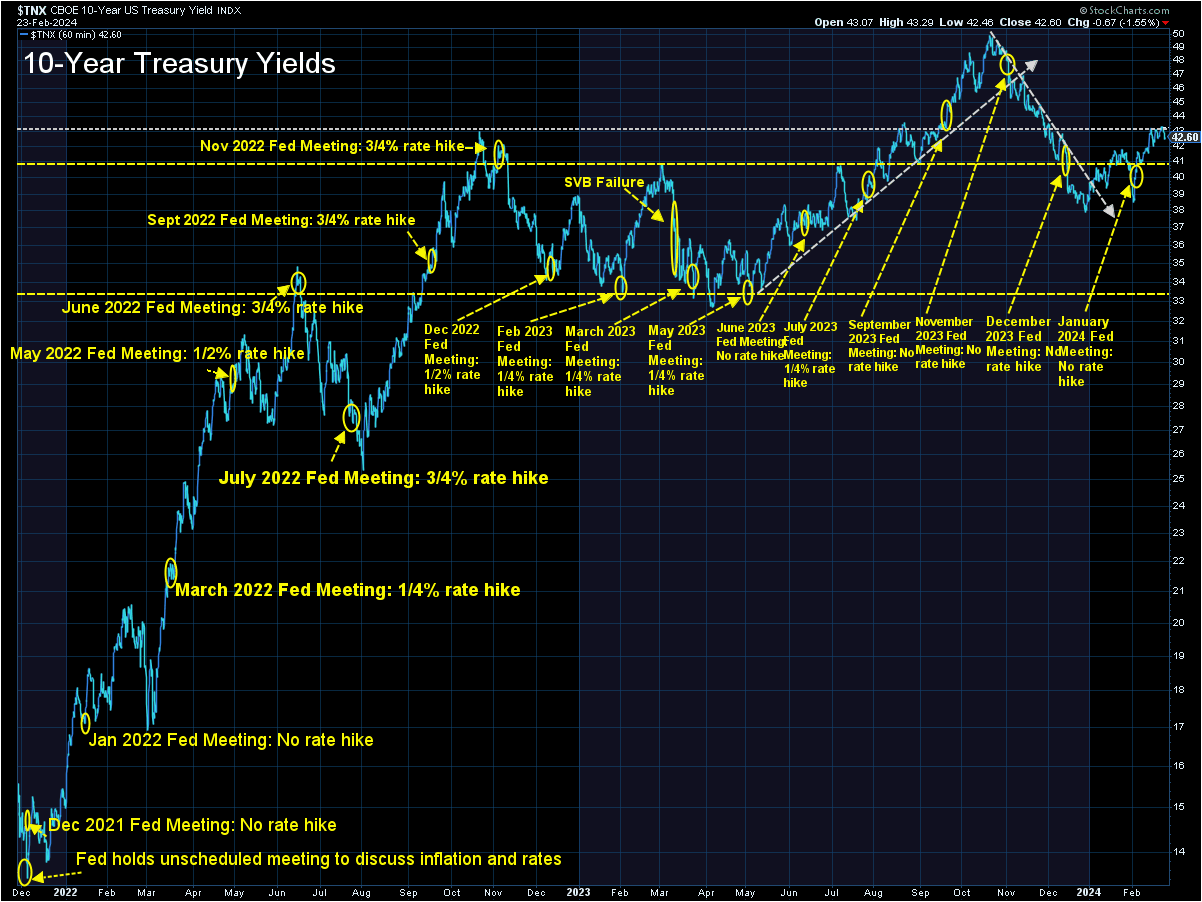
Speaking of bonds, yields continue to bounce around between 4.15-4.30% on the 10-year. The chart below shows it could be a negative for bonds and stocks if yields break decisively above 4.3%.
Looking at the spreads between Treasuries and Corporate Bonds, the concerns in the bond market are all focused on inflation and the Fed's ability to cut interest rates and not economic concerns. Investment Grade spreads are close to the lowest on record. High Yield Bond spreads are just 0.8% away.
As I keep saying – be happy with the returns we've been enjoying, but please do not use the fact markets seemingly never want to go down as a reason to take on more risk in your account. SEM's models are all nearly at maximum risk with a weary eye on our indicators looking for the best time to start locking in those gains.
SEM Model Positioning
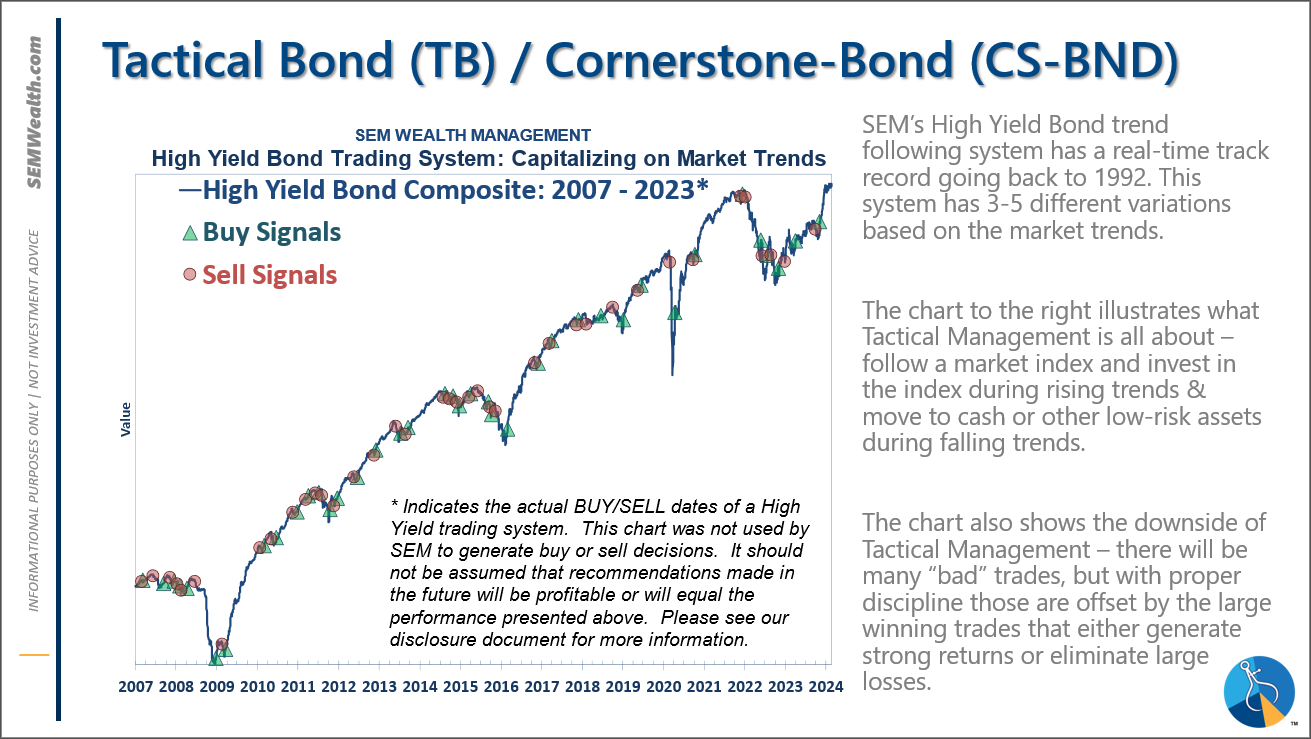
-Tactical High Yield went on a buy 11/3/2023
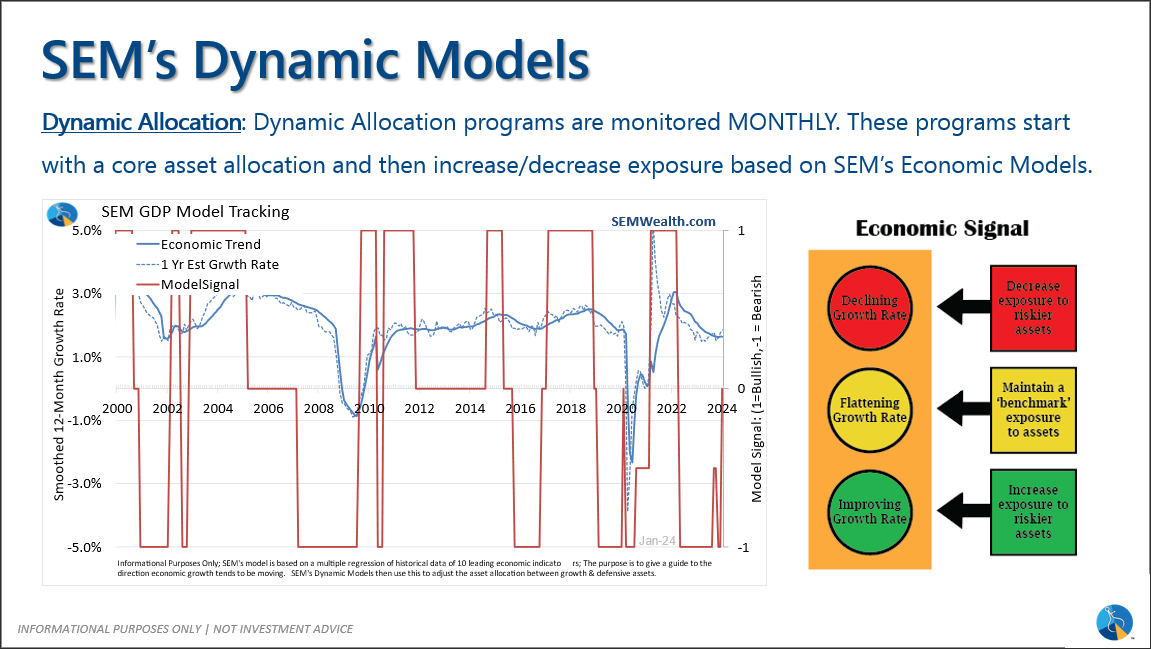
-Dynamic Models went to 'neutral' 2/5/2024
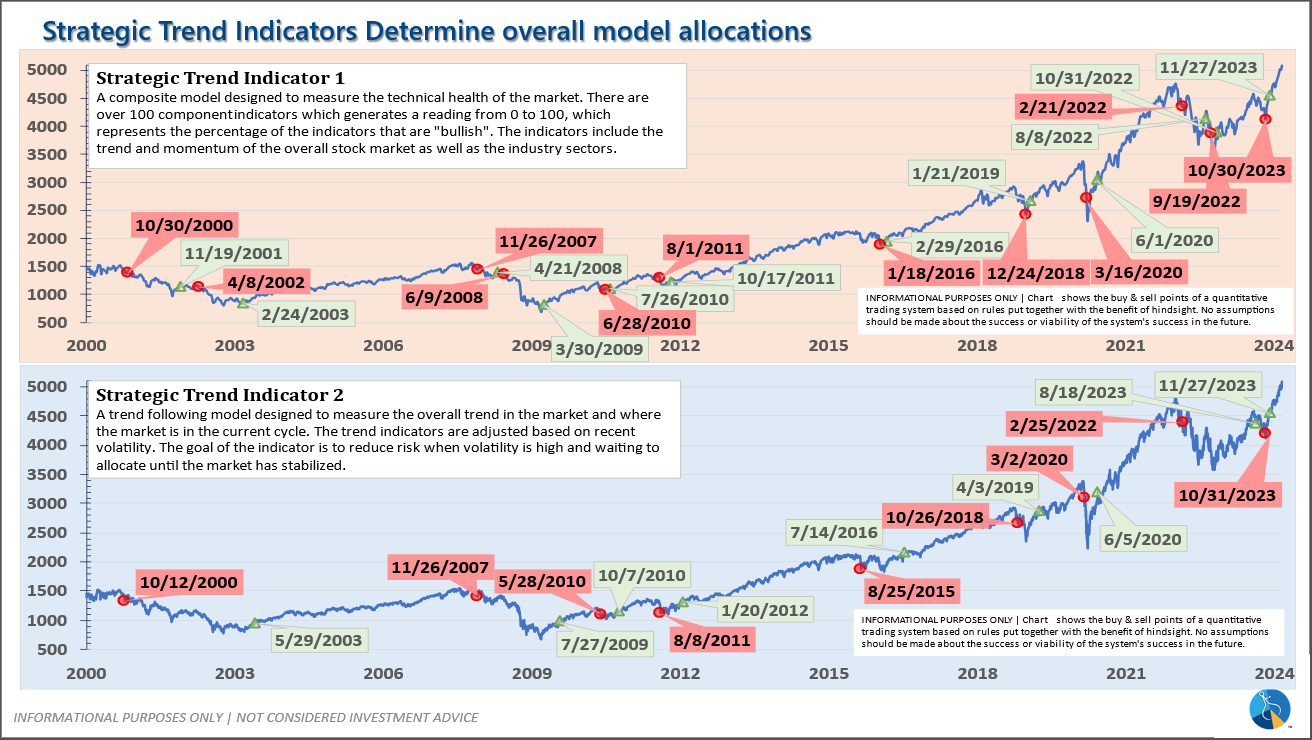
-Strategic Trend Models went on a buy 11/27/2023
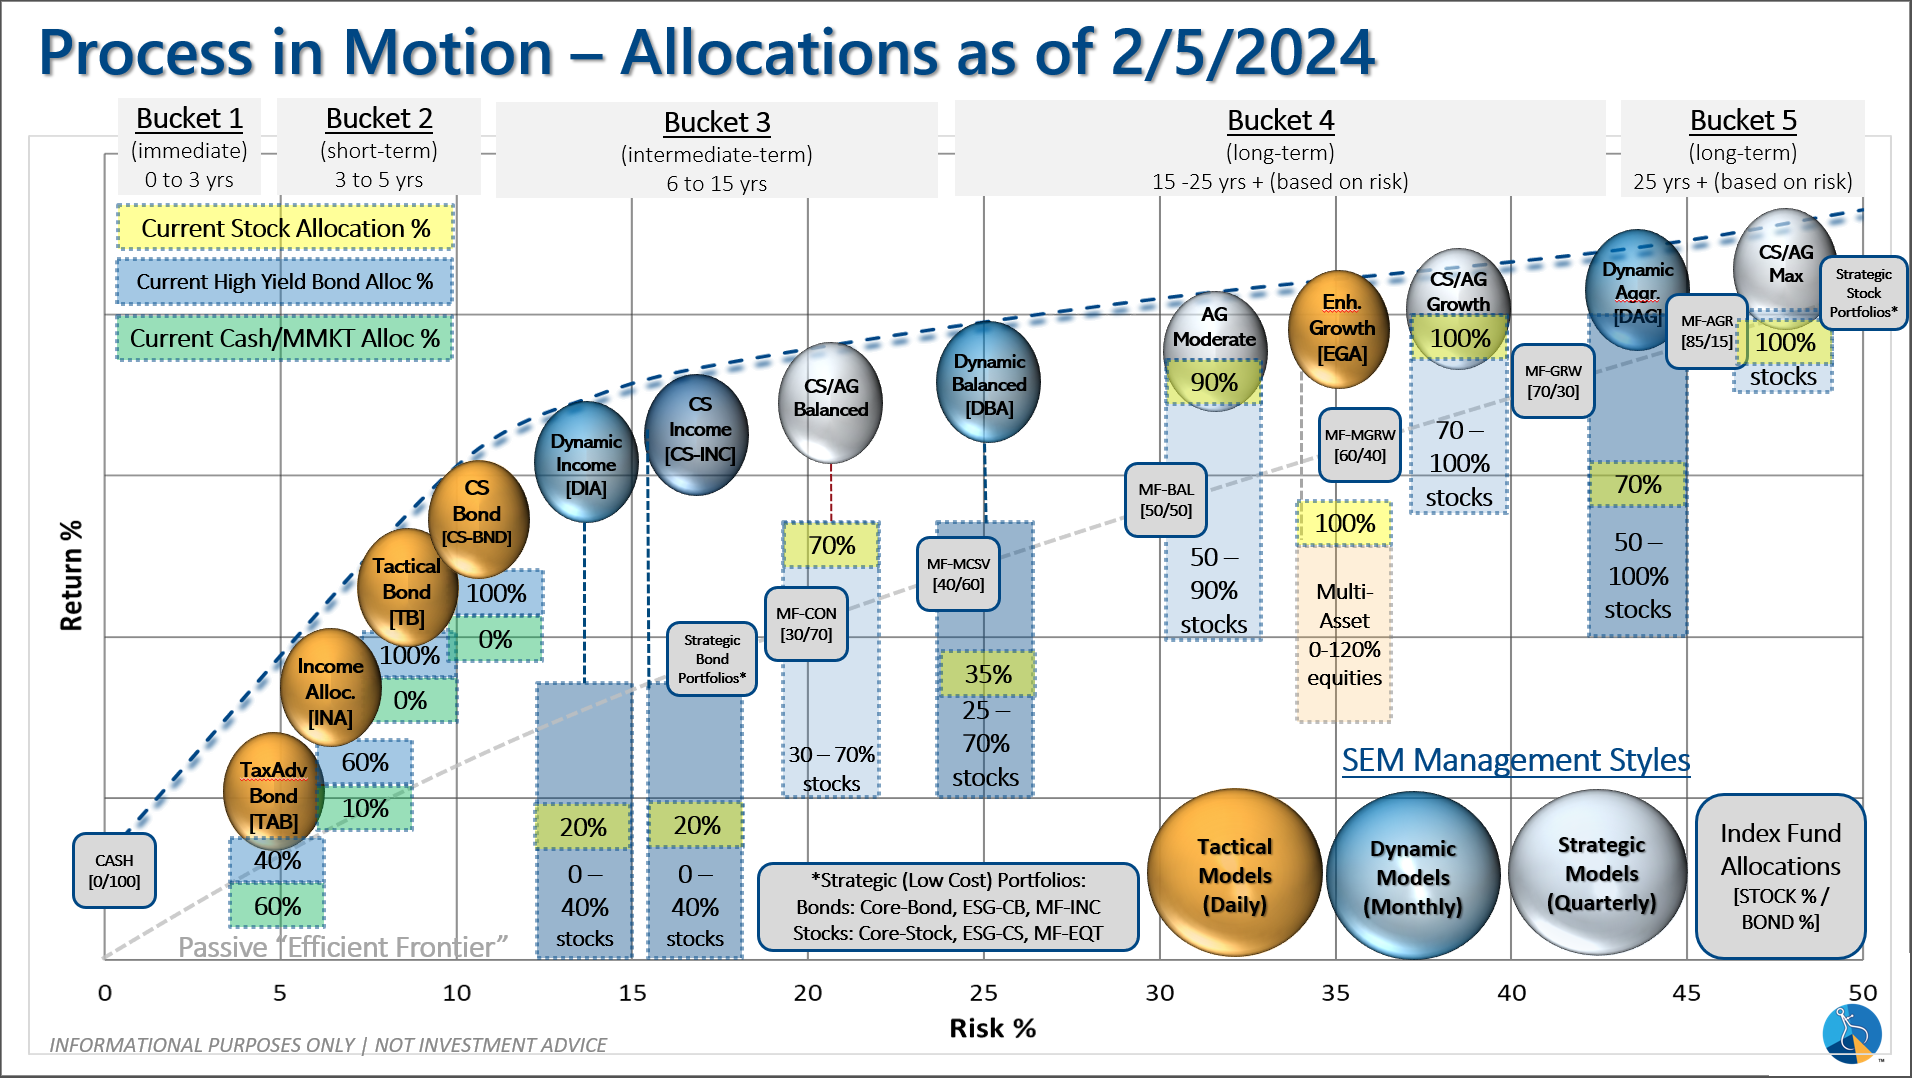
SEM deploys 3 distinct approaches – Tactical, Dynamic, and Strategic. These systems have been described as 'daily, monthly, quarterly' given how often they may make adjustments. Here is where they each stand.
Tactical (daily): The High Yield Bond system bought the beginning of April and issued all 3 sell signals 9/28/2023. All 3 systems were back on buy signals by the close on 11/3/2023. The bond funds we are invested in are a bit more 'conservative' than the overall index, but still yielding between 7.5 -8.5% annually.
Dynamic (monthly): At the beginning of December the economic model reverted back to "bearish". This was reversed at the beginning of February. This means benchmark positions – 20% dividend stocks in Dynamic Income and 20% small cap stocks in Dynamic Aggressive Growth.
Strategic (quarterly)*:
BOTH Trend Systems reversed back to a buy on 11/27/2023
The core rotation is adjusted quarterly. On August 17 it rotated out of mid-cap growth and into small cap value. It also sold some large cap value to buy some large cap blend and growth. The large cap purchases were in actively managed funds with more diversification than the S&P 500 (banking on the market broadening out beyond the top 5-10 stocks.) On January 8 it rotated completely out of small cap value and mid-cap growth to purchase another broad (more diversified) large cap blend fund along with a Dividend Growth fund.
The * in quarterly is for the trend models. These models are watched daily but they trade infrequently based on readings of where each believe we are in the cycle. The trend systems can be susceptible to "whipsaws" as we saw with the recent sell and buy signals at the end of October and November. The goal of the systems is to miss major downturns in the market. Risks are high when the market has been stampeding higher as it has for most of 2023. This means sometimes selling too soon. As we saw with the recent trade, the systems can quickly reverse if they are wrong.
Overall, this is how our various models stack up based on the last allocation change: