Despite a one-day scare last week, the stock market closed the week near its record high. The 'scare' came in the form of an increase in the rate of inflation. This threw cold water on the thought the Fed would slash interest rates up to 6 times for a total of 1.5% in 2024 simply because inflation was under control. It was only a one day panic though as several Fed officials fell all over themselves to calm the markets with various speeches saying '1 month does not make a trend'.
Last Tuesday's drop should serve as a warning at just how sensitive the markets are to small disappointments. I illustrated last week how sensitive the market valuation formulas are to relatively minor changes in growth, risk, and interest rate assumptions.

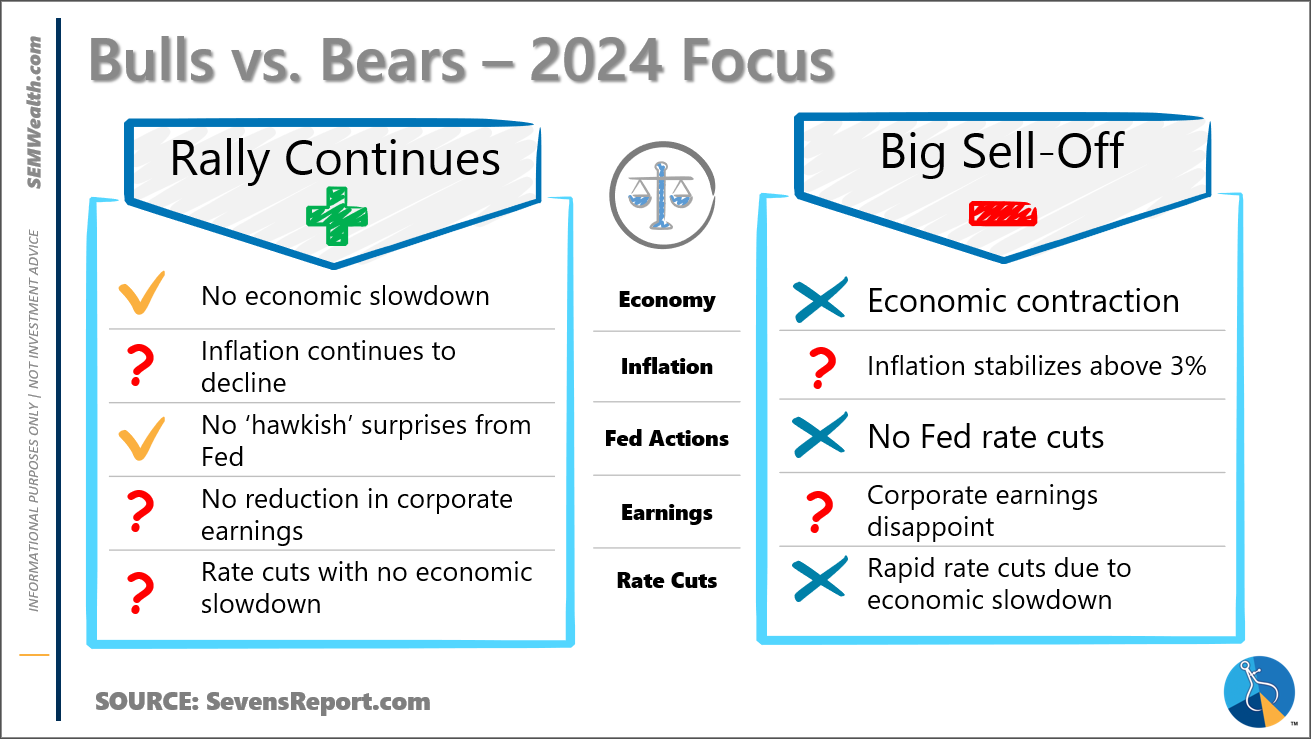
At the end of last year I posted a table listing the areas the market is focusing on. As we enter the 8th week of the year here's how the scorecard sits:
Two weeks ago we discussed our economic model which has shown marked improvement over the past few months.

The problem though comes with the question we asked then – what if growth is too strong to warrant any (or at least only 1 or 2) rate cuts? What happens then?
The inflation data last week highlighted a couple of problems — the bulk of the decline in inflation has been thanks to plummeting energy prices (now down nearly 5% on a year-over-year basis).

The continued economic strength has meant consumers are adjusting to the higher prices, service prices continue to increase, and 'shelter' remains stubbornly high. While it may feel like a housing bubble, there is little sign we are going to see a decline in residential real estate prices any time soon.

I was at a conference last week (more on that below) and one of the market outlook panelists said, "the final 1% in the inflation fight will be the toughest 1%". It could be the Fed's 2% 'target' was the right target for the first 20 years of the 21st century, but maybe the structure of our economy is different now and 3-4% is the new norm. If that is the case those banking on the Fed slashing rates as we get to the 2% target could be in for a huge disappointment.
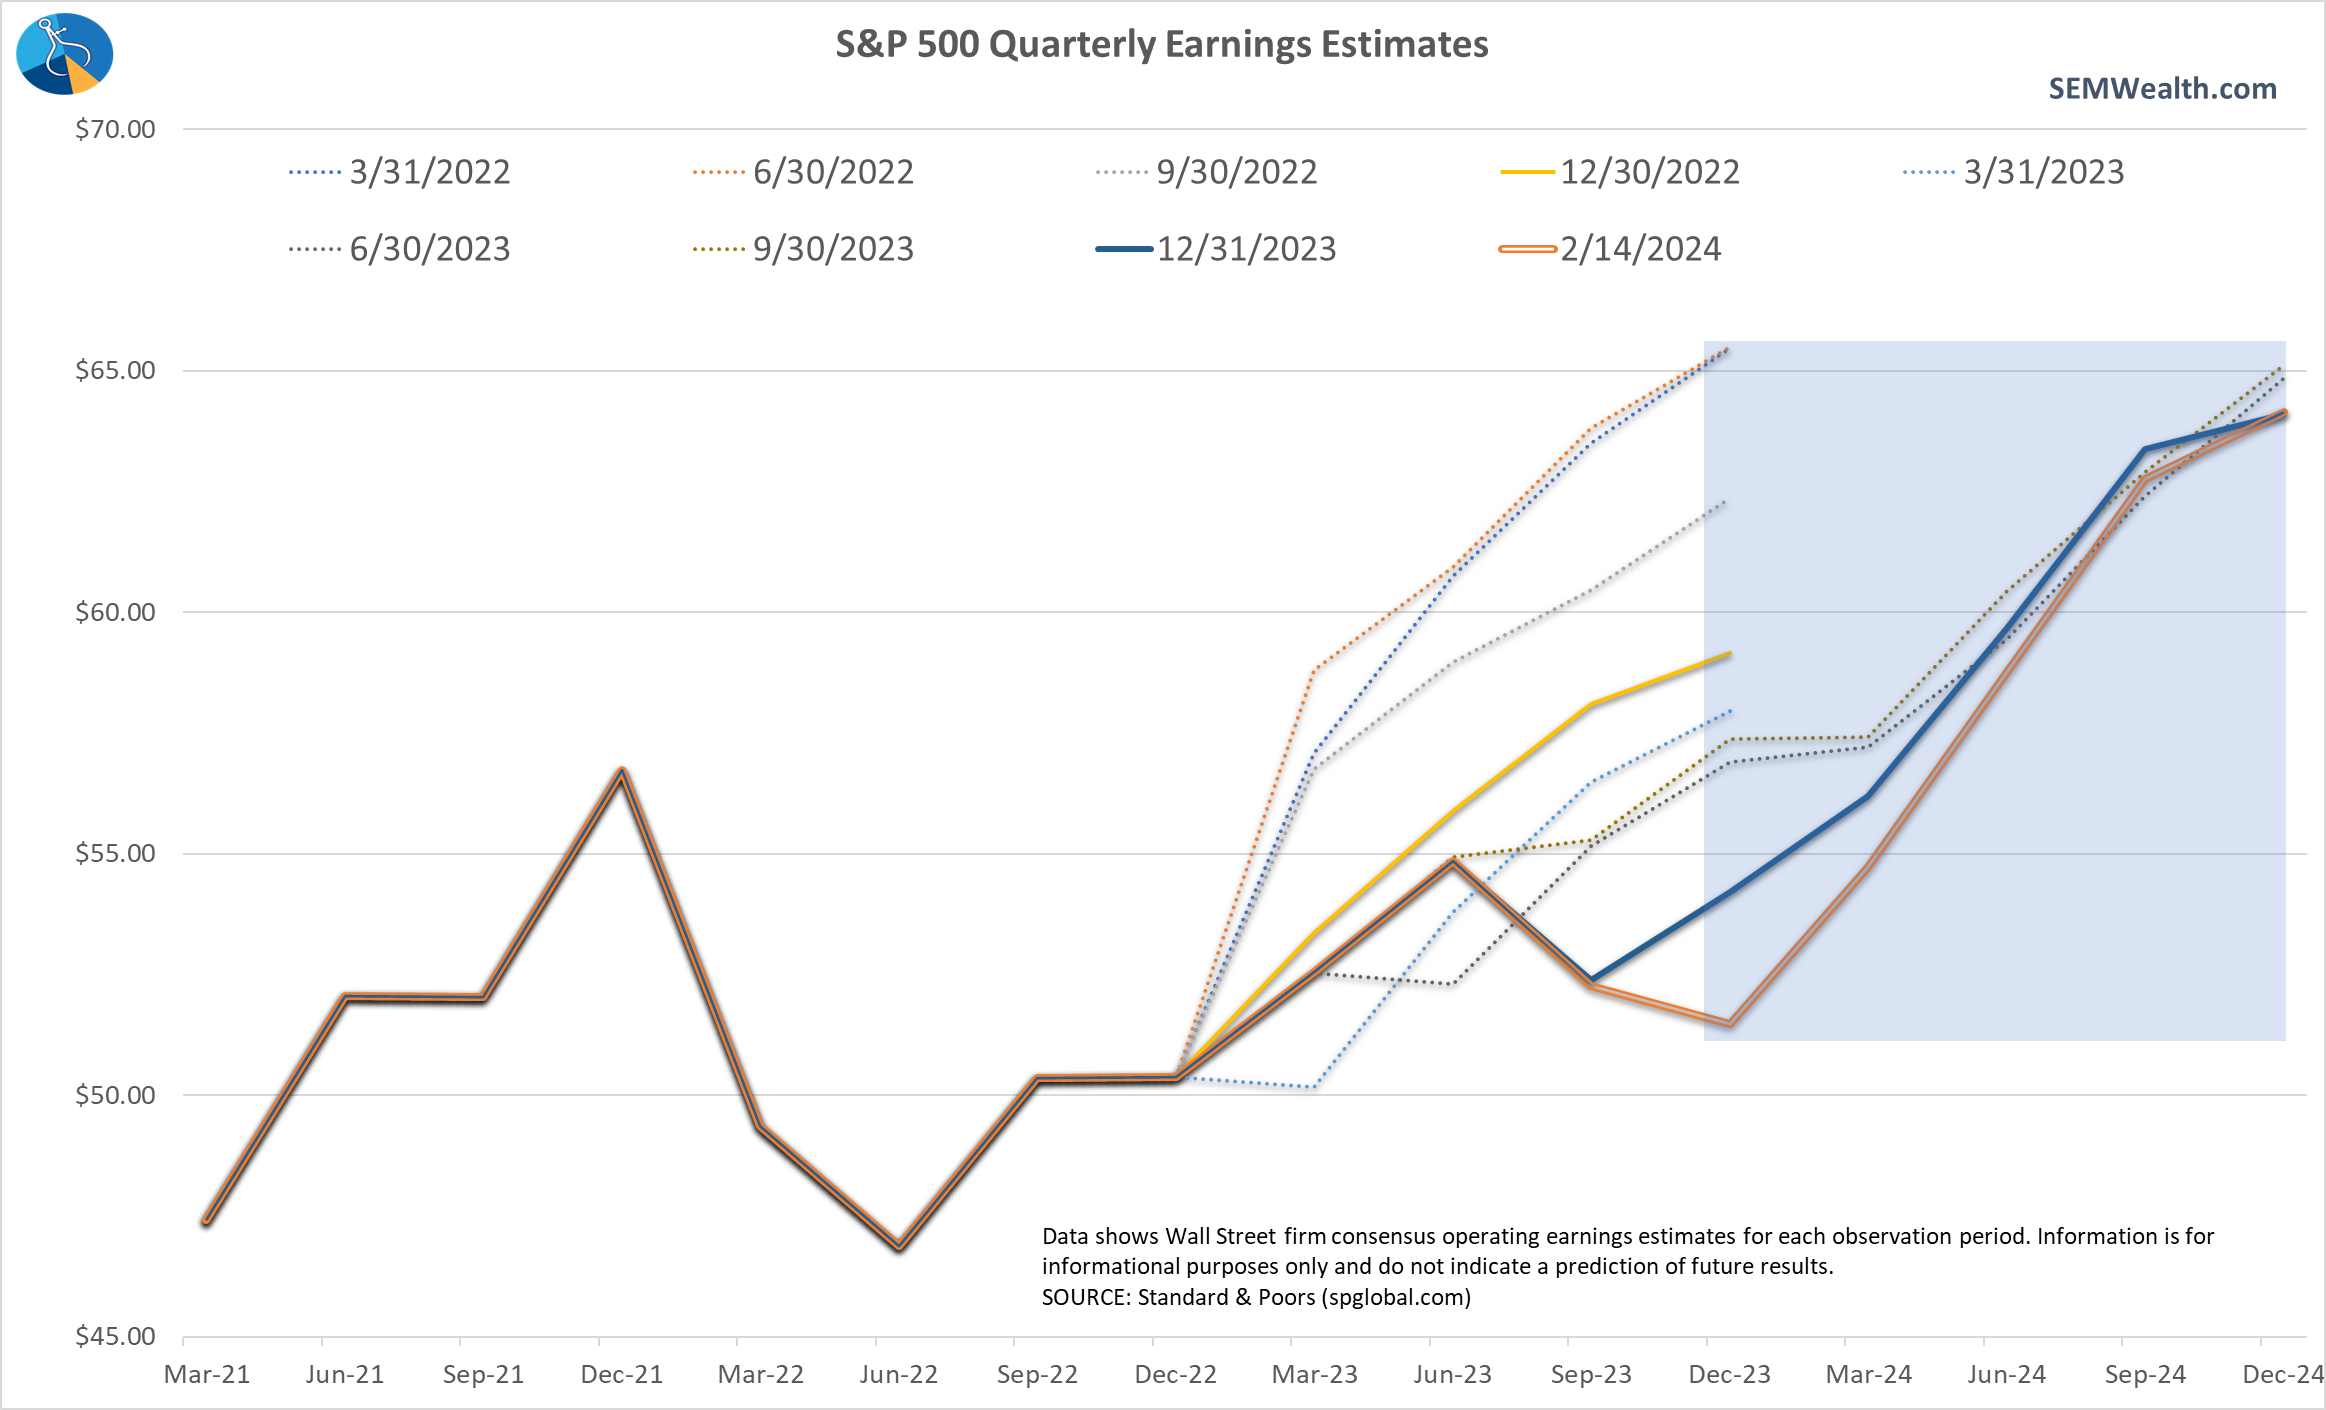
The other question on the Bull vs. Bear table above is corporate earnings. Just 6 weeks into the calendar year, we've already seen earnings estimates for the 1st quarter drop by 3% and the 2024 estimates cut by 2%. While that isn't a lot in the whole scheme of things, when stocks are trading at 27x last year's earnings and 21x this year's estimates, there is little margin for error.
The P/E ratio has only been higher than it sits today a few times in our history — during the tech bubble, during the financial crisis (when earnings nearly went negative for the entire S&P 500), and in the summer of 2021.
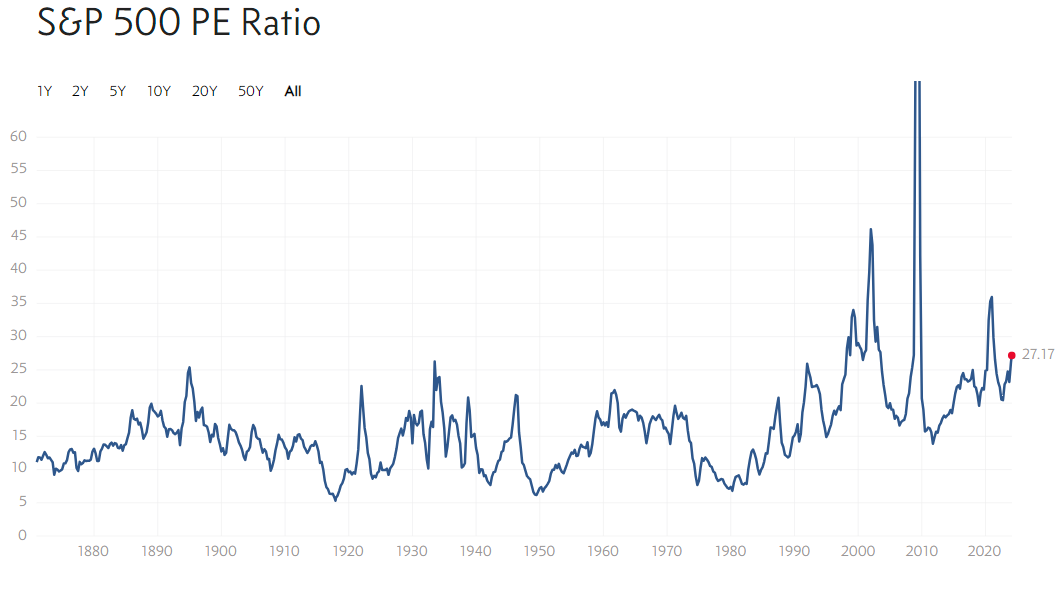
The Shiller P/E Ratio, also known as the CAPE Ratio, which 'normalizes' earnings has only been higher during the tech bubble and in late 2021.
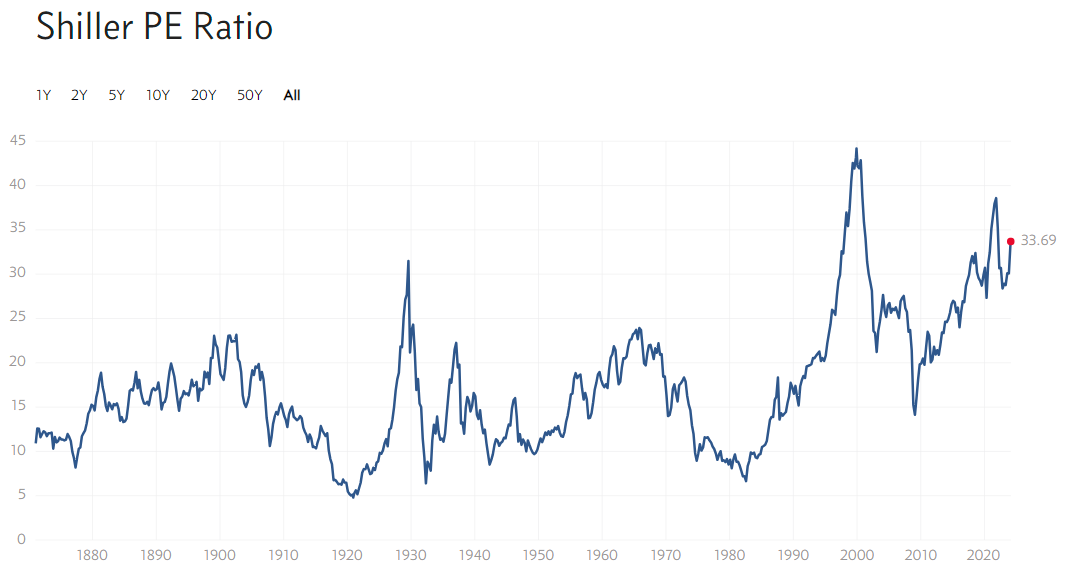
While I don't believe the economic data suggests we are in the pre-crash days of 2000 or 2007, the lesson of 2021-2022 should be fresh in everyone's mind – stocks simply cannot be priced this high with out exceptionally strong earnings growth. Expecting the Fed to save the markets to justify continued high prices is probably a mistake.
Depends on your time horizon
I typically only go to 1 or 2 industry conferences a year for many reasons that those closest to me understand. When I do attend, I'm there mainly to get a feel for overall sentiment of the attendees and speakers as well as to conduct preliminary due diligence on the exhibitors sponsoring the event. Last week at the Kingdom Advisors Conference provided a good proxy for the problem facing investment managers, financial planners, and individual investors.
Long-term things look relatively great
I heard several speakers and managers discuss the long-term positives happening in our economy, including:
- Re-shoring of production and our supply chain
- Re-training of our workforce to handle the re-shoring
- Demographic surge of the Millennial generation at the cusp of their peak earnings years
- AI/machine learning investment, productivity boost
- Strength of the US economy relative to the rest of the developed nations (including surviving the peak of China's attempt to become the dominant economic power)
I agree with all of the above and would add (maybe after the 2024 election) a new generation of leaders willing to address the imbalances created over the past 30 years in our government's handling of the economy.
Short-term things could get hairy
However, most of the above bullet points came from individual fund managers who must be 'always invested'. By nature they have to find the positive and focus on the long-term. At a panel of market strategists we saw the problem facing those who have a more flexible mandate and can take some money out of risky assets and wait for better opportunities.
First we heard from David Bahnsen, a former Morgan Stanley managing director who now runs his own wealth management firm. He highlighted several short-term problems:
- Valuations are impossibly high (earnings cannot grow enough to keep up with expectations based on economic growth)
- Geopolitical problems are boiling and likely to explode (due to large demographic and economic imbalances)
- US Fiscal Insanity (from both parties) cannot continue (austerity may be forced by bond investors)
- Monetary instability is not going anywhere (due to the Fed's constant meddling with the financial system)
Mr. Bahnsen highlighted something I've said for a decade or two – your starting valuation matters, and if you start at high valuations your long-term returns are likely going to be below average.
Bob Doll of Crossmark Global Funds followed Mr. Bahnsen with a "ditto" and then highlighted his 10 themes for 2024.
- A slight economic downturn occurs, as the unemployment rate surpasses 4.5% in the U.S.;
- The 2% through 3% inflation range, a ceiling in the 2010s, becomes the floor in the 2020s;
- The Federal Reserve cuts rates fewer times than the six suggested by the Fed funds futures curve;
- Credit spreads widen with declining interest rates;
- Earnings growth falls below the double-digit percentage consensus expectation;
- Stocks reach a new all-time high early in the year but experience a subsequent decline;
- Energy, financials and consumer staples outperform utilities, health care and real estate;
- Faith-based industry assets under management share increases for the eighth consecutive year;
- Geopolitical crosscurrents multiply but have minimal impact on markets; and
- In November, the White House, Senate and House all switch parties.
Mr. Doll stood by his recession call from 2023 and highlighted how March would be the MEDIAN start date of a recession following a peak in the inverted yield curve.
Thankfully for SEM, we don't have to make predictions or trust our 'gut' to adjust allocations (more on that below), but it does highlight the importance of time horizon. My key takeaway is based on the current environment, you should not be adjusting your risk allocation HIGHER at today's prices simply because you want higher returns. Patience will be the key. Better entry points will arrive.
Market Charts
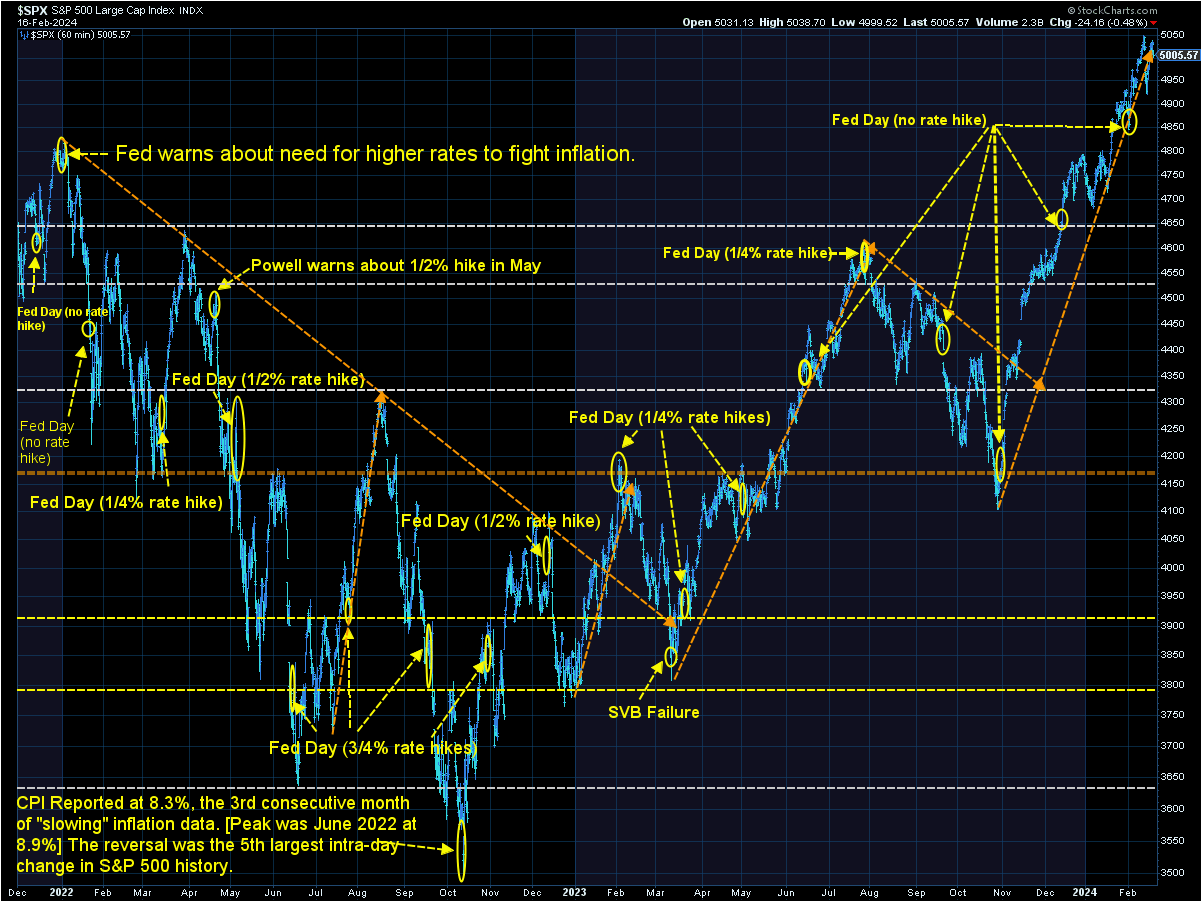
The S&P 500 continues to march higher in a spectacular uptrend. One thing that crossed my mind last Tuesday as the CPI disappointed was how 'surprised' everyone seemed to be at the beginning of 2021 (after another spectacular uptrend) when the Fed said, 'oh by the way, uh, inflation is kind of a problem and we were wrong. Rates are going to have to go higher.'
How short our memory is. Everyone believes the Fed knows what they are doing and won't reverse course when they end up being wrong.
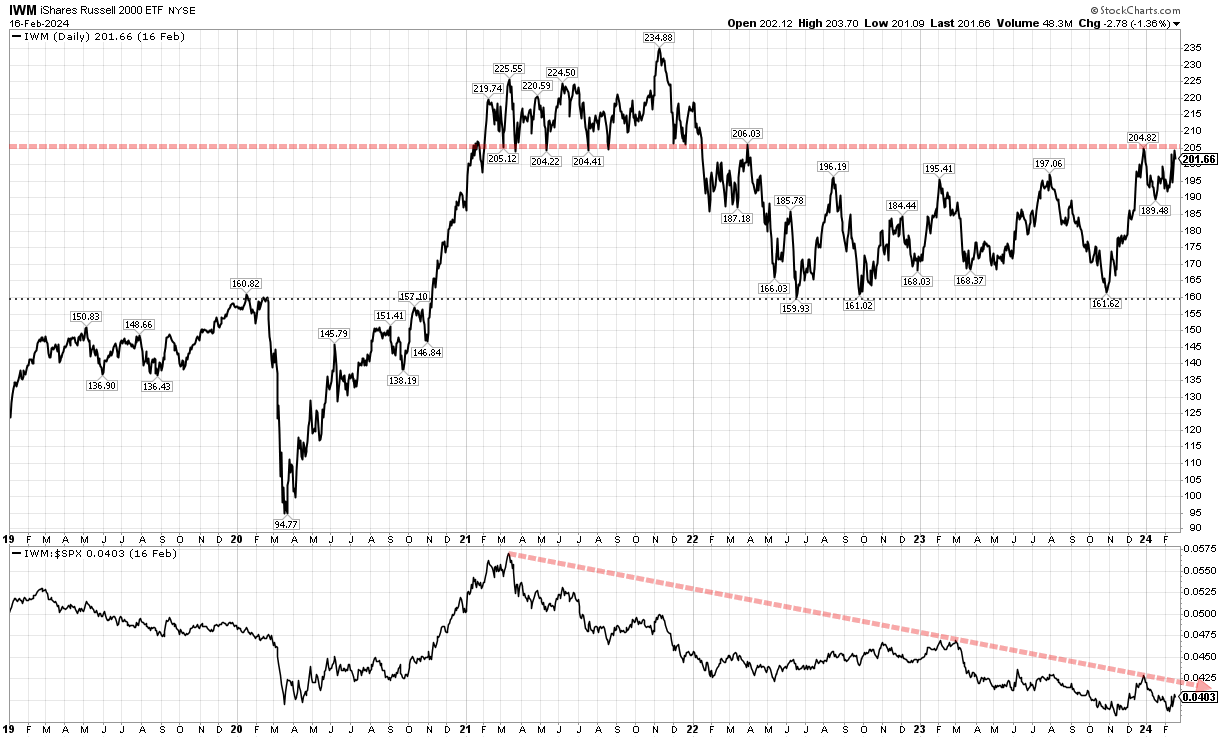
If I'm to get excited longer-term for stocks I'm going to have to see improvement in this chart. It plots the Small Cap Russell 2000 ETF on the top chart and the Russell 2000 vs the S&P 500 on the bottom. Small caps are a long way from their highs and the trend versus the S&P remains down. If institutional managers were truly seeing good things happening they'd be allocating more money to small caps and out of the high priced large caps.
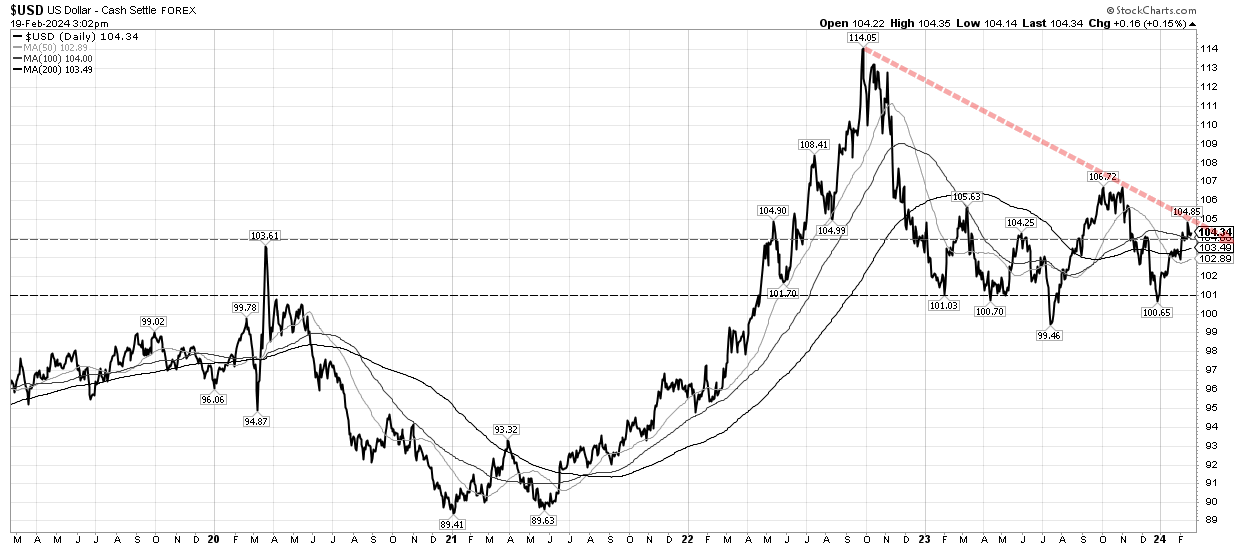
The other chart I'm watching is the US Dollar Index. Notice the dollar has been declining since late 2022 (which is when stocks bottomed). This has been a significant tailwind to US companies, especially tech companies. It has led to strong improvement in the US trade deficit and has made our debt 'cheaper' to pay back. If the Fed were perceived to be losing the inflation fight, those tailwinds could quickly turn into headwinds like we had in 2022.
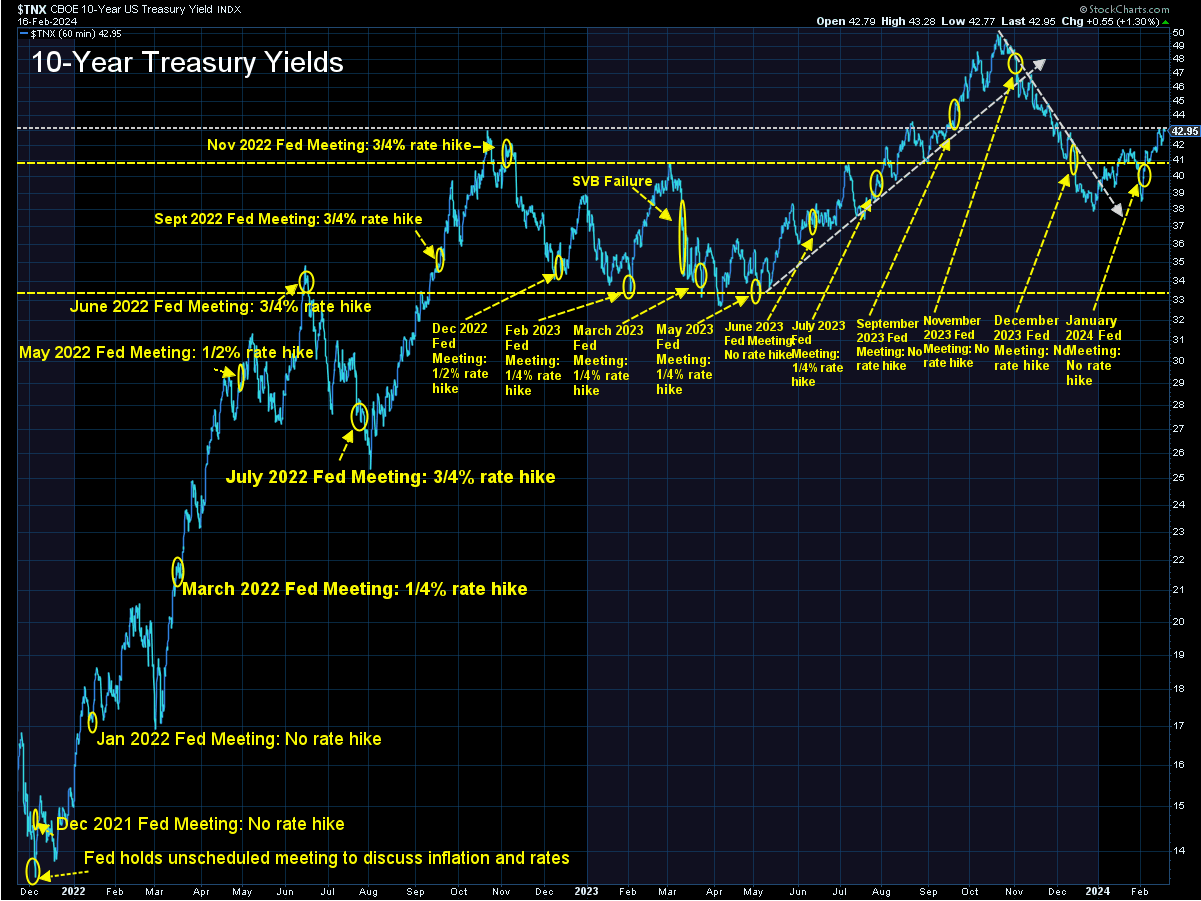
Which brings us to interest rates where we are dangerously close to breaking back above the 4.30% upper band which led to the 10-year moving up to 5% last October.
The bulls and the market are performing a high wire act, which is not easy to do. Best of luck if you're in that camp!
SEM Model Positioning
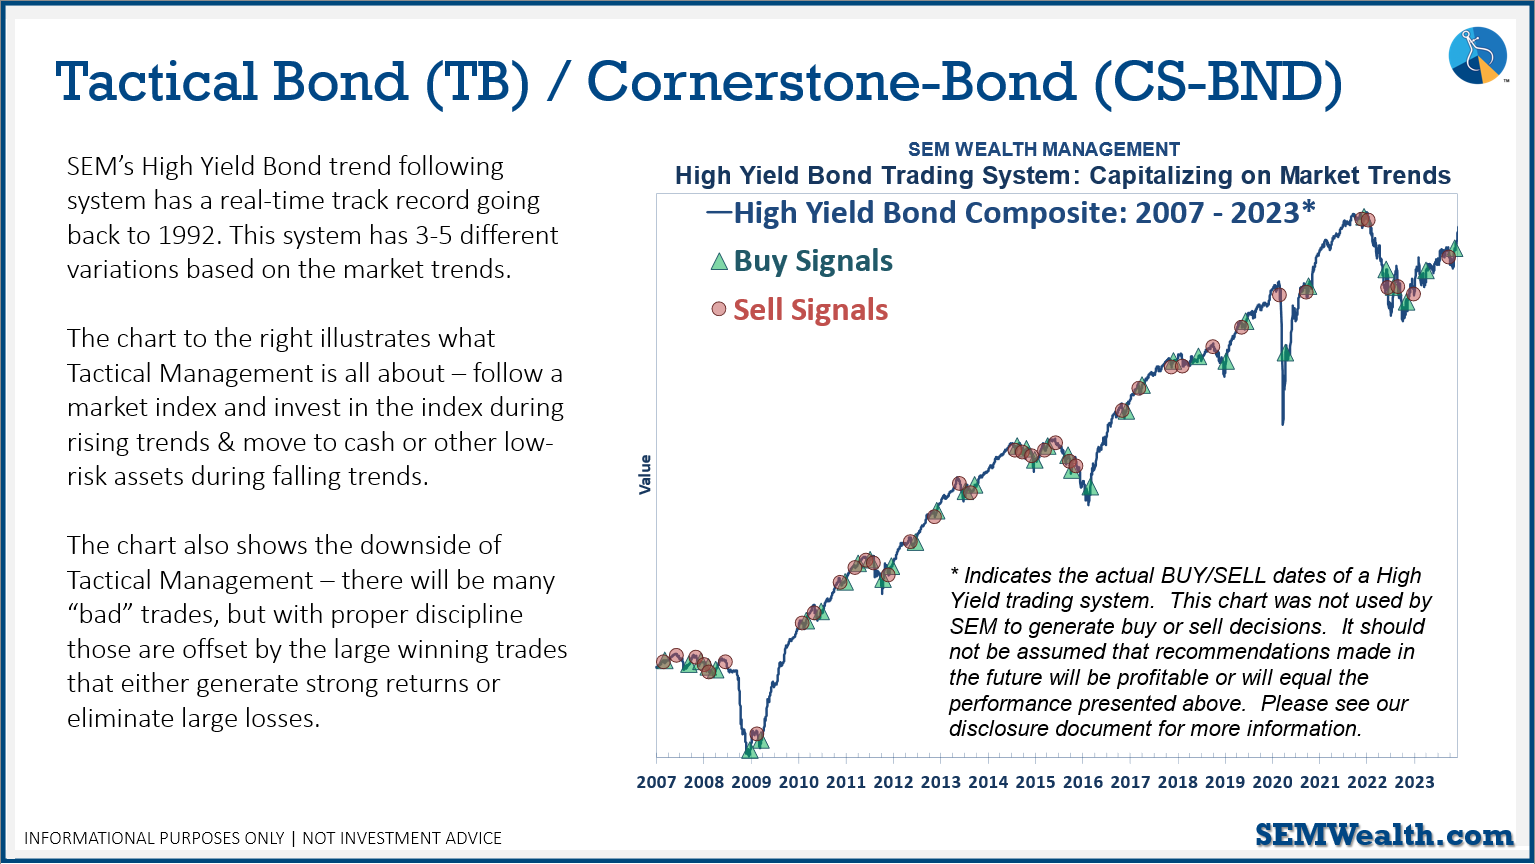
-Tactical High Yield went on a buy 11/3/2023
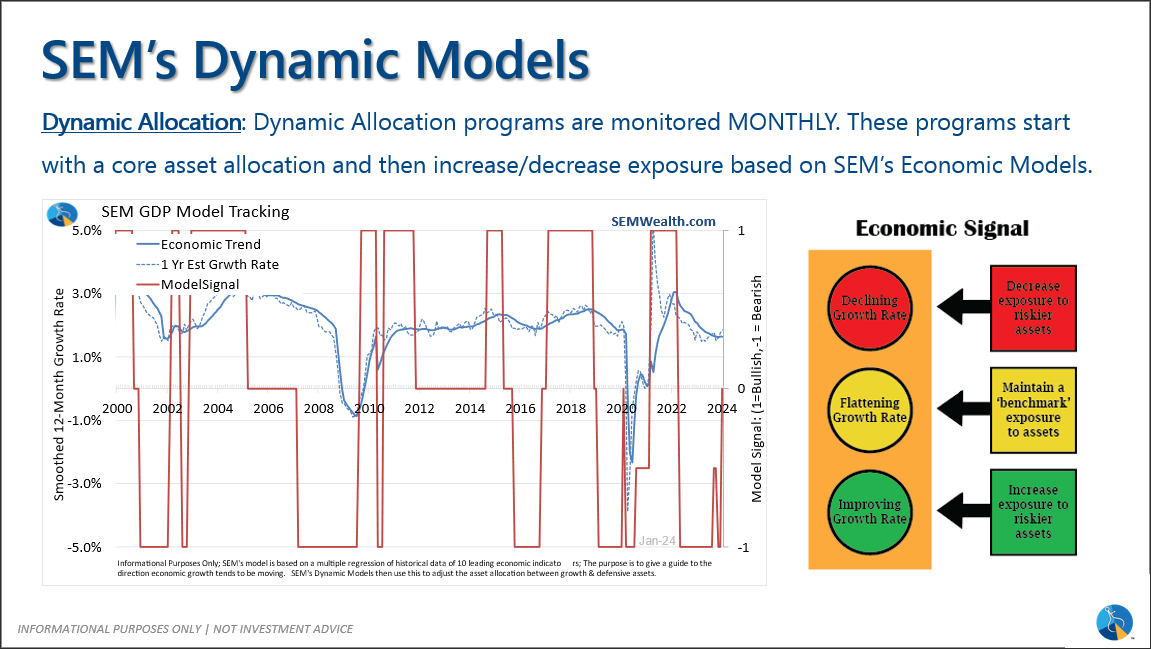
-Dynamic Models went to 'neutral' 2/5/2024
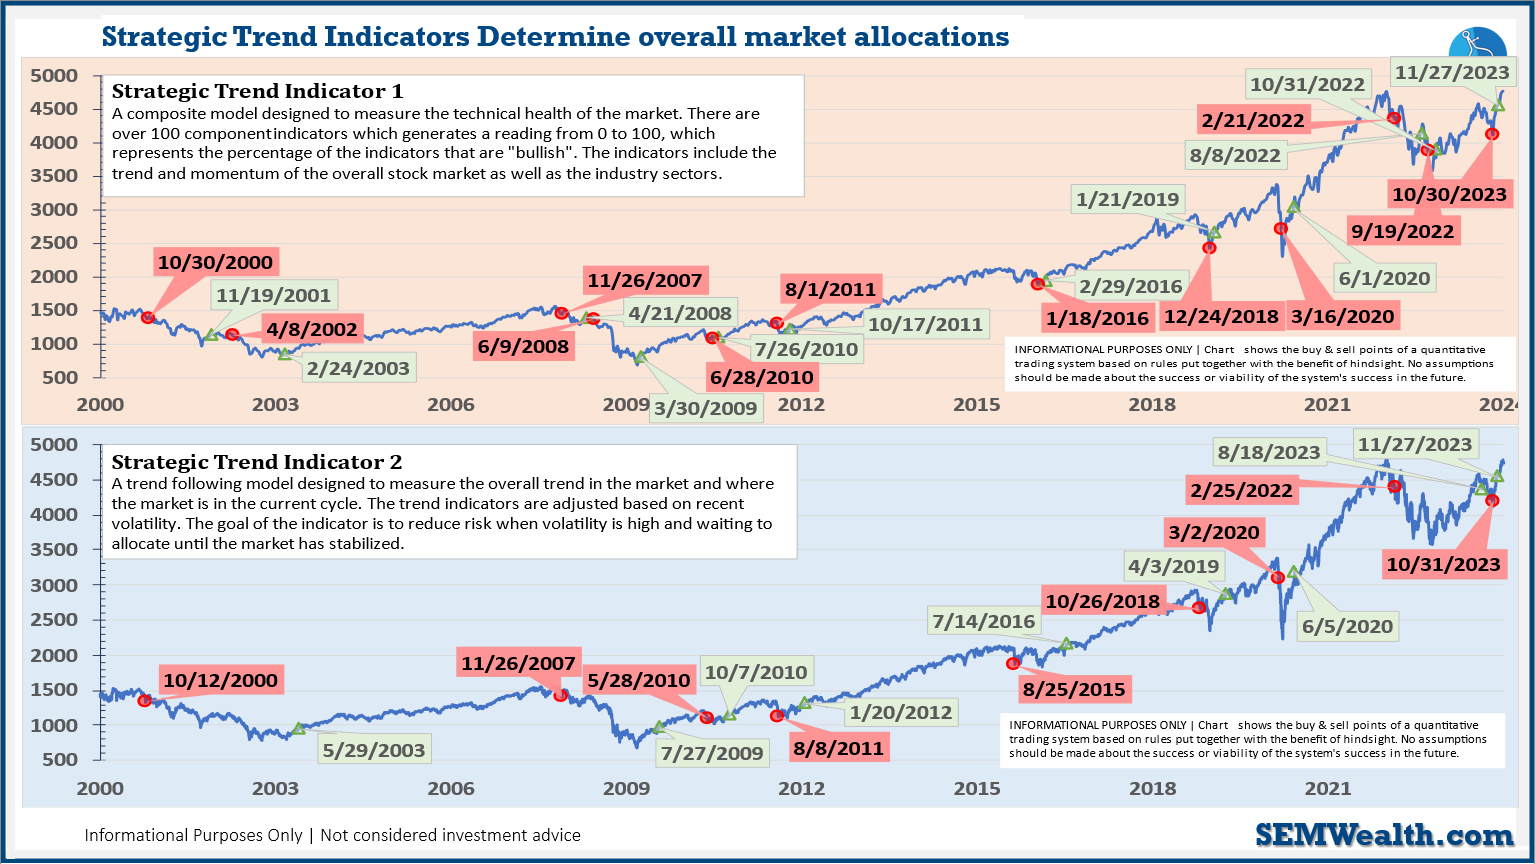
-Strategic Trend Models went on a buy 11/27/2023
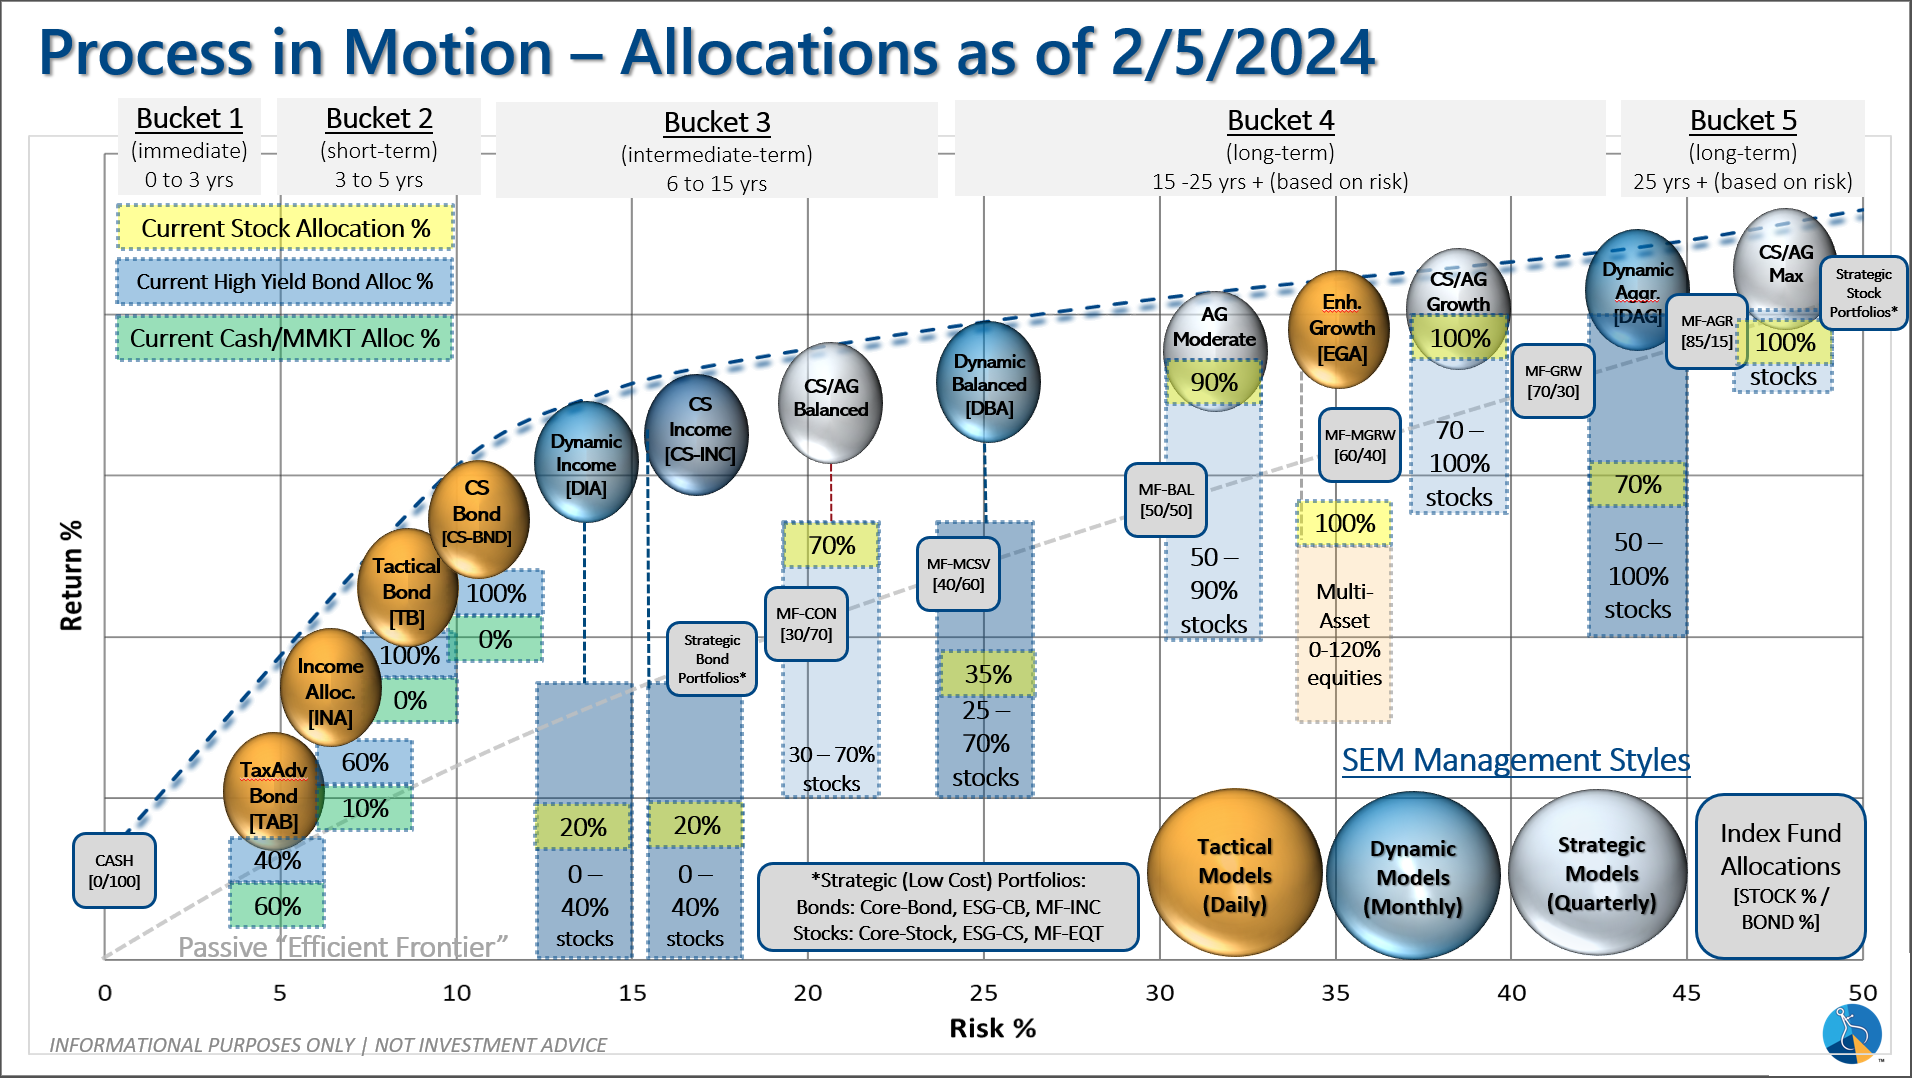
SEM deploys 3 distinct approaches – Tactical, Dynamic, and Strategic. These systems have been described as 'daily, monthly, quarterly' given how often they may make adjustments. Here is where they each stand.
Tactical (daily): The High Yield Bond system bought the beginning of April and issued all 3 sell signals 9/28/2023. All 3 systems were back on buy signals by the close on 11/3/2023. The bond funds we are invested in are a bit more 'conservative' than the overall index, but still yielding between 7.5 -8.5% annually.
Dynamic (monthly): At the beginning of December the economic model reverted back to "bearish". This was reversed at the beginning of February. This means benchmark positions – 20% dividend stocks in Dynamic Income and 20% small cap stocks in Dynamic Aggressive Growth.
Strategic (quarterly)*:
BOTH Trend Systems reversed back to a buy on 11/27/2023
The core rotation is adjusted quarterly. On August 17 it rotated out of mid-cap growth and into small cap value. It also sold some large cap value to buy some large cap blend and growth. The large cap purchases were in actively managed funds with more diversification than the S&P 500 (banking on the market broadening out beyond the top 5-10 stocks.) On January 8 it rotated completely out of small cap value and mid-cap growth to purchase another broad (more diversified) large cap blend fund along with a Dividend Growth fund.
The * in quarterly is for the trend models. These models are watched daily but they trade infrequently based on readings of where each believe we are in the cycle. The trend systems can be susceptible to "whipsaws" as we saw with the recent sell and buy signals at the end of October and November. The goal of the systems is to miss major downturns in the market. Risks are high when the market has been stampeding higher as it has for most of 2023. This means sometimes selling too soon. As we saw with the recent trade, the systems can quickly reverse if they are wrong.
Overall, this is how our various models stack up based on the last allocation change: