The nice part about using a quantitative approach is we don't have to ask questions when the data disagrees with our opinion. The data is the only thing that matters. As we wrap up another month for SEM's economic model, I'll give you the conclusion first – the economic data says the economy continues to chug along at a nice pace. There are no signs of recession.
What this means for 'soft landing' vs. 'hard landing' debates, interest rate cuts vs. no interest rate cuts, inflation declining vs. inflation increasing, or any other opinions I will leave to the talking heads and "experts". To us it doesn't matter.
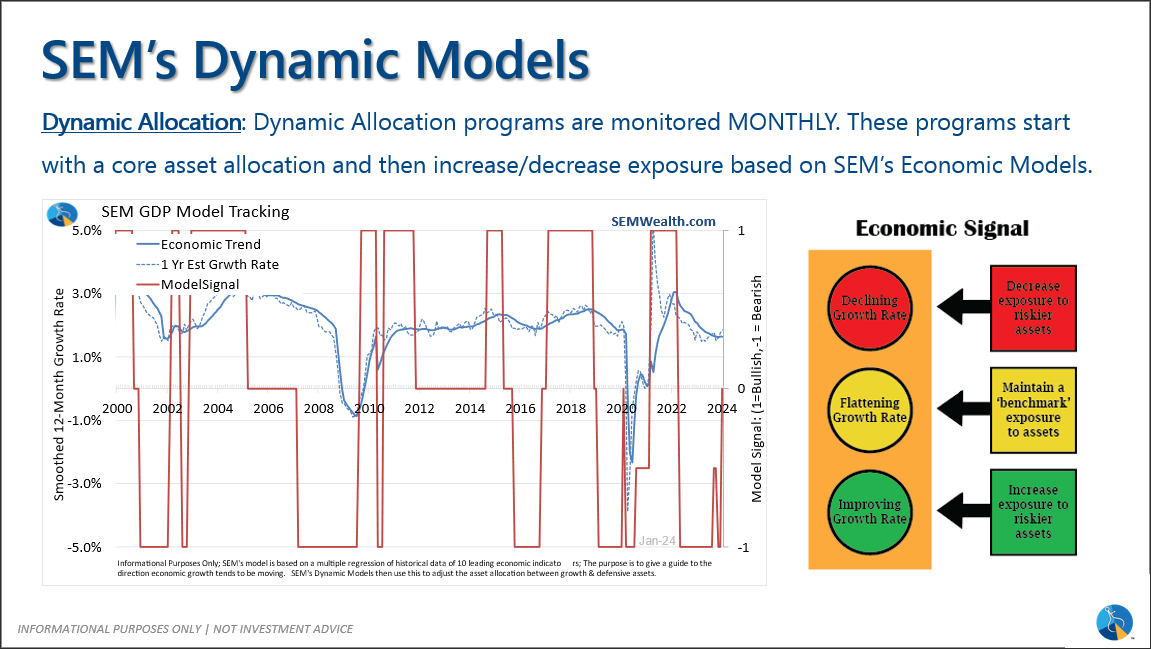
I developed SEM's economic model back in 1995. Other than adding the ISM Services Business Activity in the mid 2000s when it debuted there have been very few tweaks to it. It is by no means perfect, but it has a very decent track record of being right with respect to the general direction of growth. We've just gone through an unprecedented 4 years. Between the economy purposely being shut down, to the government and the Federal Reserve dumping 50% of GDP output into the financial system, to the Fed hiking rates as aggressively as they did in the early 1980s it is safe to say all quantitative models have been put to the test.
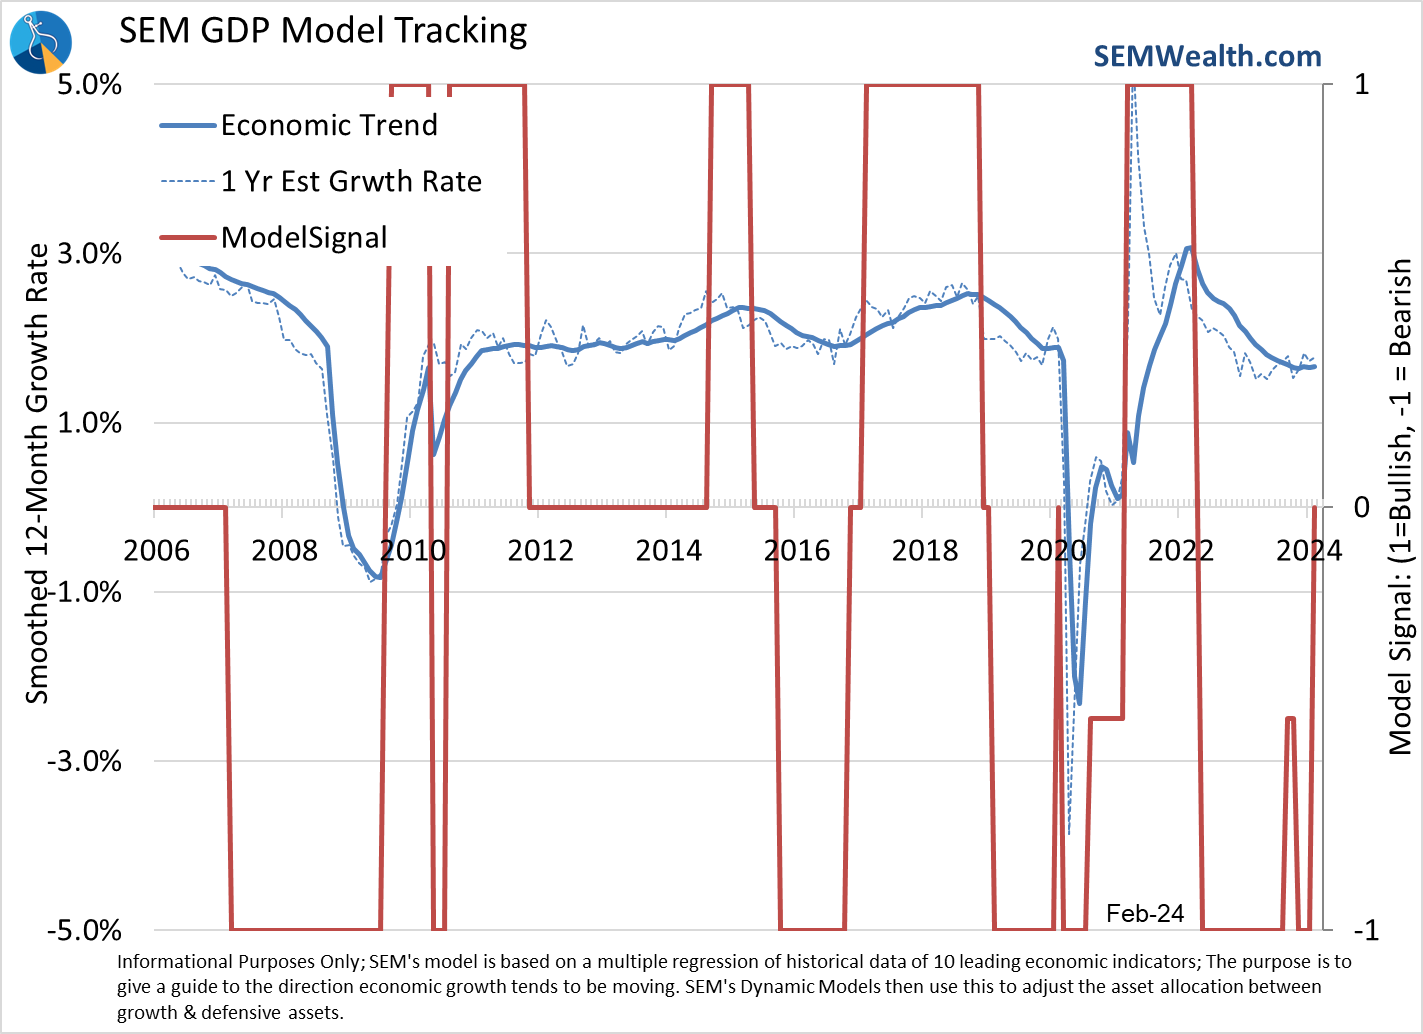
The economic model (correctly) was bearish beginning in late 2019 (due to the sugar high of the tax cuts wearing off). While the economy bottomed in September 2020, the model didn't catch-up until the spring of 2021. It correctly rode that wave before getting bearish in April 2022, just as the 2 negative quarters of declining GDP occurred. With the Fed hiking rates aggressively the model stayed 'bearish' until last month. This made sense historically as it takes 9-12 months for the impact of rate changes to filter through the economy. This indeed happened and as that pressure eased, the model reverted back to 'normal'.
This is where we stand today.
The upside is when the model was (temporarily) 'wrong' the past 4 years it did not hurt performance in the Dynamic models. The asset allocations the models held helped to offset being wrong directionally. Dynamic Income has had a spectacular run compared to the Aggregate Bond market the past several years – losing significantly less during the 2022 bear market and then making more on the upside during the recovery. Dynamic Aggressive (DAG) has also been one of our stars where even with a 50% stock allocation in 2023 due to our 'bearishness' we nearly kept up with the Total Stock Market Index. This was after losing much less than the stock market during 2022. 2024 so far has been a great year for DAG.
That's one thing important to understand about SEM – we don't rely on just one model. On the Dynamic side the economic model is the primary driver, but there are other components inside which dictate the asset allocation to protect the models from being too "wrong".
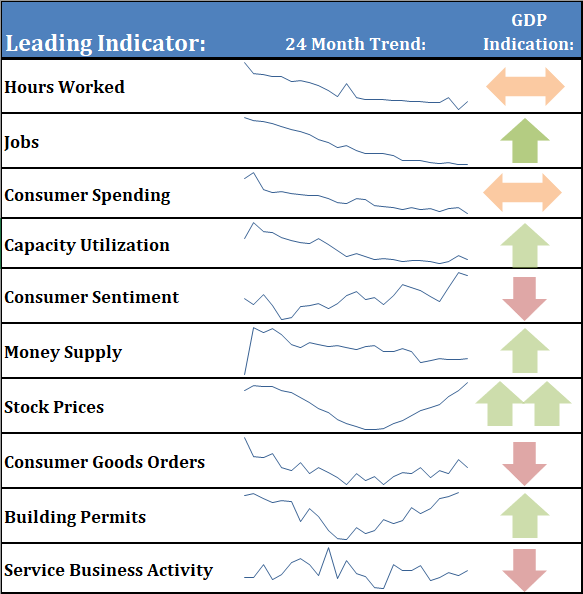
Turning back to the economy, we'll save you some time this month and just focus on a couple of data points. First, here is our dashboard:
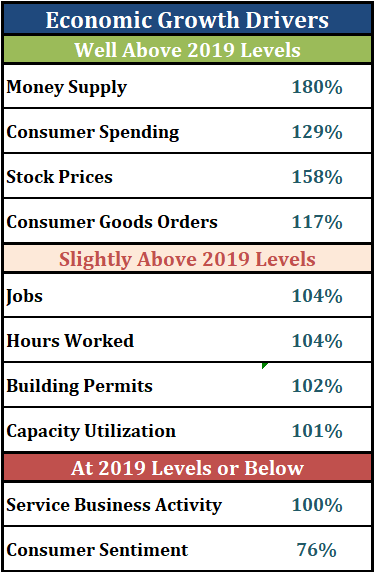
And here is the updated table I created a few months back to highlight our return to 'normal' (pre-2020 economic data):
Last month I highlighted the single best indicator in our system if I was forced to use only one.
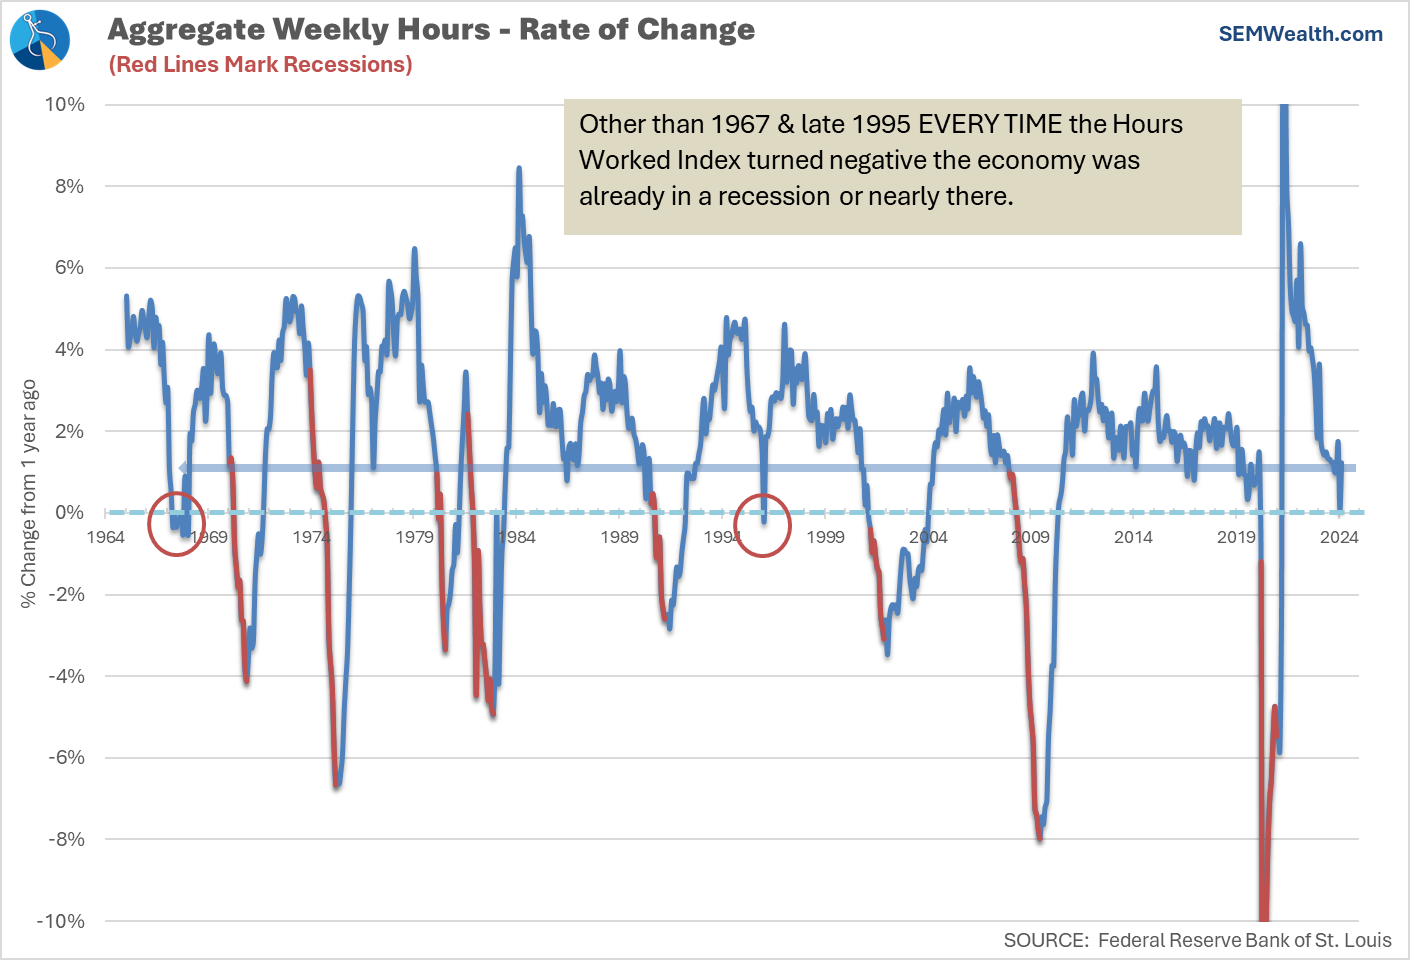
A related and close second is the % from the 1-year low for initial jobless claims.
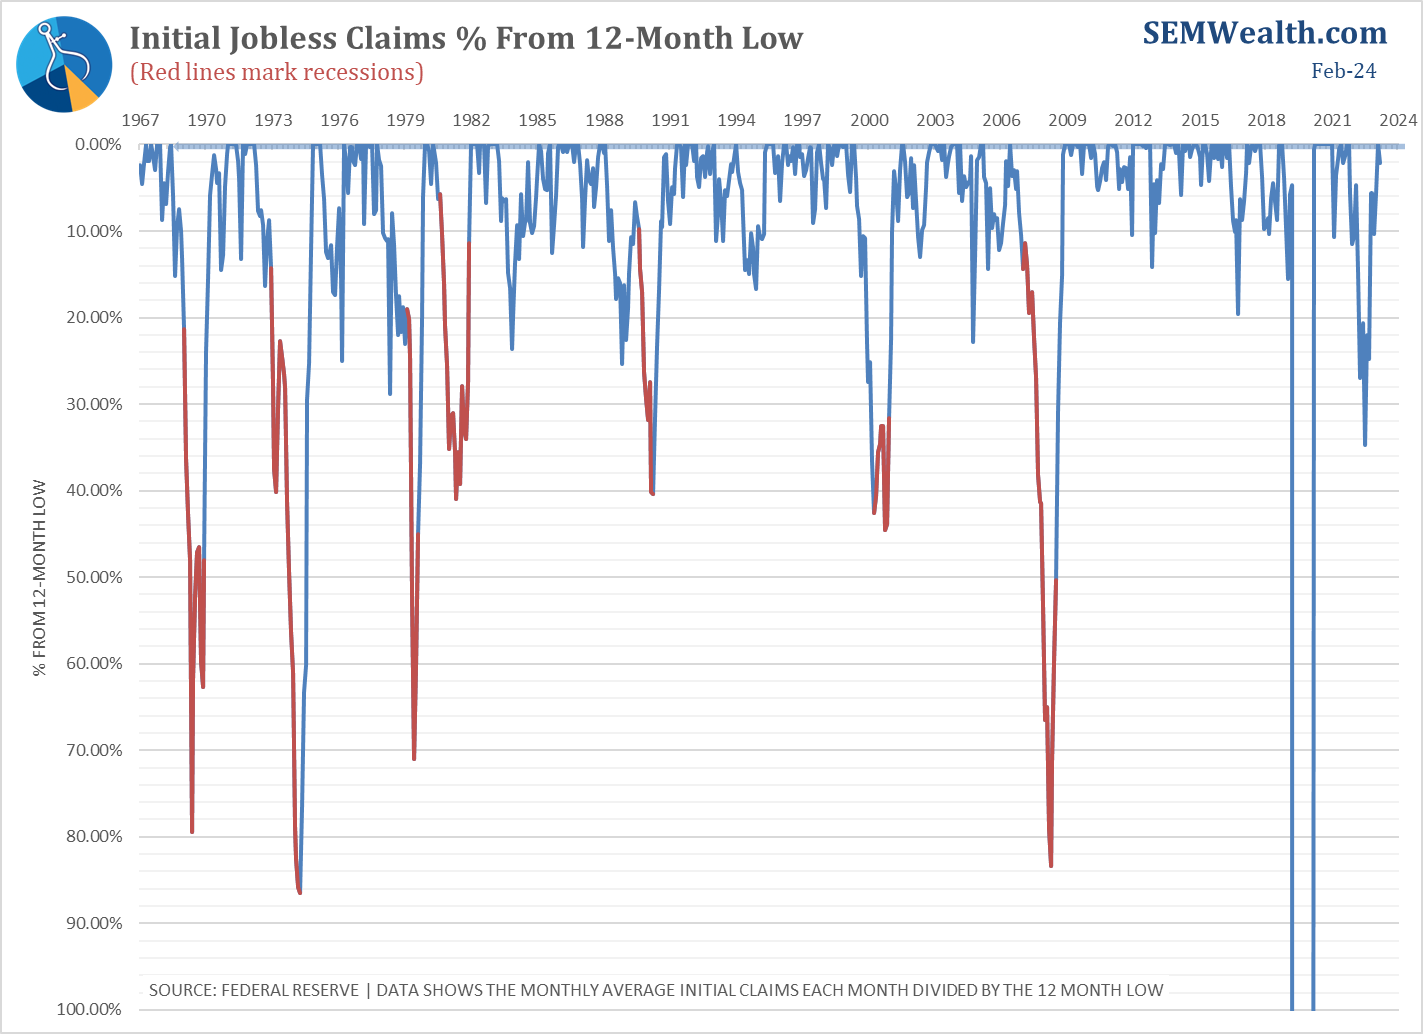
Both indicators are showing no signs of a slowdown. Until they do it's hard to be negative on the economic outlook.
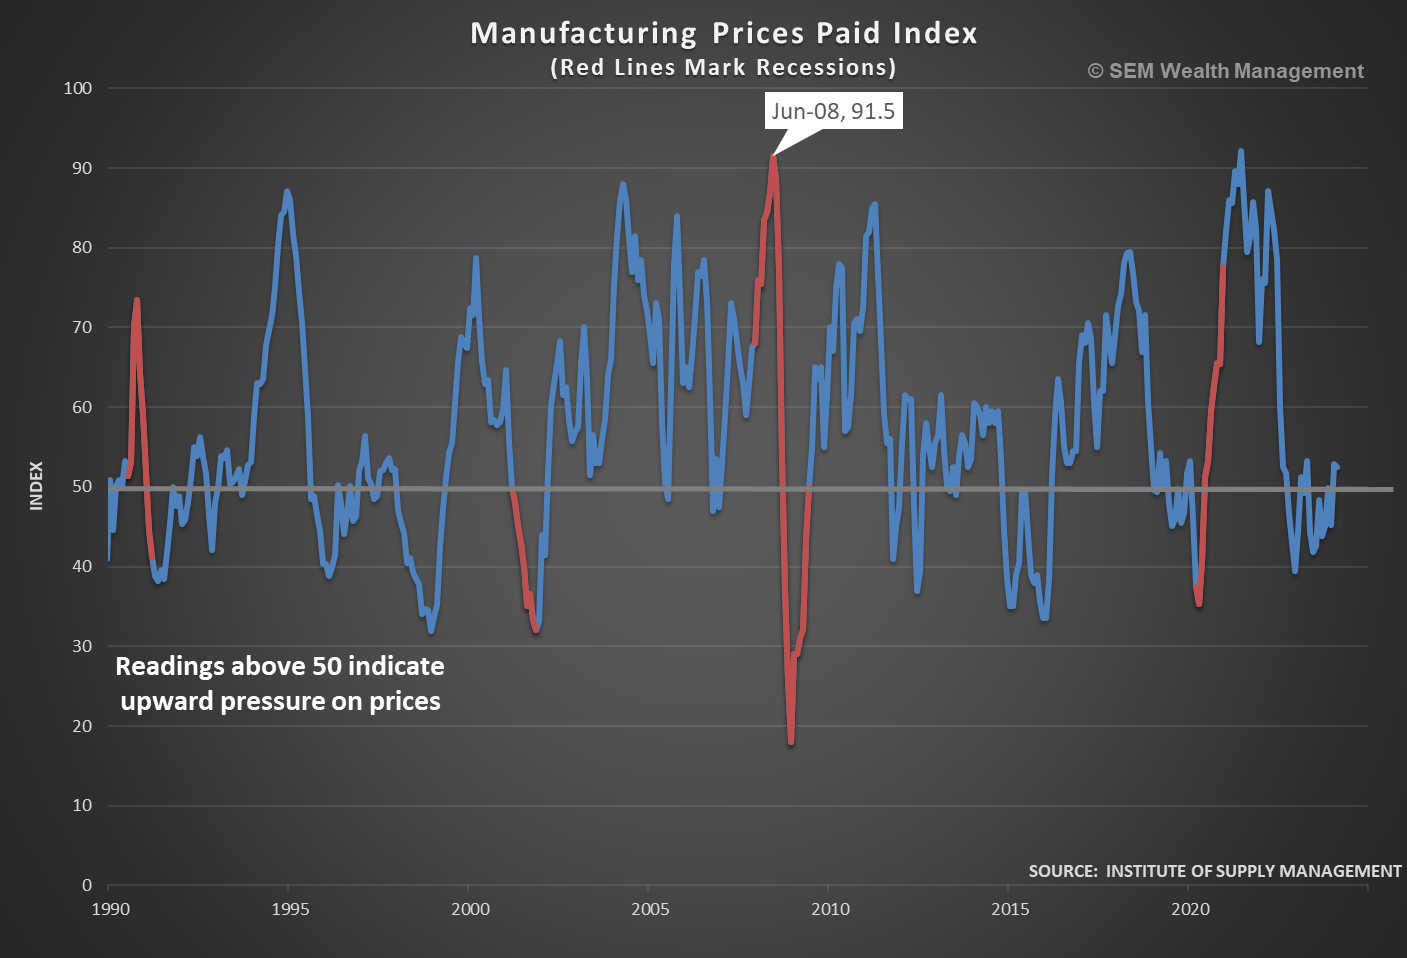
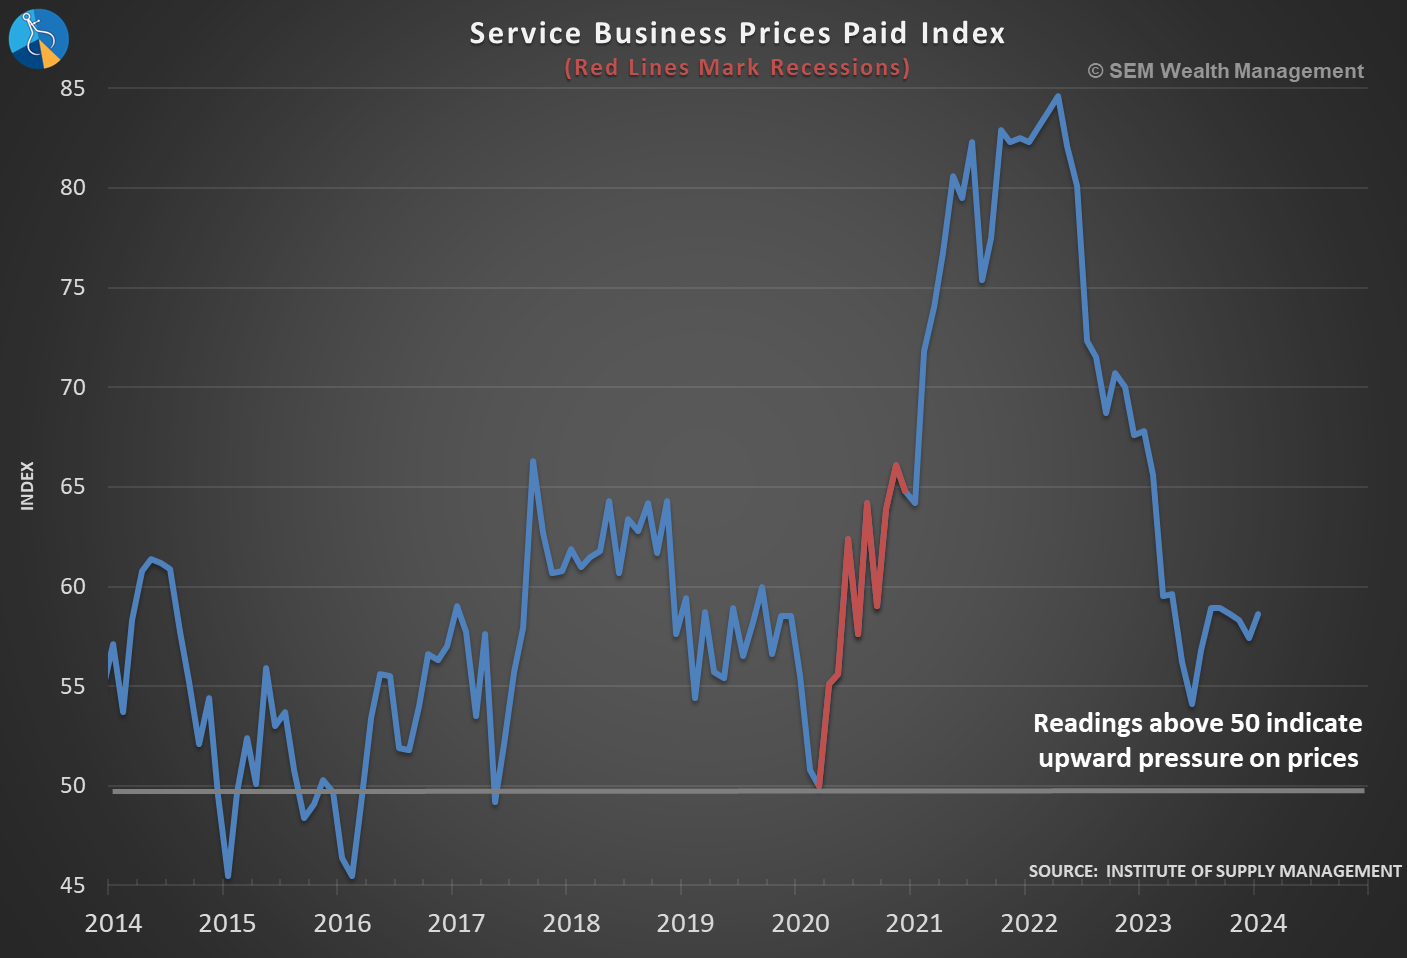
However, the problem with the economy "chuggin along" is it can cause inflation to remain higher than the Fed is comfortable with which means interest rates not coming down as rapidly as the market is expecting. Last week we took a look at inflation and interest rates:
Both Manufacturing and Service Businesses are seeing increased pricing pressures:
Market Charts
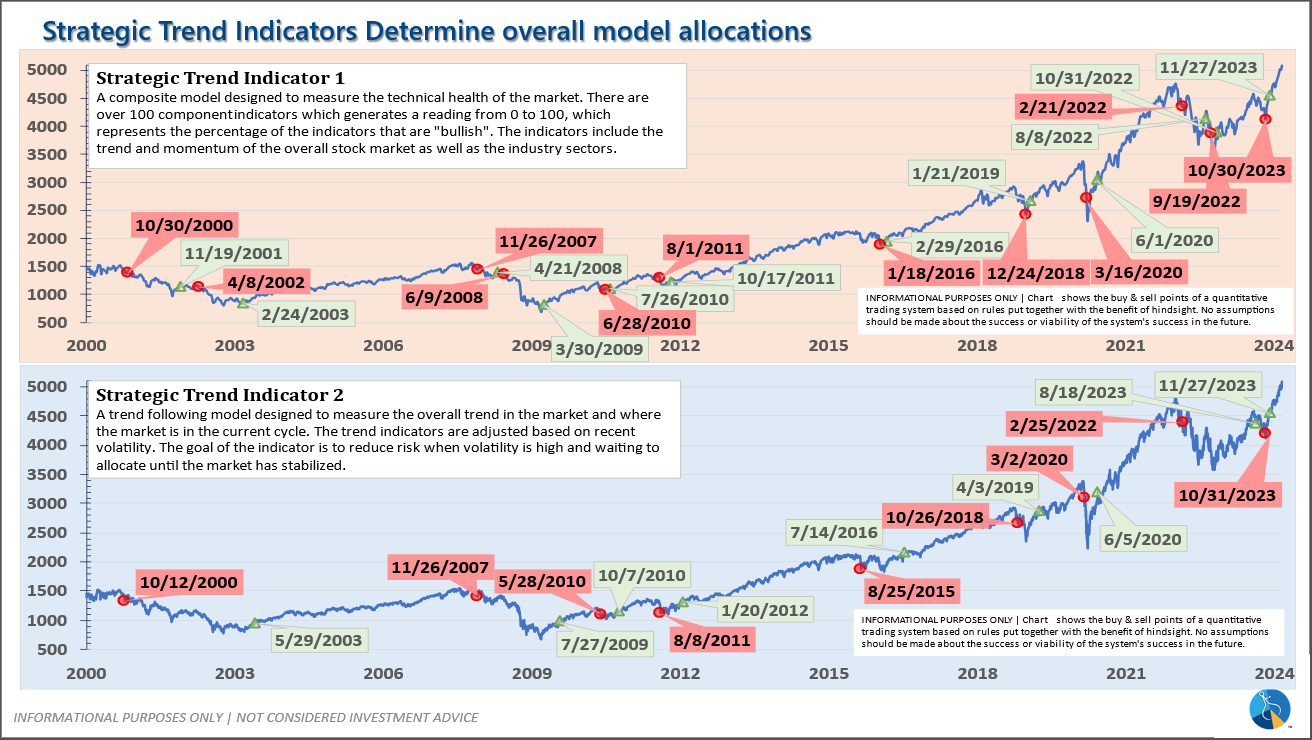
I've simplified the daily tracking of the S&P chart to show the key trend changes (with the benefit of hindsight of course). This shows us the 'narrative' of the market at that time:
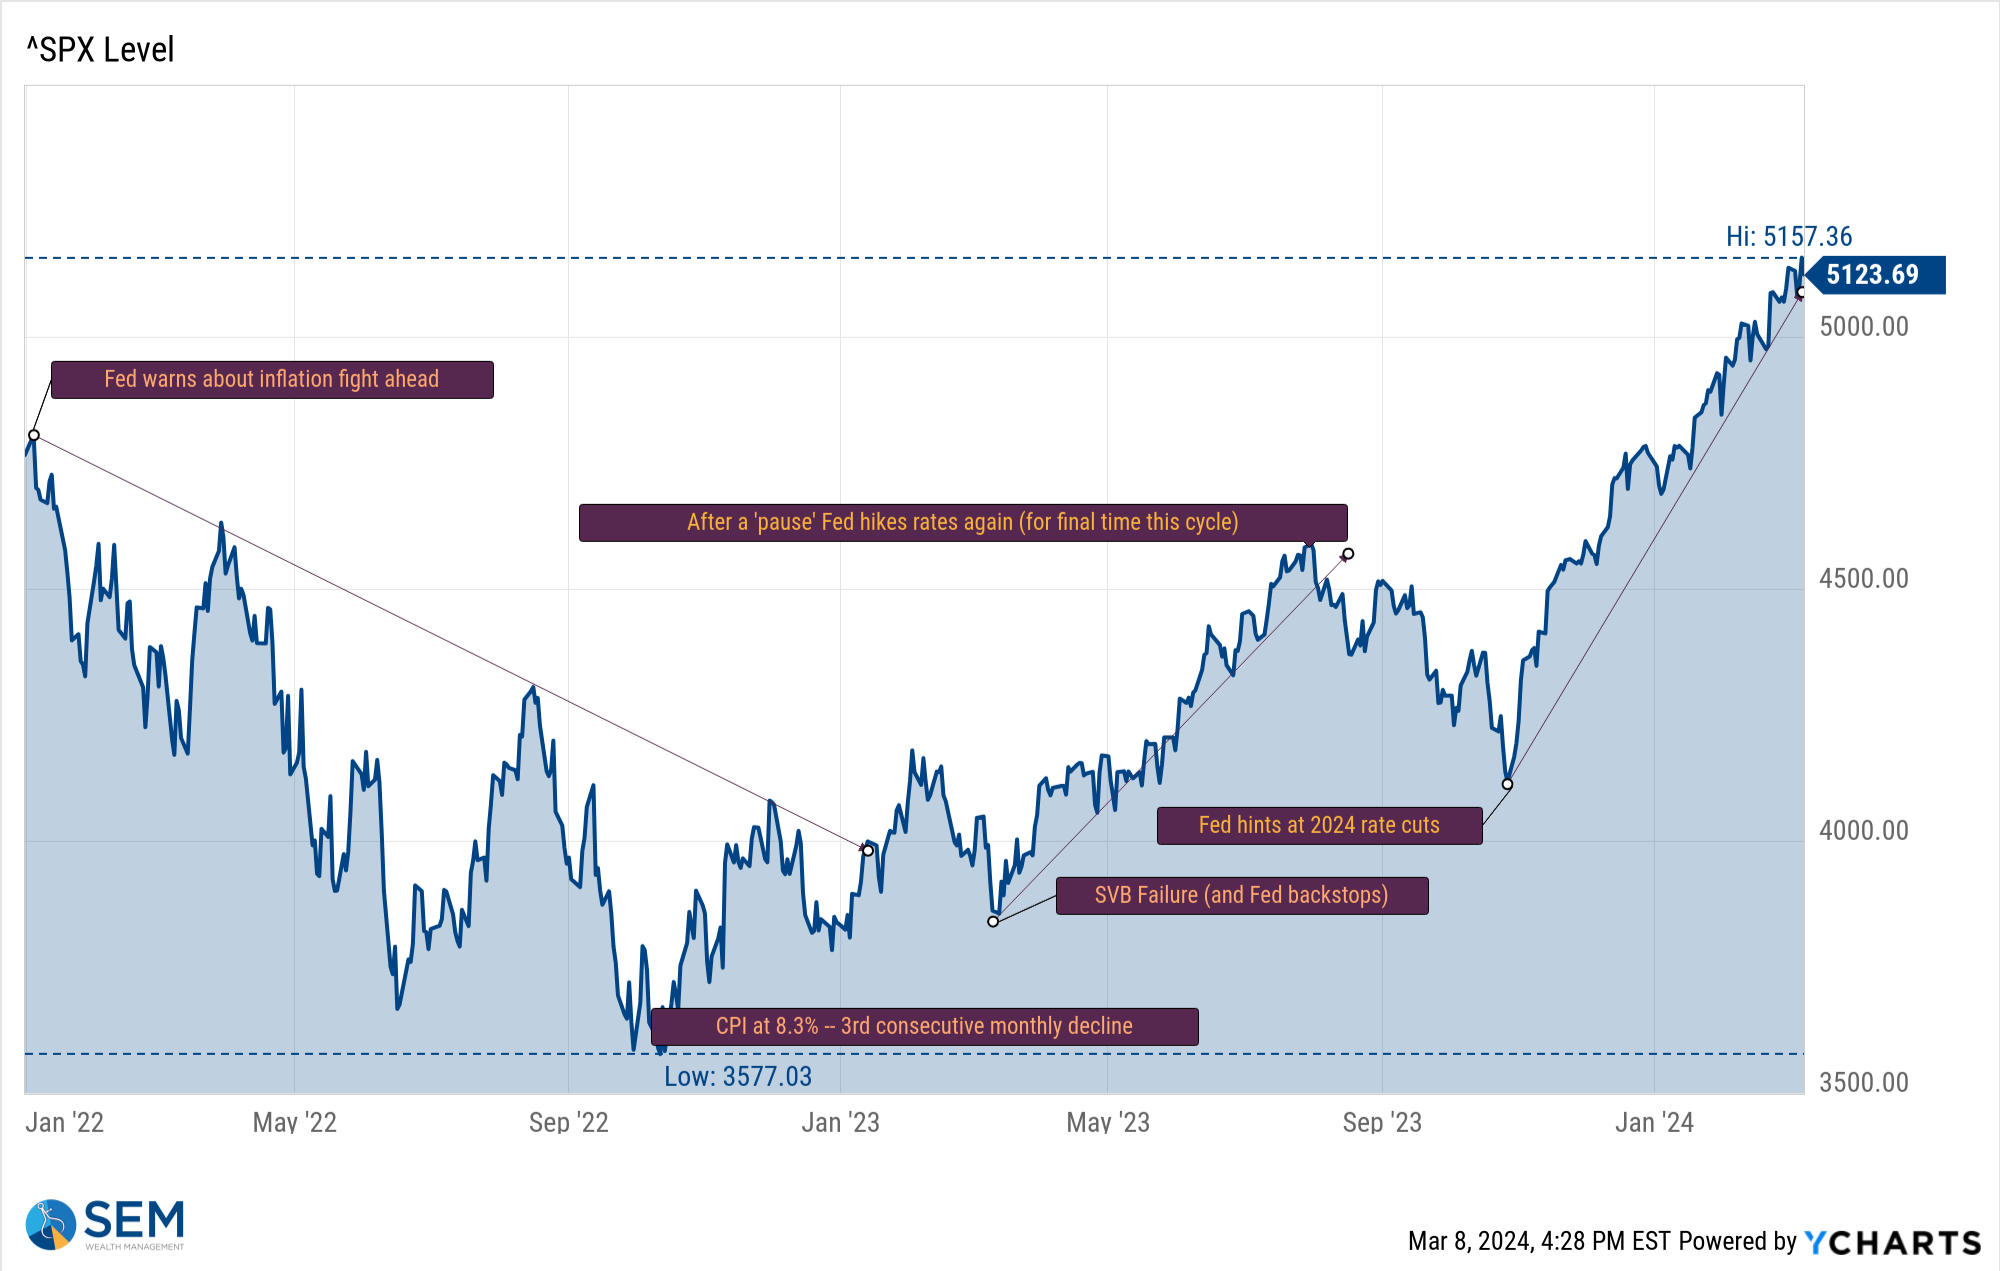
1.) January 2022 - October 2022: The Fed is fighting inflation
2.) October 2022 - February 2023: Inflation has bottomed
3.) February/March 2023: Inflation fight has caused collateral damage
4.) March 2023 - August 2023: Fed has our back no matter what
5.) August 2023 - October 2023: Maybe the Fed doesn't have our back
6.) November 2023: Fed is done and the next move is to STIMULATE.
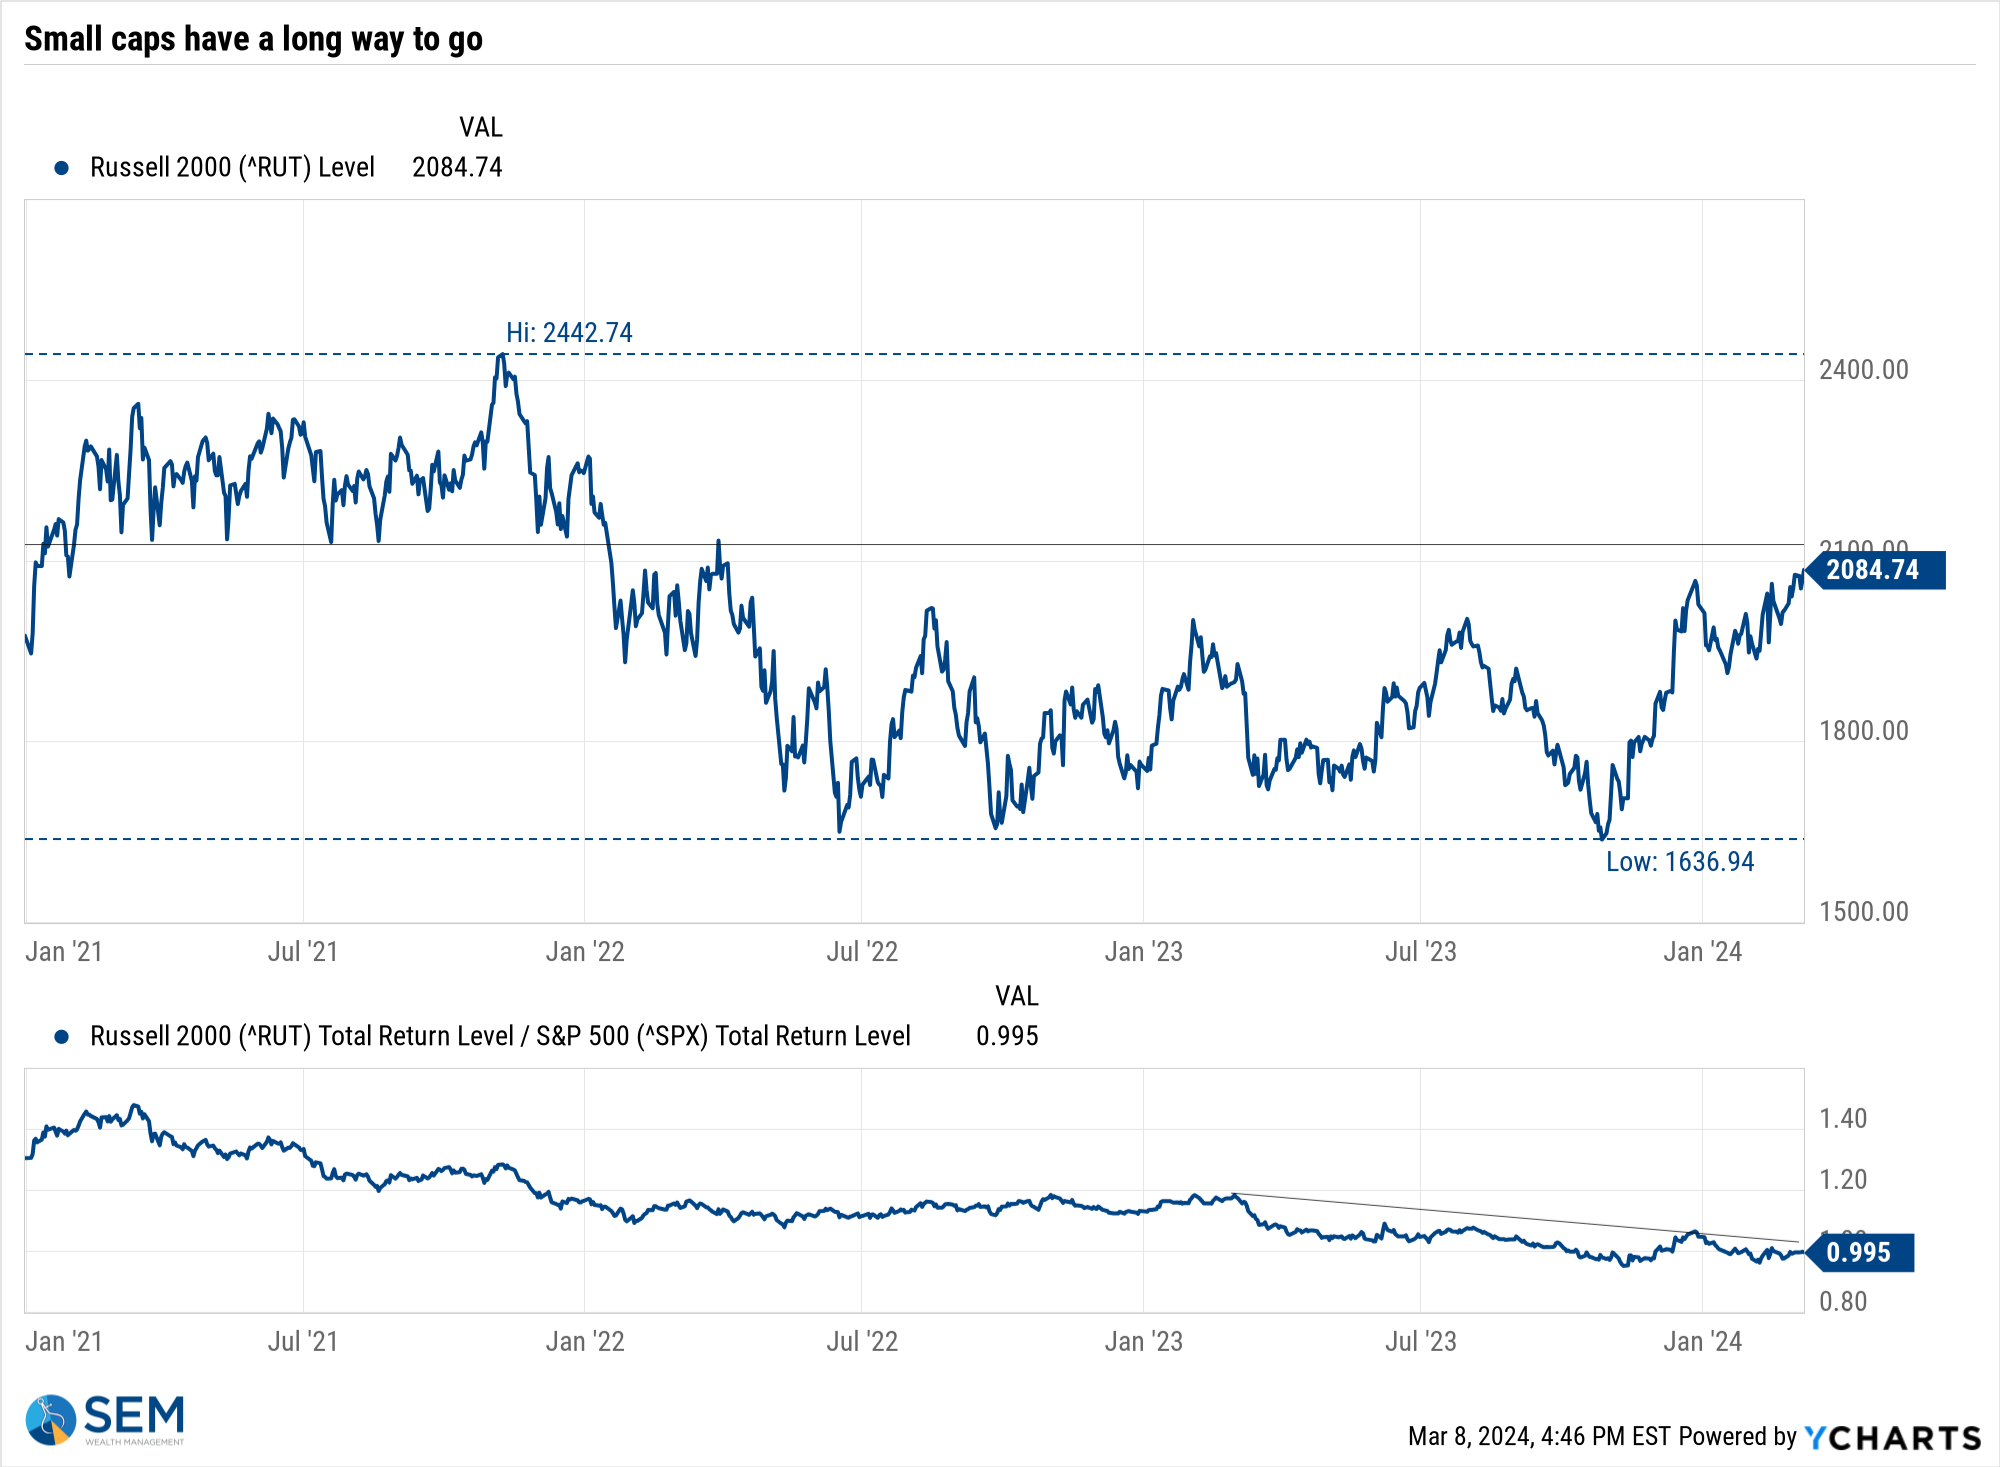
While the large (mega) cap stocks enjoy seemingly daily new record highs, small cap stocks continue to struggle.
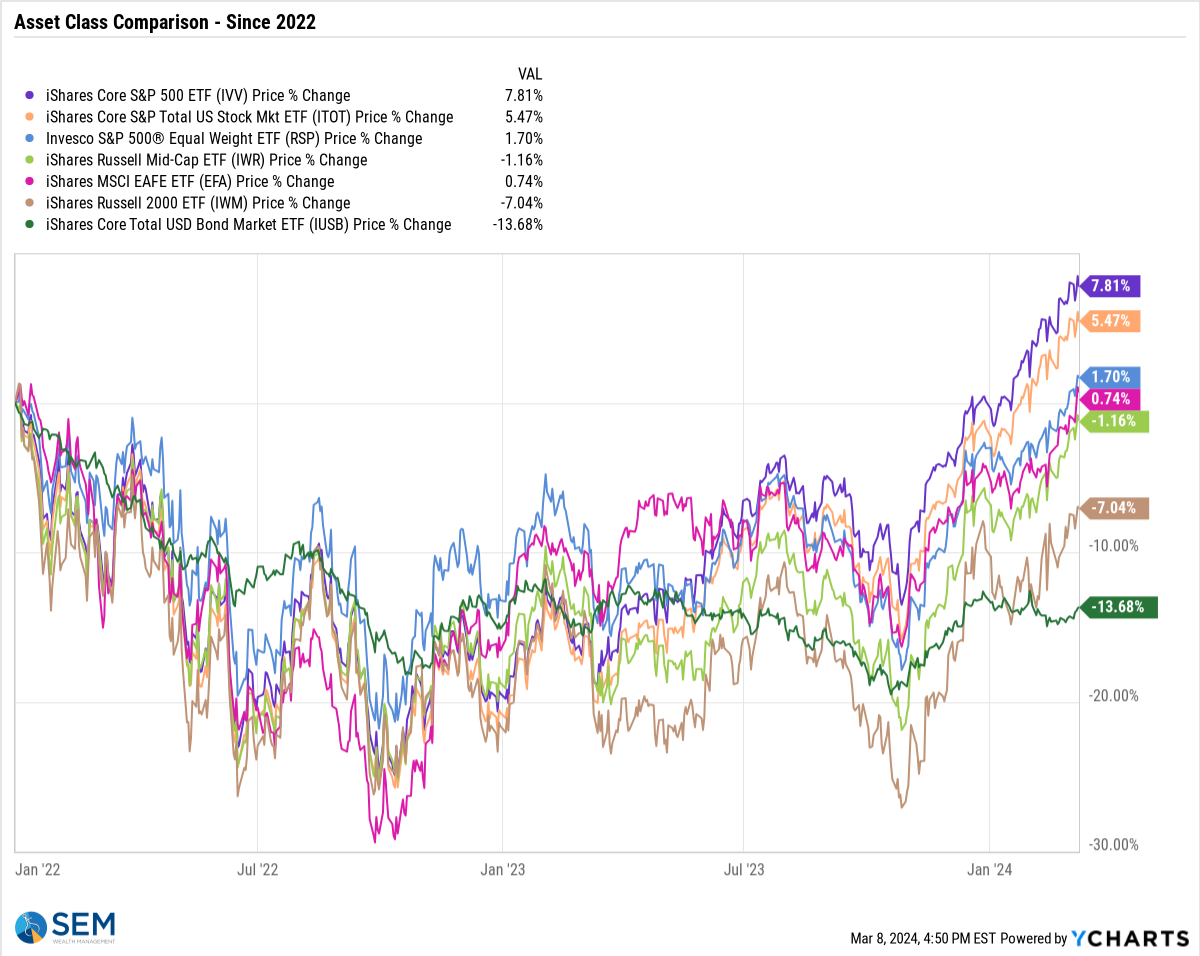
This is another good way to study the market. Since the peak in 2022 the S&P is now up 8%. The overall US stock market is up 5.5%, but the EQUAL Weight S&P 500 is only up 2%. Mid Cap and Small cap stocks are down 1 & 7% respectively. Bonds are still down a whopping 14%, meaning somebody in a traditional 60/40 stock/bond portfolio is down around 1% during that time.
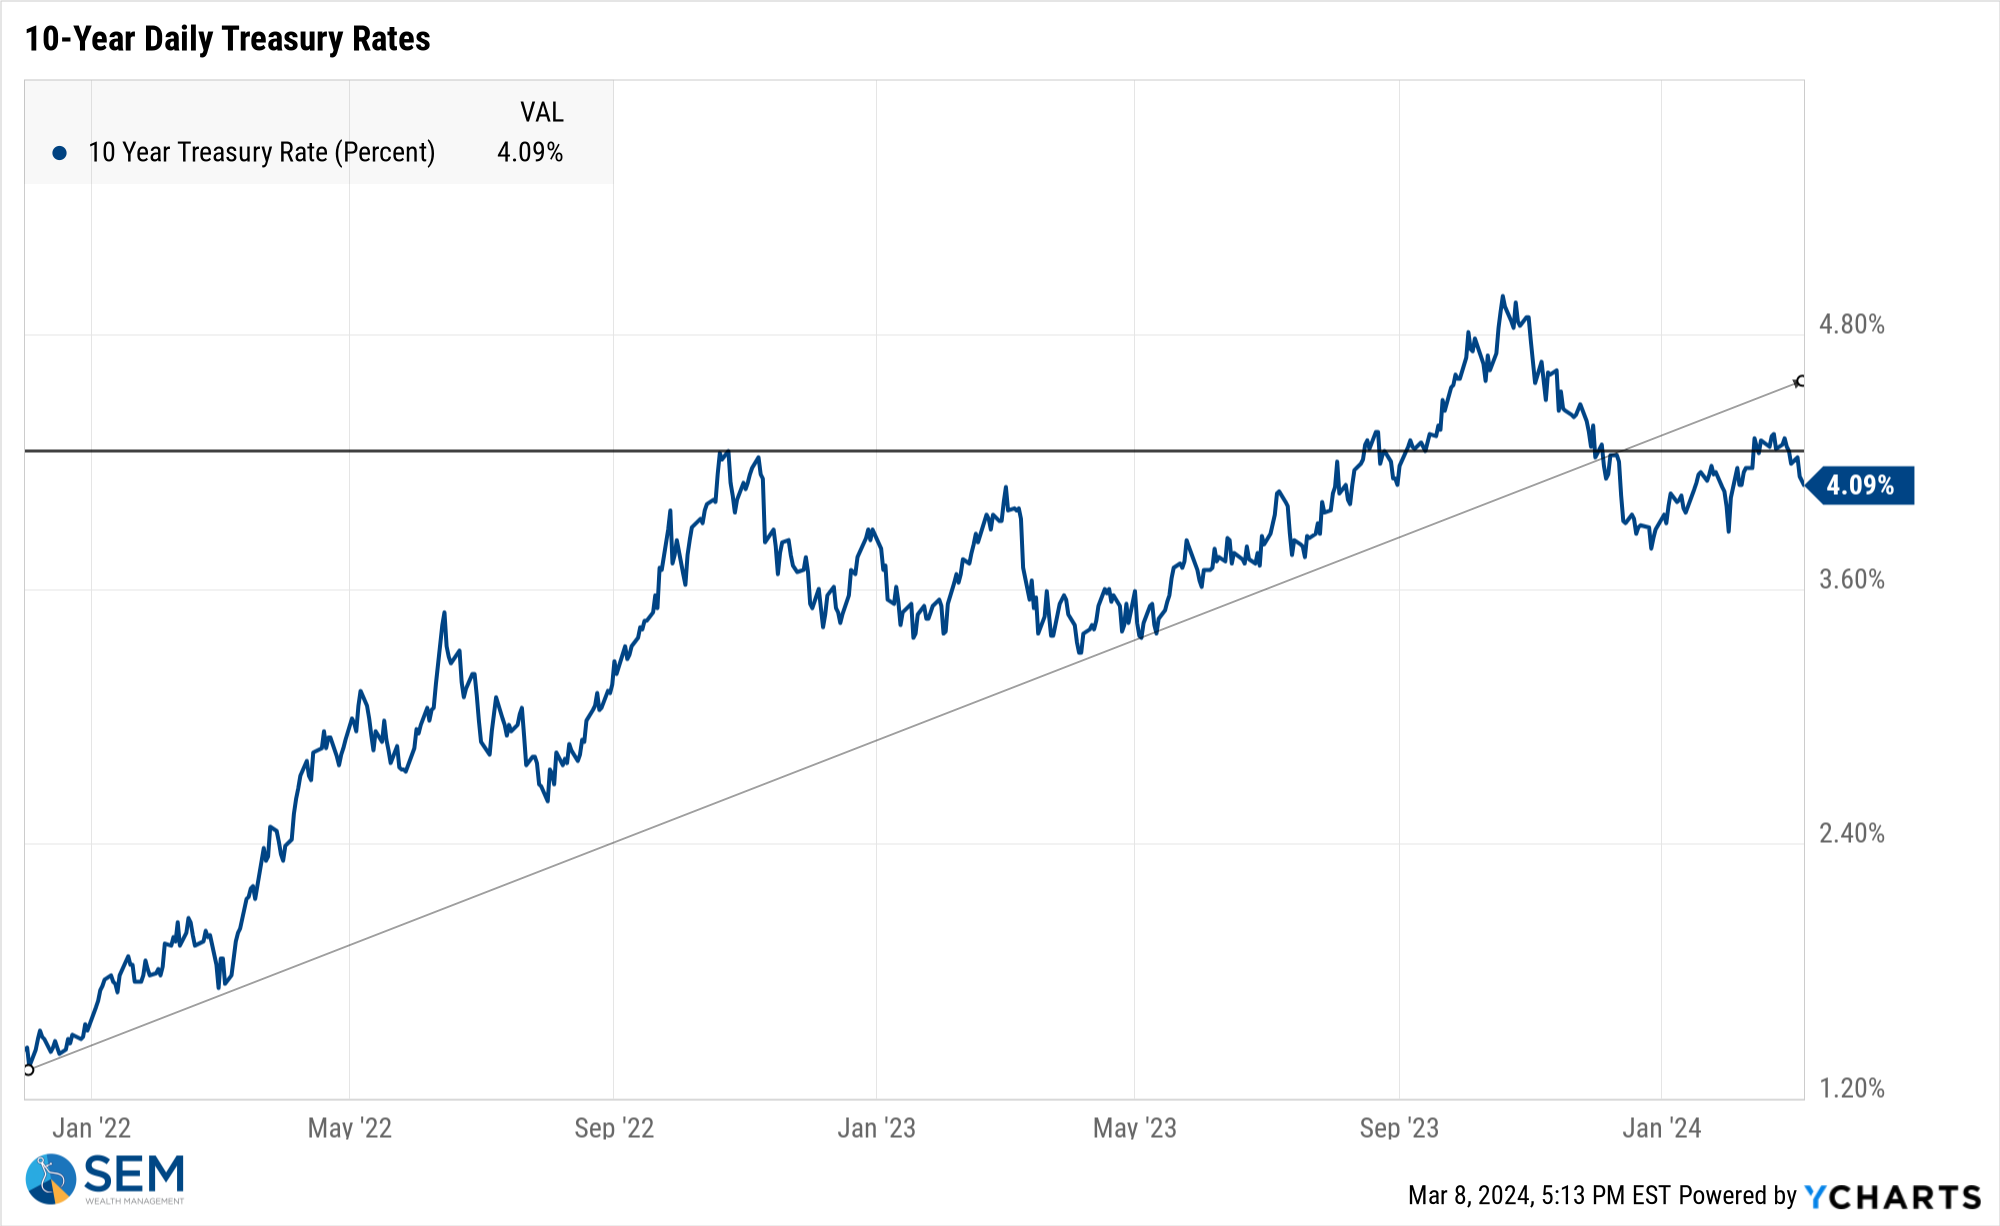
Turning to bonds, the 10-year Treasury yield had a great week. Just a week ago we were worried about the trend moving higher. Now it seems that is not a concern as the Fed Chair seemed confident rates would start coming down by June.
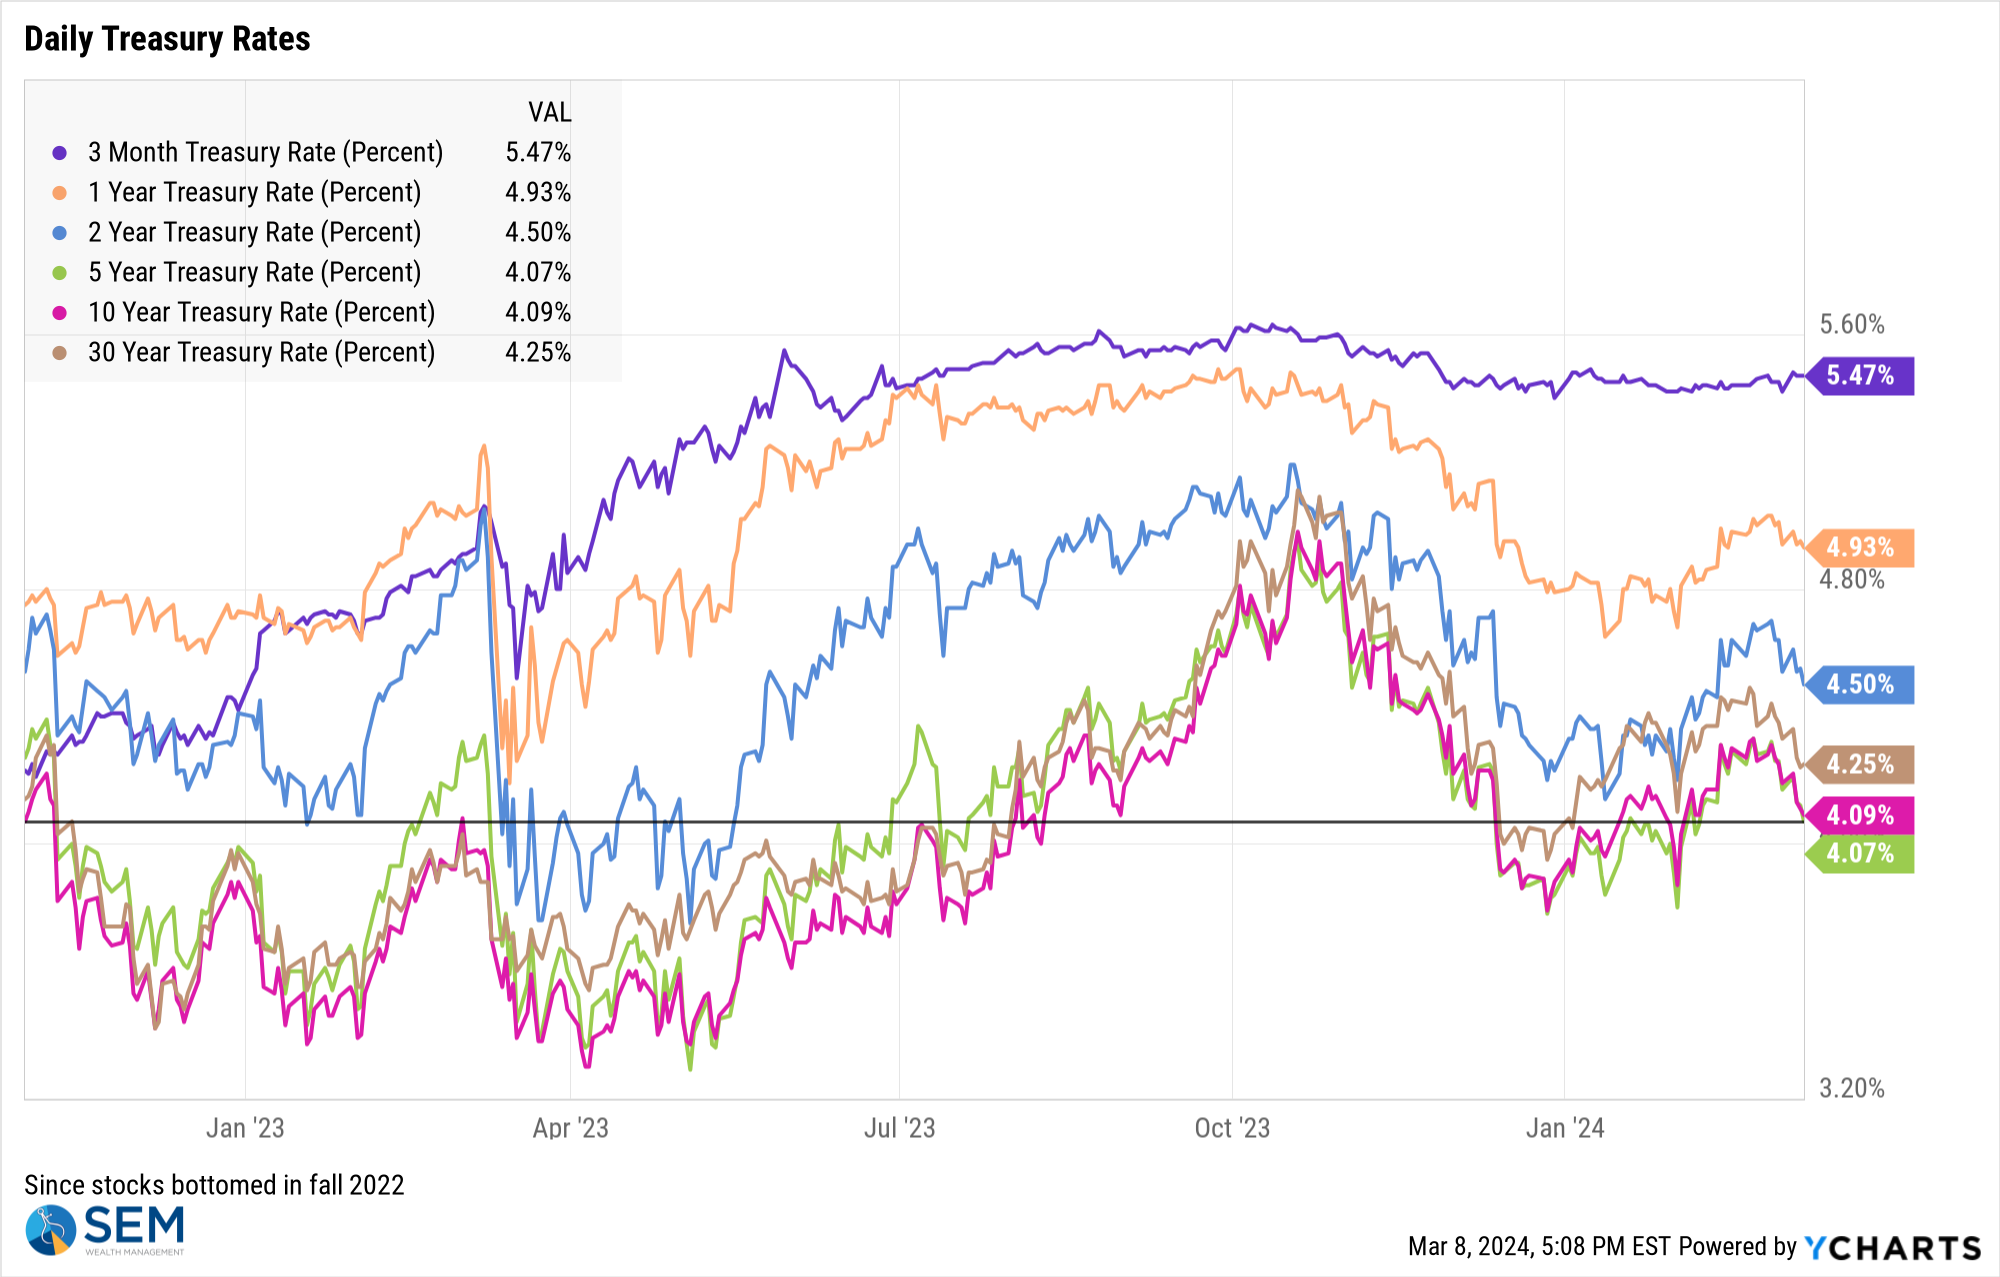
I thought this chart looking at rates across the maturity spectrum was interesting. It plots the various Treasury rates since the stock market bottomed in the fall of 2022. Long-term rates are essentially at the same point they were. All it took to ignite the current rally was the prospect of rates no longer going higher.
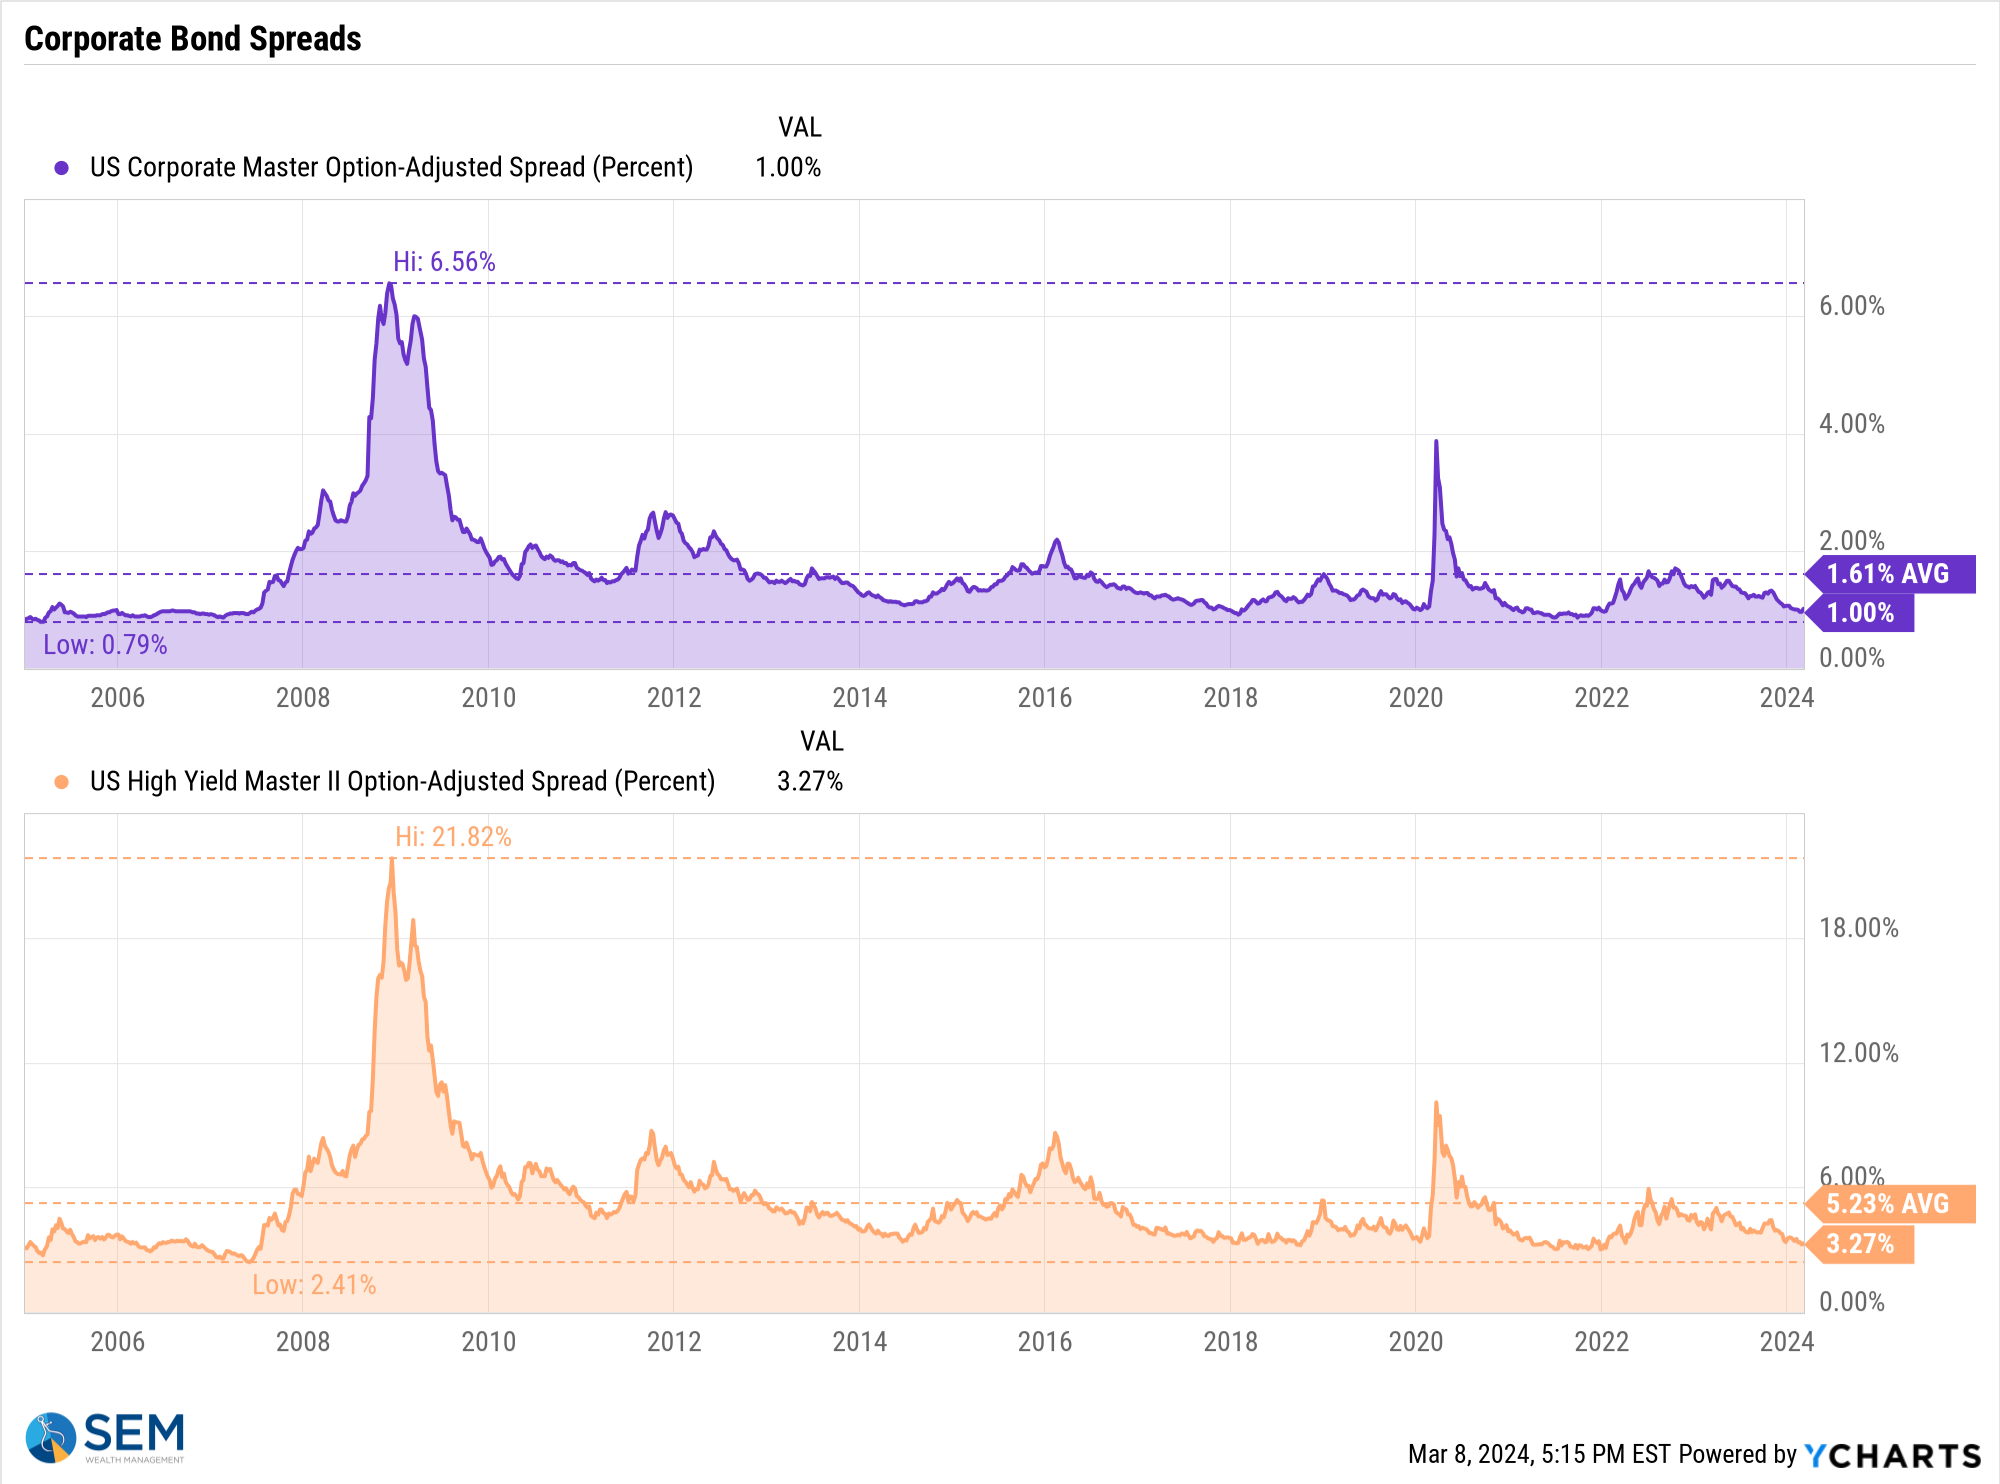
Finally, let's look again at corporate bond spreads (the difference in corporate yields to Treasury yields.) Think of this chart as sentiment. The higher the spreads, the more concern there is bonds may struggle to meet their repayment obligations. The lower the spreads, the less concern.
Unlike small cap stocks, the spreads in bonds would indicate there is nothing to fear. Of course these things move in cycles. We are approaching the lows of the pre-financial crisis 'hayday'. Are things less risky now? I guess time will tell.
SEM Model Positioning
-Tactical High Yield went on a buy 11/3/2023
-Dynamic Models went to 'neutral' 2/5/2024
-Strategic Trend Models went on a buy 11/27/2023
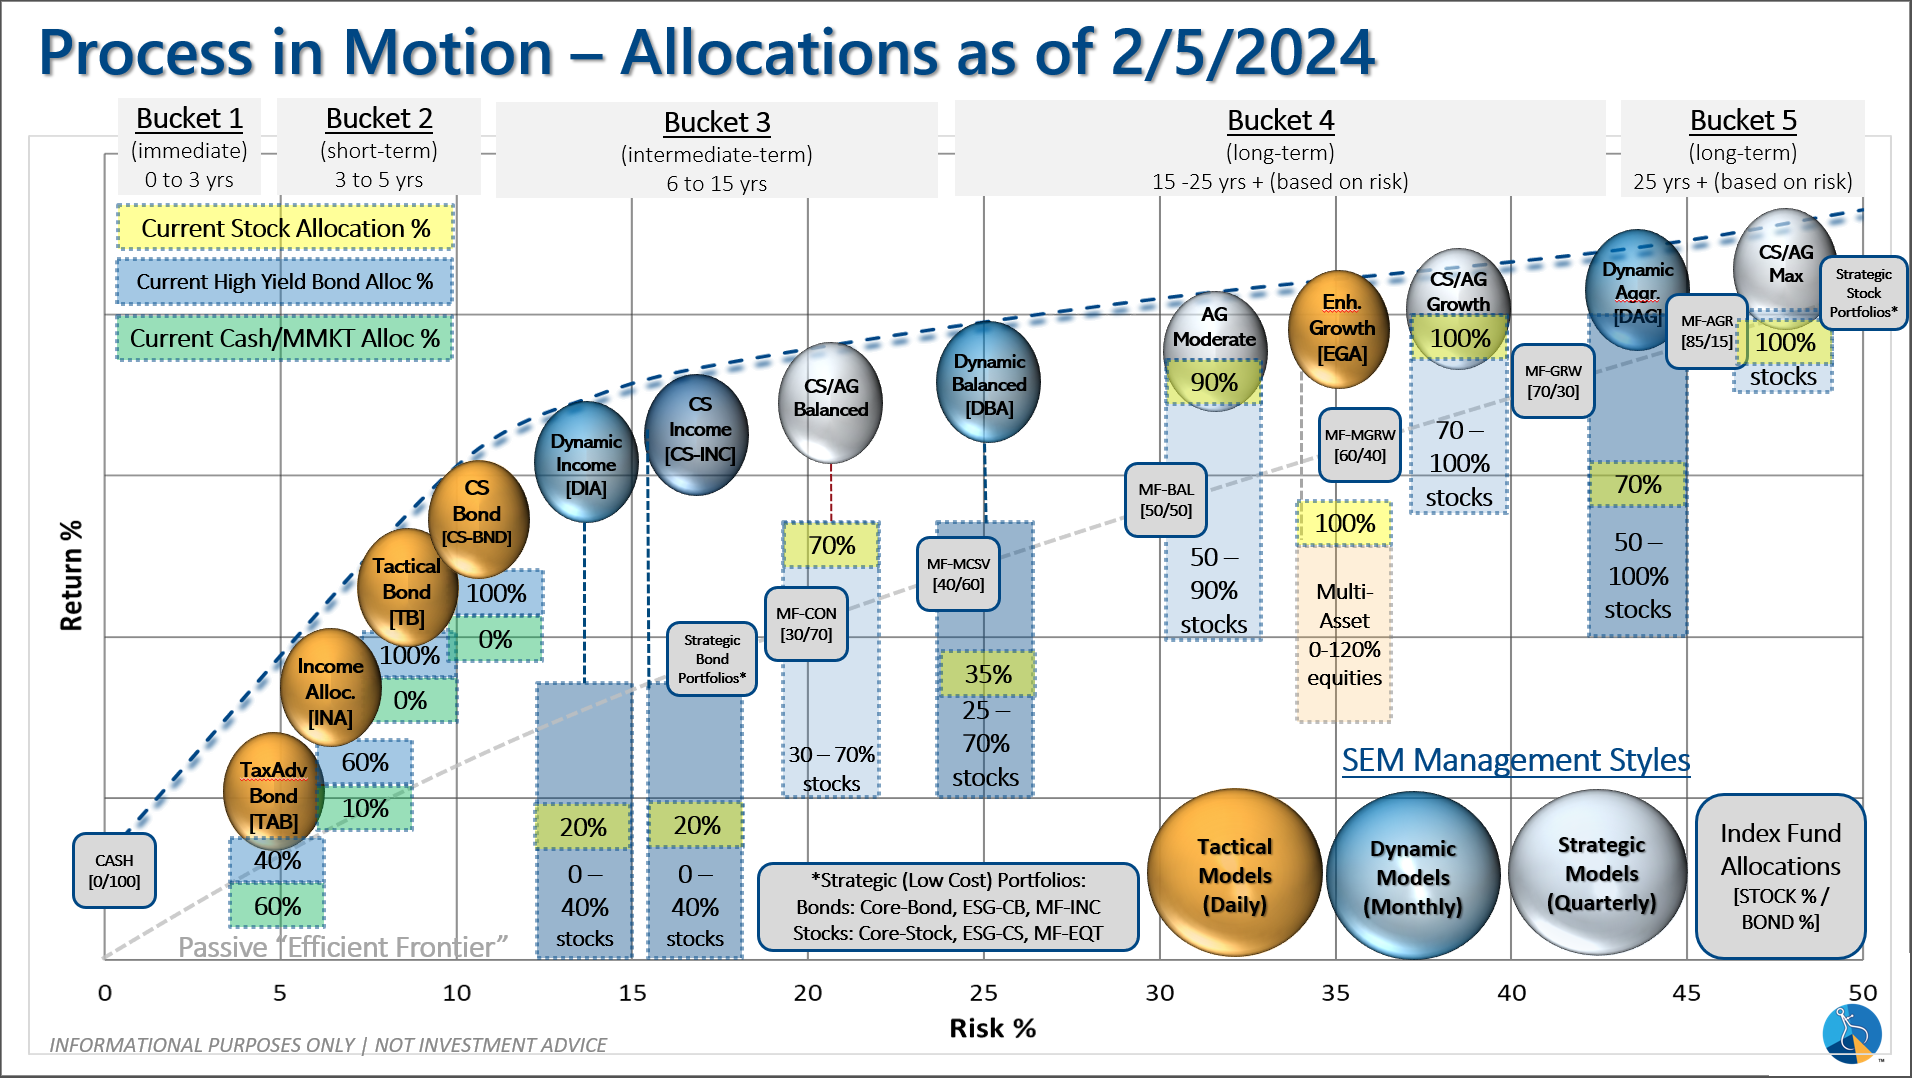
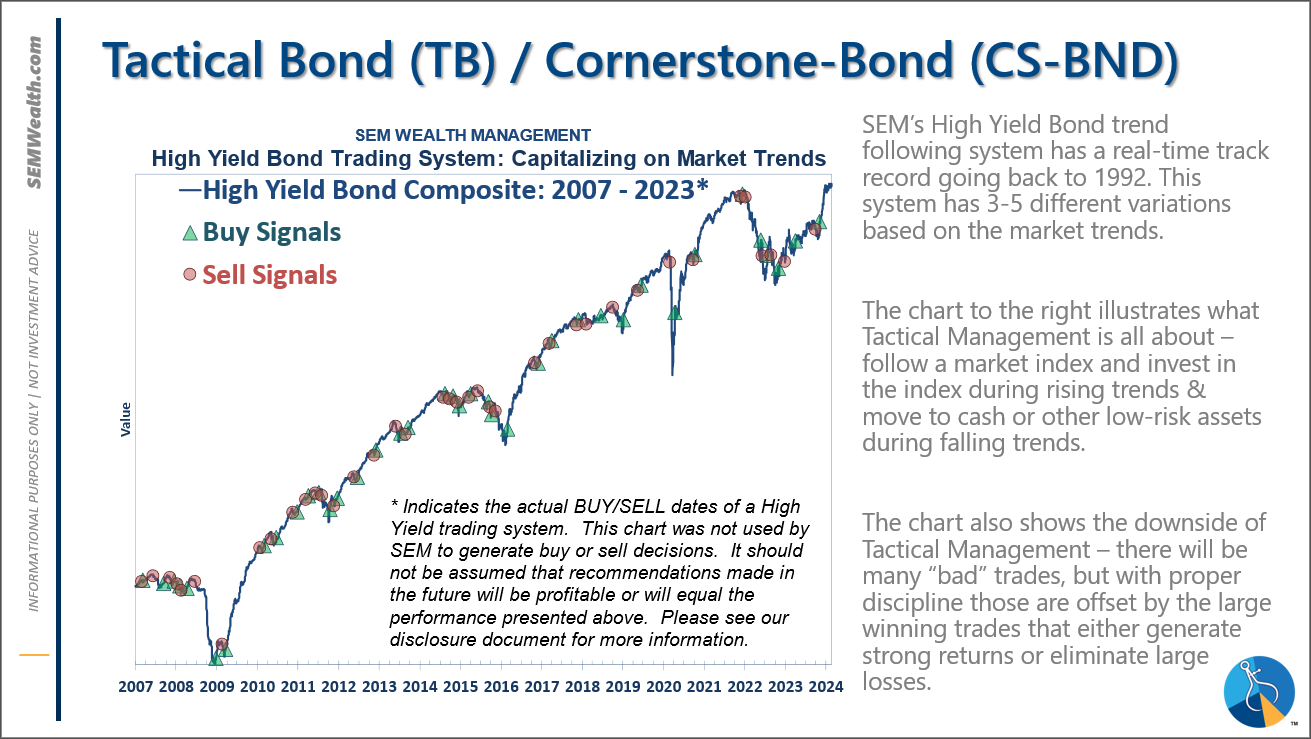
SEM deploys 3 distinct approaches – Tactical, Dynamic, and Strategic. These systems have been described as 'daily, monthly, quarterly' given how often they may make adjustments. Here is where they each stand.
Tactical (daily): The High Yield Bond system bought the beginning of April and issued all 3 sell signals 9/28/2023. All 3 systems were back on buy signals by the close on 11/3/2023. The bond funds we are invested in are a bit more 'conservative' than the overall index, but still yielding between 7.5 -8.5% annually.
Dynamic (monthly): At the beginning of December the economic model reverted back to "bearish". This was reversed at the beginning of February. This means benchmark positions – 20% dividend stocks in Dynamic Income and 20% small cap stocks in Dynamic Aggressive Growth.
Strategic (quarterly)*:
BOTH Trend Systems reversed back to a buy on 11/27/2023
The core rotation is adjusted quarterly. On August 17 it rotated out of mid-cap growth and into small cap value. It also sold some large cap value to buy some large cap blend and growth. The large cap purchases were in actively managed funds with more diversification than the S&P 500 (banking on the market broadening out beyond the top 5-10 stocks.) On January 8 it rotated completely out of small cap value and mid-cap growth to purchase another broad (more diversified) large cap blend fund along with a Dividend Growth fund.
The * in quarterly is for the trend models. These models are watched daily but they trade infrequently based on readings of where each believe we are in the cycle. The trend systems can be susceptible to "whipsaws" as we saw with the recent sell and buy signals at the end of October and November. The goal of the systems is to miss major downturns in the market. Risks are high when the market has been stampeding higher as it has for most of 2023. This means sometimes selling too soon. As we saw with the recent trade, the systems can quickly reverse if they are wrong.
Overall, this is how our various models stack up based on the last allocation change: