
Sunny Disposition
Monday, July 18
Since the Brexit Vote, nothing has really changed around the world. After a shock that sent global stock prices plummeting and investors fleeing for the exits, stocks have not only recovered those losses, but reached all-time highs. From a big picture, fundamental point of view, nothing has changed except the disposition of investors. They went from fear of a severe global recession to believing the Brexit Vote will cause global central banks to launch an even more aggressive monetary policy, most of which will have to be unprecedented. Last week we asked if this means the Coast is Clear for investors. We continued that discussion on our weekend Podcast.
Late last week we saw a terrorist attack in France, an attempted coup in Turkey, and yet another attack on police officers in our own country. I would have thought that would give investors at least some reason to pause. Instead we see another rally in the overnight futures market. Sometimes I like to go to Market Watch to see what the “average” investor is reading. The top story was, “Turkey is just one more reason US stocks are worth every penny.”
The author does have a point. The relative stability of the US does allow for a higher “premium”, but with earnings growth lackluster at best, it is hard to justify the high premium on earnings, sales, & growth. Market Watch’s other top story really brings it down to what has me concerned about the longer-term for investors and something I’ve been saying all along — “The attempts to fix the global financial crisis have actually made things worse.” I watched The Big Short again over the weekend, this time with my fiscally conservative, Millennial son & son-in-law. Without going on another Twitter “tweetstorm” or rampage in my blog as I do every time I read the book or watch this movie, I will echo the sentiments of the Market Watch author — while the government saved the big banks their methods provided little incentive or regulatory requirements to ensure the money filtered down to the home owners and consumers that fell victim to the easy money provided to them in the late 1990s and early 2000s.
Finally, I ended last week using the emotional request by my wife, daughters, and 9 year old twins to get a puppy was similar to the requests I’ve seen over my 18 years as an investment advisor. Too often we tend to let the emotions of “wanting” get in the way of logic. In order to prove I do have a heart (both as an investment advisor and as a dad/husband), I treated my family as I would a client. I didn’t want to hear all the feelings behind their request, I wanted them to consider the consequences and sacrifices it would take. After doing this and getting verbal agreements from all three girls and the twins on the training, care, and up-keep of a new dog as well as getting them to understand a new dog would not only mean far fewer nights out and freedom to come and go as we please, but also the cancellation of a fall trip we’d been saving for, I would like you to meet the newest addition to the Hybiak Family……Mya Dee


Tuesday, July 19
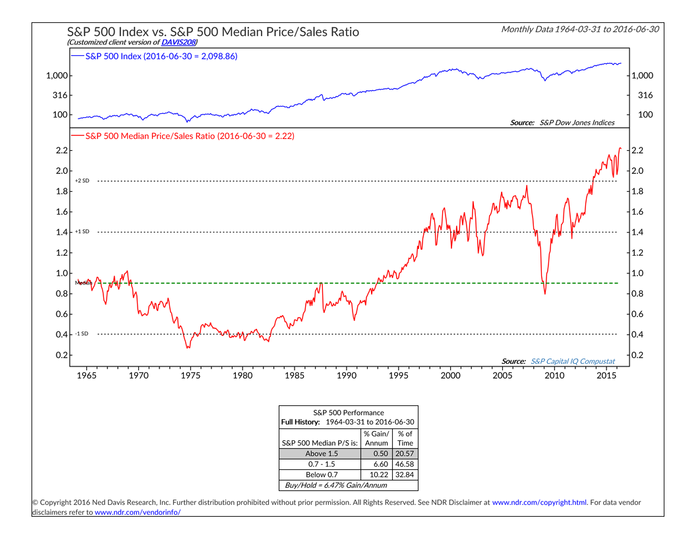
Stock market participants continue to place a positive spin on everything going on in the world. Some may call it ‘animal spirits’. Stocks are up nearly 6% for the year despite the fact the trailing 12 months’ earnings per share have decreased by 2.5%. This has led to a sharp increase in the P/E ratio in 2016.
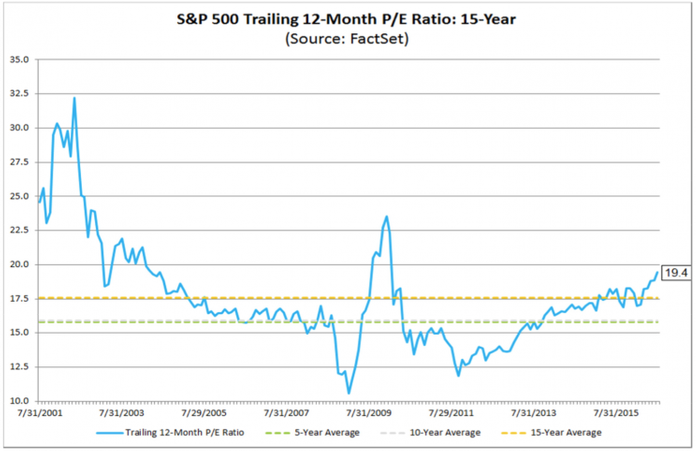
While the P/E ratio is not a good predictor of short-term returns, the current valuation level is a solid predictor of long-term returns. One thing that few people realize is the fact there are two (or three) different sets of earnings analysts use in their evaluation of the market. The chart above shows the “operating” or “pro-forma” earnings, which do not conform with Generally Accepted Accounting Principals (GAAP). Firms remove things like pension charges, restructurings, merger costs, discontinued operations, asset write-downs, etc to give what is in their opinion a better gauge of future profits (even though those are all REAL expenses paid by the company that should be used to evaluate the effectiveness and success of both management and the company.) If you use GAAP earnings, you know the ones that were designed to give investors a “fair and consistent” way to compare earnings of all corporations, the P/E ratio jumps all the way to 26.
Sorry, I lived through the tech bubble when companies had to resort to “pro-forma” earnings and other measures to justify why their stock was a good investment. When I see companies doing this exact same thing and Wall Street (again) falling for it I have to call bu!!$h!+. A P/E of 26 at the same time companies and analysts alike are throwing out GAAP earnings is another sign we are in the midst of a bubble in stock prices.
It’s not just stock prices that are in a bubble. Thanks to the Fed, ECB, BoE, & BOJ’s 8 years of stimulus, savers have been punished and forced to look for yield in much riskier investments. This has caused high yield bonds to see a huge influx of money. July is on pace to be the largest single month of inflows into the Junk Bond ETFs in the last 5 years.
Finally, we need to be careful reading too much into this rally. There is a strong possibility the large upswing was simply the result of market participants gaining market exposure via the options market. This week is options expiration and there is an eerie similarity between the action in the market leading up to this expiration and the one a year ago, when stocks hit their highest weekly close in over a year.
Bubble or not, we are invested quite heavily across the board with an eye on the exits. As George Soros famously said, the markets can remain irrational longer than you can remain solvent. We don’t bet against bubbles, we participate as much as possible and then seek to side step as much of the downside as we can in order to take advantage of the much better opportunities when the aftermath of the bursting bubble is over.
Wednesday, July 20
The S&P 500 struggled to reach yet another all-time high on Tuesday. Volume and newsflow continues to be extremely low. Earnings reports typically lead to strong moves in the market, but the focus seems to have shifted from the fundamental valuations to “what will the Fed do?” or “when will the next round of unprecedented stimulus be launched by a central bank?”
There are a lot of dichotomies in the market right now, most of which has to do with the unprecedented stimulus. As Jesse Felder pointed out last week, stocks and bonds are giving completely different signals about the state of the economy and the future for the market. Bond yields in the US and around the world have never been lower. Low yields are often a sign of looming economic issues, which should mean trouble for stocks. Instead stocks are acting as if there are not going to be any issues on the horizon for many years to come. We’ve never seen this set-up between record low bond yields and record high stock prices. Which market is right?
Many of the bulls argue the record low yields justify significantly higher stock valuations. Perma-bull Tom Lee is one of them. He’s adding another bullet point to his argument that stocks are undervalued and have a long way to rise still — institutions are bearish on the market and have been reducing their stock positions.
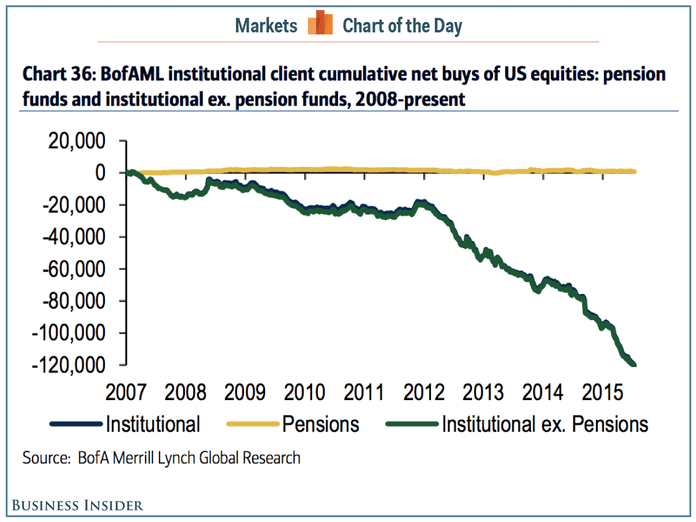
Lee’s argument is this negativity is a contrarian indicator and will lead to these same institutions being forced to buy stocks to not be left behind. I guess that requires a major leap of faith in his forecast that we will not have a recession for many years to come AND institutions will throw valuation measures aside and be “forced” to buy stocks.
Lee was just on Bloomberg making his usual bullish argument this week. One thing he did not mention was the signal the Volatility Index (VIX) is giving us. This is truly a contrarian indicator. The lower the VIX falls the cheaper the premium to purchase protection against a drop in stock prices. The lower the VIX the more optimistic market participants are we will not have a correction in prices any time soon. The VIX has dropped to a level that has often been a sign a correction is looming.
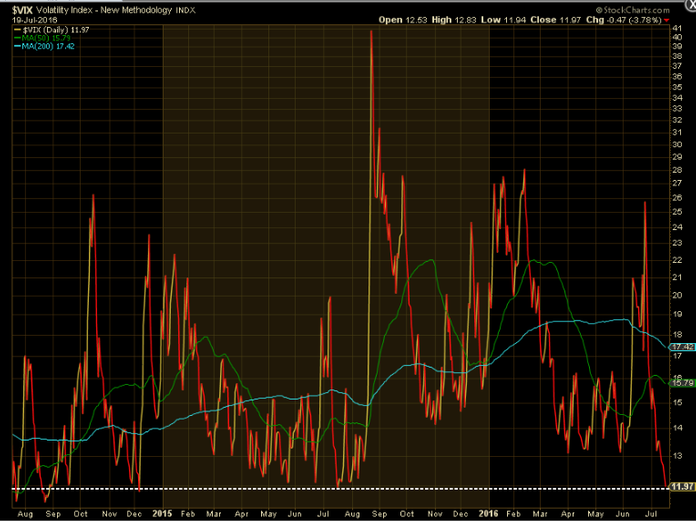
The last time it was this low was a year ago, when the market was at the highs of the year and just before a sharp sell-off in August & September.
Thursday, July 21
Stocks again closed at record highs (and again on holiday-like volume). At this point nothing seems to be phasing the bulls. The rally started as the Fed, then ECB, then Bank of Japan all began discussing unprecedented stimulus measures in their countries designed to jump start an economy that was unphased by their previous unprecedented stimulus moves. That seemed to spook those short the market and forced them to scramble to reverse their positions. Now nobody seems willing to bet against the market out of fear of what the central banks will unleash.
I’ve yet to update my earnings spreadsheets for this quarter, mainly because I know every time I do I become more and more angry at the fact companies are no longer being evaluated on GAAP earnings, but instead on whatever number management deems is appropriate. This makes truly understanding the strength of the underlying stocks extremely difficult. There are still a few numbers that are more difficult for management to manipulate — cash flow and sales. While some argue the P/E ratio (using ‘operating’ or ‘pro-forma’ or ‘adjusted’ earnings) makes stocks reasonably valued, using a Price/Cash Flow or Price/Sales ratio leads to the opposite conclusion.
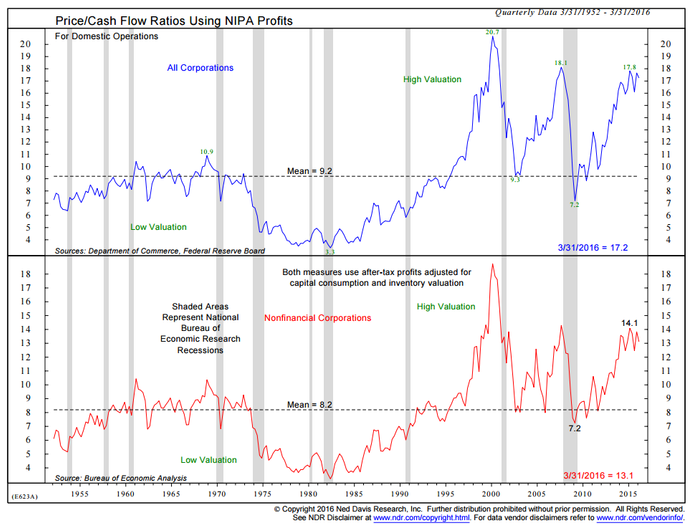
While valuation measures are not useful in predicting short-term returns in the market, they are useful in predicting long-term returns. Both measures have a much higher predictive power on 10 year returns than a basic P/E ratio.
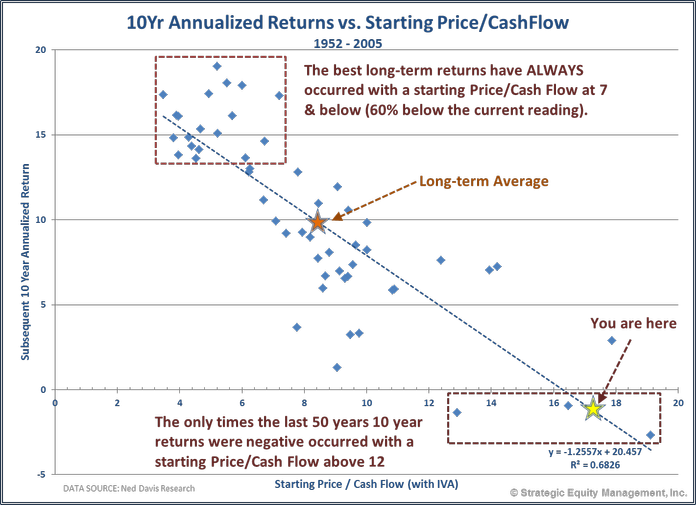
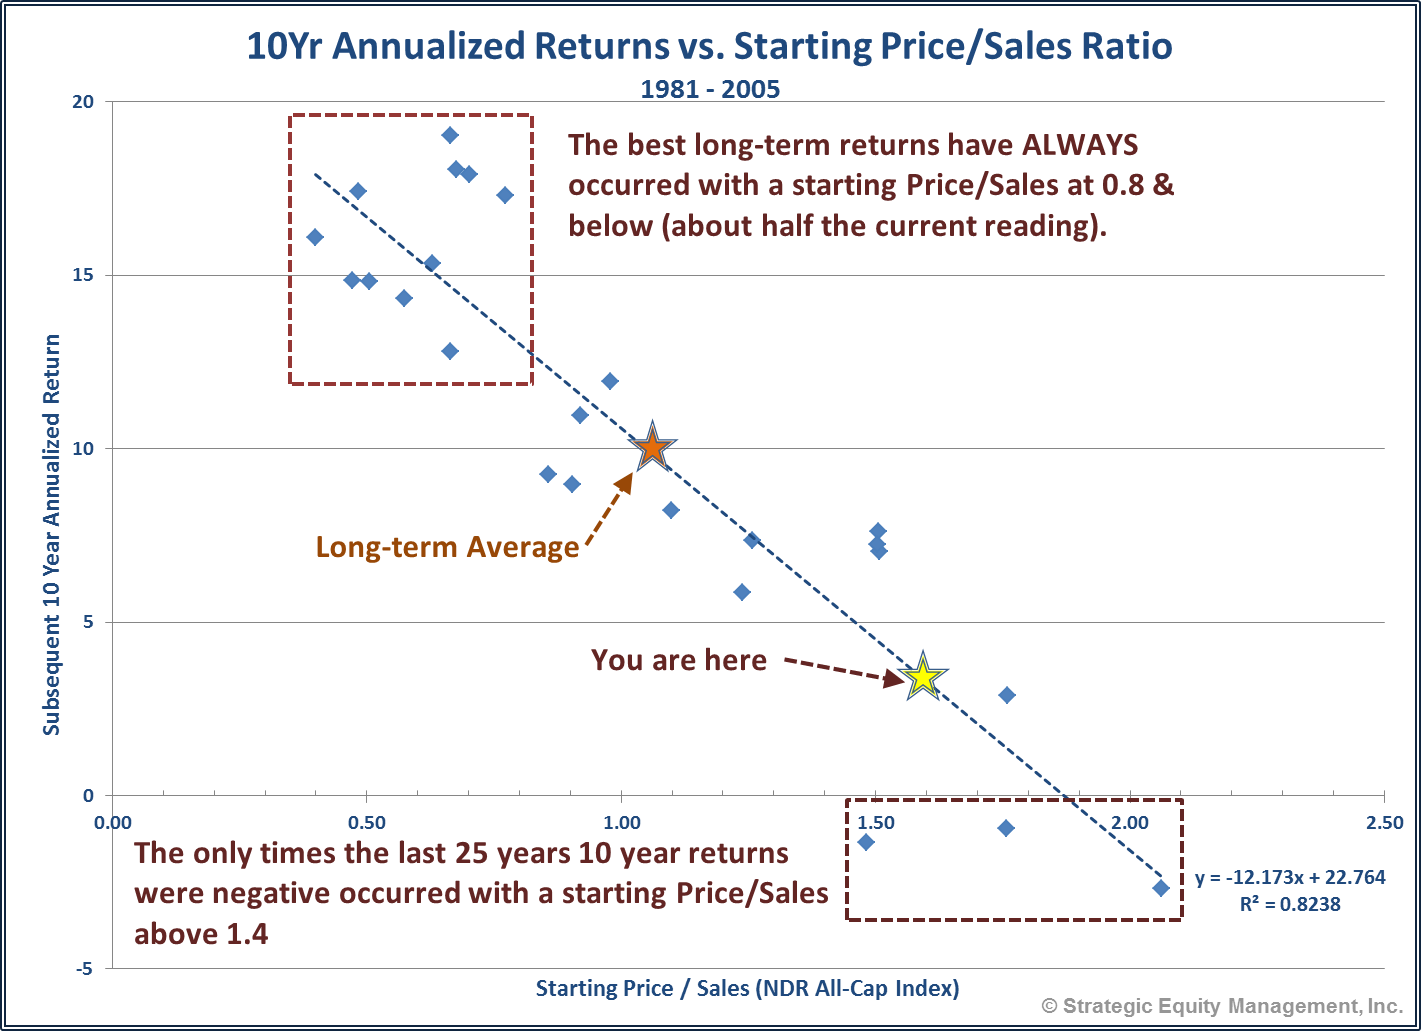
The fact of the matter is, valuation measures tell us to expect returns that are going to be far below the long-term average. The most likely reason that will be the case is when we get to extreme valuation levels the market historically goes through a severe bear market and then takes the rest of the period to recover those previous levels. I cannot be more clear — those investors jumping into a passively managed stock portfolio at this time simply because they want higher returns are taking on SEVERE RISKS that may lead to the complete destruction of their future financial plans. Our income programs (Income Allocator, Tactical Bond, and Tax Advantaged Bond) posted low returns in 2014 & 2015 as interest rate spreads contracted to minuscule levels. 2016 has been a completely different story and despite the rally in high yield and emerging market bonds, spreads remain favorable to these programs. In other words, we have a solid, lower risk alternative to those that ‘need’ higher returns. Even better, for those that have a longer term time horizon, want a lower fee, and a more consistent, but still actively managed exposure to stocks, our Dynamic Aggressive Growth (DAG) works very nicely with our income programs.
Even though it may seem the central banks will never let the markets go down again, keep in mind the Fed did everything possible to stop the 2008 financial crisis from happening —- financing buyouts, cutting interest rates, making emergency loans, guaranteeing money market accounts, and pushing Congress to pass TARP. Yet the financial markets still went down. The aftermath of this “whatever it takes” attitude is an even more unhealthy financial system as nearly every participant has been forced to take on risks they are not comfortable with. At the same time nobody seems to be asking why the central banks are still having to consider even more unprecedented measures 8 years after they first started using that strategy.

Just like the last time the central banks ran into a crisis they could not prevent, the hiMgh valuations and excessive risk taking means when something big emerges they will not have the weapons to fight it. When that happens we will be ready, but in the meanwhile we are quite heavily invested and thus participating in the upside of this insanity. Unlike most managers out there, we’ve been through this before (twice) and we have a well-tested, MECHANICAL strategy based on data rather than our subjective opinions on the market direction to help navigate what is likely to be an extremely frightening bear market.
(I realize this last section was rather heavy, which is surprising because I wrote this on our patio while playing on and off with our precious Mya. I included her picture as a little pick-me-up and distraction from the uncertain future that is ahead.)
Friday, July 22
Stocks sold off on Thursday, but it was an extremely quiet sell-off. Once again there was little news to drive markets and while volume was higher on the downside than upside, it was still quite light. One thing that comes to mind watching the market the past few weeks is an ald Wall Street saying, “Never short a dull tape.” I’ve often wondered why Wall Street doesn’t say the opposite — “Never go long a dull tape.” The lack of volume during this entire 8-9% rally is bothersome and should cause concern to anybody believing the worst is over regarding Brexit simply because prices are now higher.
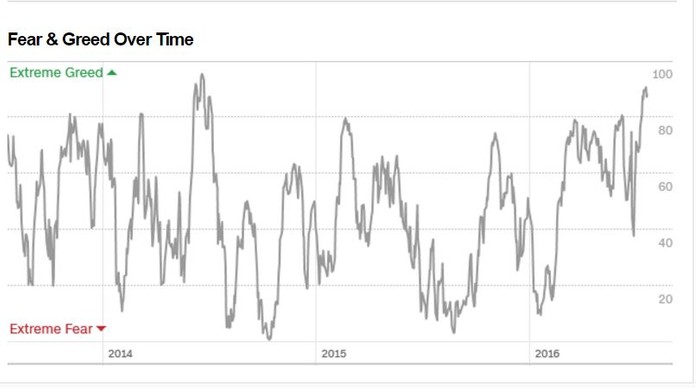
Market Watch had a surprisingly bearish article discussion reasons why somebody MIGHT want to go short the market (or reduce their equity exposure if it is at a level that does not match the overall risk tolerance.) All of them were centered around sentiment towards the market and all are considered “contrarian” indicators. These types of indicators are not typically good timing indicators, but do give a warning when it appears there simply aren’t enough buyers left on the sideline to continue boosting stocks.
We already discussed the Volatility Index (VIX) on Wednesday, which is also a fairly good contrarian indicator. Another such indicator is the CNN Fear/Greed index:
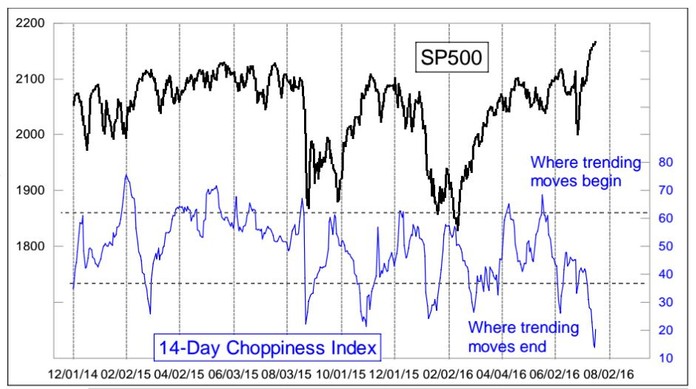
Next up is famed market technician Tom McClellan who cited his “Choppiness” Index. It essentially looks at the market volatility during a trend. The recent action is an indication the upswing is getting “tired”.
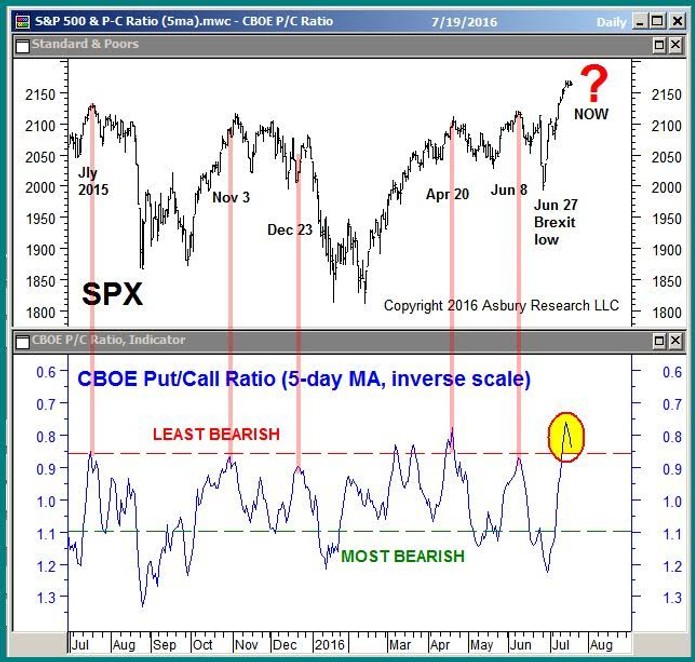
Finally, we have the Put/Call ratio which has fallen (the chart below is inverted) to levels that tend to lead to corrections. Simply put, there are more people betting on a rise in prices than a drop in prices.
Speaking of options, today is expiration day, which typically leads to higher volume. We also mentioned earlier in the week a similar big move in the market (on low volume, mostly driven by option buying) that ended up marking the weekly high for the market for the next 12 months. Conversely, I will add that our Price Divergence System is overwhelmingly bullish (as it has been for quite some time). In addition, some of our other technical indicators say there could still be more legs in this rally.
Check back next week for additional updates.


