
The US economy is growing at a “great” (but not historic) rate. This has pushed the S&P 500 all the way back towards the record high it hit in January of this year. My greatest fear is if the market surpasses the highs of January we will see a rush of conservative investors into the stock market. It happened in 2000 and 2007. Market history and human emotions tell us this is likely to happen again.
At this point, investors should be asking, what would Warren Buffett do? Warren Buffett is arguably the most successful investor in the history of the market. He has survived some of the worst times in the market for investors. From the 1970s, to the tech bubble & ultimate burst, and through the financial crisis. Mr. Buffett was vocally bullish in the last month of 2008 and again in early 2009. He has remained fairly bullish throughout although the last few years we have seen the cash holdings at his Berkshire Hathaway Corporation ticking higher. In the most recent annual report, cash holdings hit a record high and are more than double his average. This should be a warning sign for investors — either those just now wanting to jump in or those that have enjoyed the last 9+ year returns, but may be in a position where they cannot afford to give half of them back.
Looking at the “Buffett Indicator”, we can see why Mr. Buffett may have accumulated such a large cash position. For those new to this indicator, back in a 2001 Forbes interview, Mr. Buffett declared dividing the market capitalization by the economic output is, “probably the single best measurement of where valuations stand at any given moment.” I’ve run the numbers and Mr. Buffett is correct. This week’s Chart of the Week plots the Buffett Indicator. The slope of the line backs the number one cliche in investing — “buy low, sell high.” The axis on the bottom represents the Buffett Indicator. The axis on the left is the subsequent 10 year annualized returns. The “fit” of this line is 86%. By far the highest I’ve seen in all the valuations/market prediction indicators around.
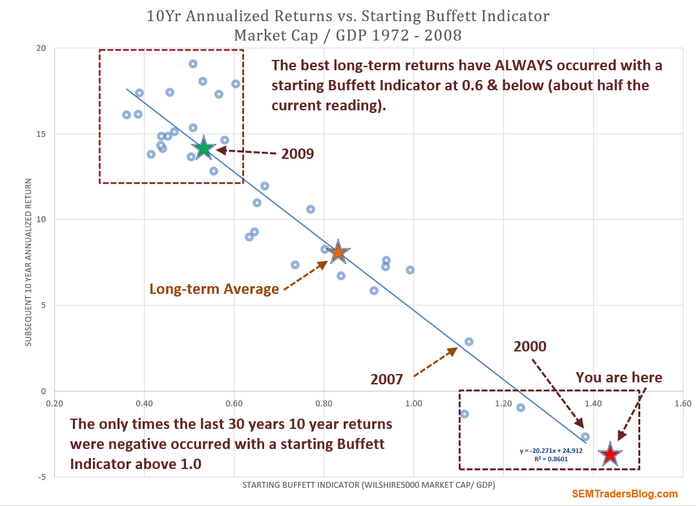
The message of this chart cannot be more clear. Back at the start of 2009 when Mr. Buffett was so vocally bullish, the Buffett Indicator was predicting 14% returns (which not by coincident we have seen). Right now the Buffett Indicator is predicting average 10 year returns of -4%! As you can see, the Buffett Indicator is now slightly worse than it was in 2000. Looking back at history, we know the market didn’t average -3% returns from 2000 – 2010. Instead it lost 50% in 2 1/2 years and then began the slow climb back up.
There is good reason Mr. Buffett has a stockpile of cash — he wants to wait for a better time to put that money to work. SEM has a similar goal, but a more mechanical way of when to move to the sidelines and when to get back in. Not everyone has the mind & “gut” of Mr. Buffett, but we can still apply his principles when we invest.
If you are a conservative investor I cannot be more clear — now is not the time to jump into the market. Please be patient and wait for a more favorable time.
If you are a buy & hold investor that is now 10 years closer to retirement than the start of the last bear market I cannot be more clear — now is not the time to ignore the risk you have in your portfolio. If you are unsure of how much risk you have (or whether you can afford that risk), drop me a line and I can do a free portfolio review.
Unfortunately, my experience and study of market history & behavioral biases tells me more people are asking what would Jimmy Buffett do rather than what would Warren Buffett do (or is doing at this time). Our systems are saying the danger is not imminent, but it is on the horizon, so now is the time to act. In the meantime, enjoy your weekend………….it’s 5 o’clock somewhere.


