
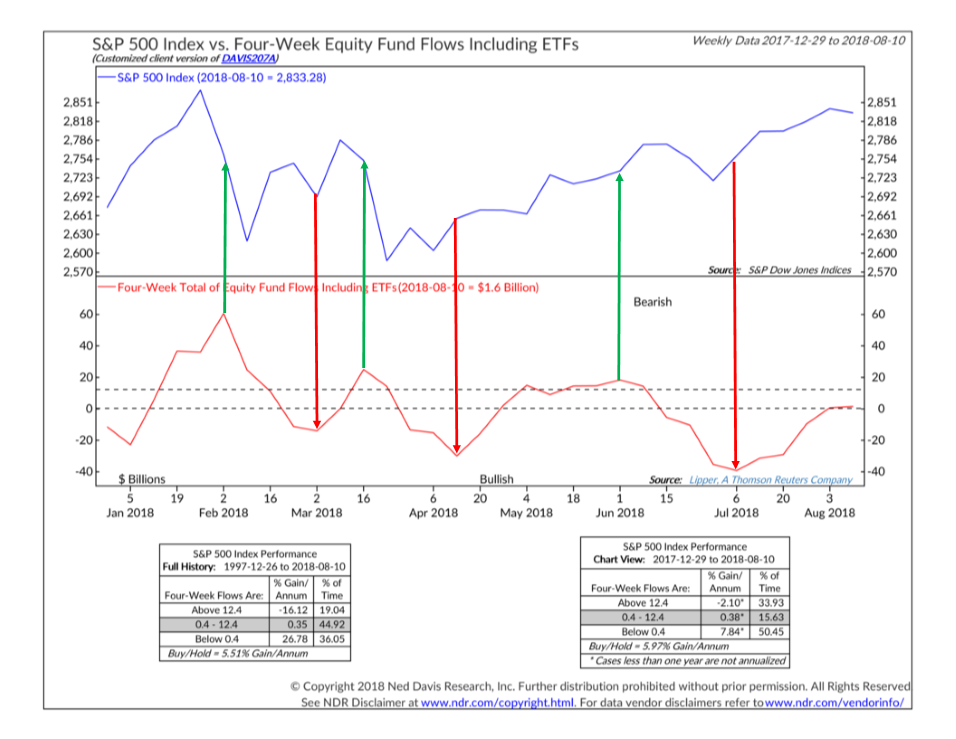
Buy after the market goes up. Sell after the market goes down. While that is not the ideal strategy, this is exactly what individual investors have done for as long as the data has been tracked. 2018 has been no different. As the stock market rallied over 7% in January, investors flooded into the market…….just in time for a 10%, 8 day decline. The pattern has repeated a few more times this year as this week’s Chart of the Week illustrates (green marks the peak in buying, red is the trough in selling).
Zooming out you can see why the January surge in buying sent shivers down my empathetic spine. It was quite similar to the surge I witnessed in early 2000 (see the dashed lines in Bonus Chart of the Week #1). We did see inflows into stocks stronger than 2000 as unlimited QE was in effect during 2013-2014, but it wasn’t the stampede we saw in early 2000 and early 2018.
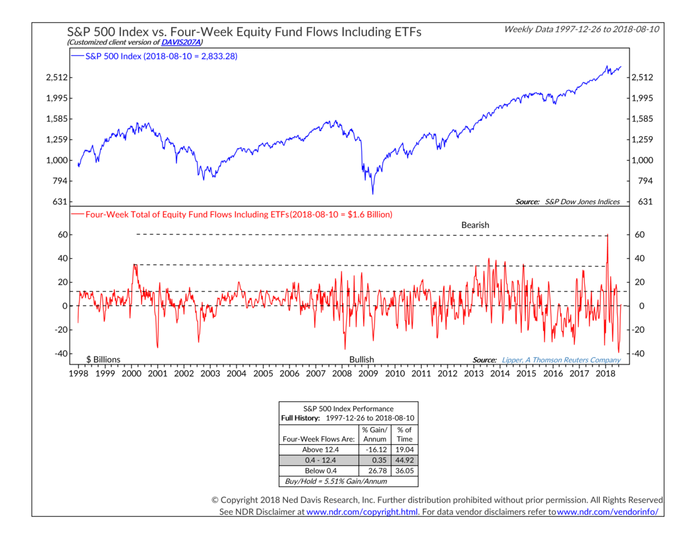
The other thing that is interesting is the volatility of fund flows this year in particular, but also the last several years. We’ve seen such a strong marketing push into “robo” advisors and passive, buy & hold portfolios this type of action should not be happening.
Another interesting thing is shown in Bonus Chart of the Week #3……the percentage of household assets “invested” in stocks. I put invested in quotes because the fund flow data clearly indicates individuals are not investing in stocks, but chasing returns.
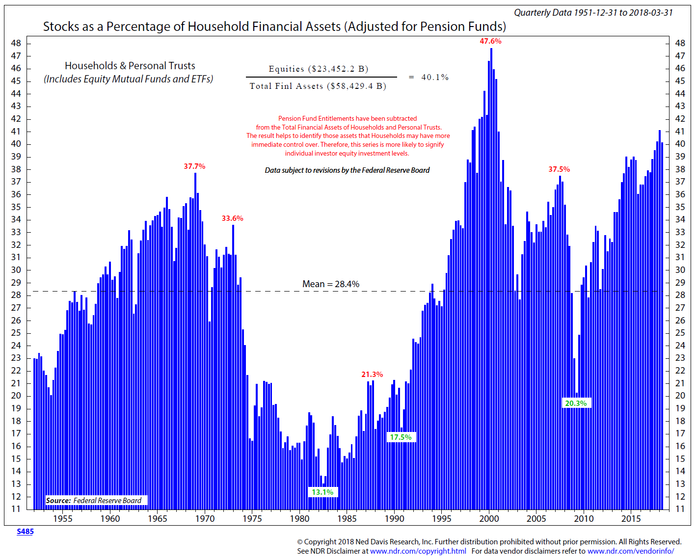
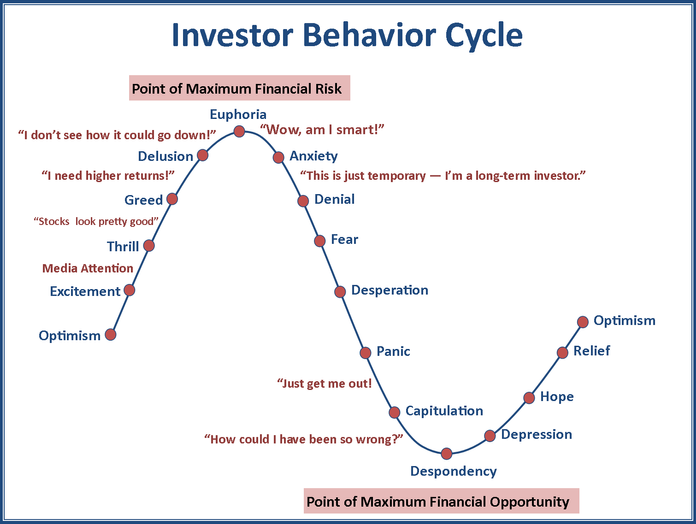
Note the peak in household assets in 2000 & 2007 and the trough in 2004 and 2010. As humans, we just can’t help ourselves. Our emotions will get the best of us. Bonus Chart of the Week #4 shows the psychological pattern that repeats every single market cycle. Despite better education and vastly improved access to data and research, the last few years have shown this cycle is in full effect once again.
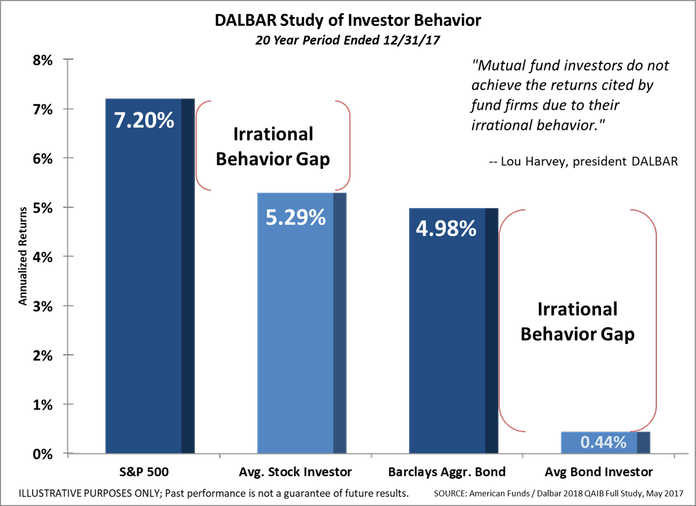
The impact of this buying high and selling low is shown in the Dalbar Study (Bonus Chart of the Week #5). For more on the Dalbar Study, see “The Cost of Behavioral Biases“.
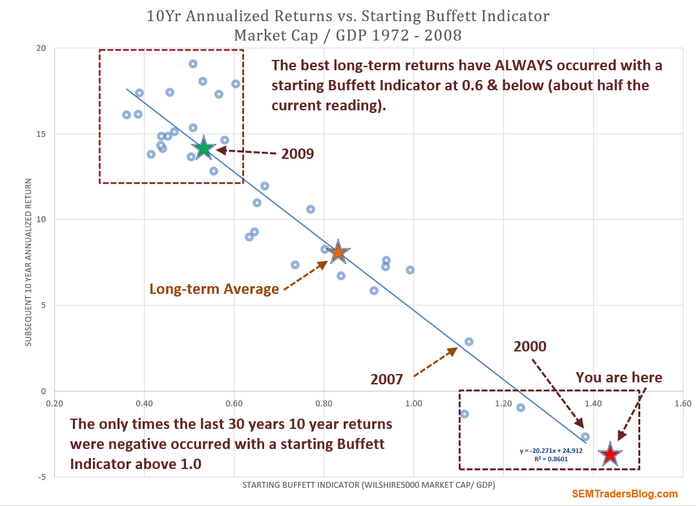
Probably the biggest concern is shown in Bonus Chart of the Week #6 (also last week’s Chart of the Week). All those investors who have jumped into the market near the all-time highs are facing NEGATIVE returns for the next 10 years (if they actually hold on that long).
SEM’s Behavioral Approach to Investing using Scientifically Engineered Models is designed to overcome these emotional decisions. By using data-based trading systems, we have pre-determined plans of when to buy and when to sell based on statistical probabilities and market history. Those systems will not always be right, but they do not have to be so long as they chop off a good chunk of the losses. We take the Behavioral Approach even further by customizing the investment model allocations around each client’s investor personality. It truly is a unique approach and one that will be extremely valuable when the next bear market rolls around.


