
Many clients received their June TCA statement last month and were surprised to see their accounts lower than the start of the year. After a year where most accounts were up double digits, this sudden reversal was something many were not ready for. While evaluating any investments over a 6 or 7-month period is not advisable, we can learn a lot from the performance and movement so far this year.
Conservative investors are getting hurt the most
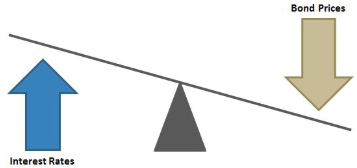
This is counter-intuitive as most of us know the more aggressive you are with your investments, the more risk you must take. The first part of 2018 the opposite has been true. With the Federal Reserve raising interest rates to fight the inflationary impact of tax cuts and other government spending programs, bond prices have been hit hard. US Treasury Bonds, often thought to be the safest of all bonds were down 5% for the year at one point and remain down over 3% for the year. US Large Cap Growth stocks were by far the primary driver of stock prices, rising over 10% through the first 7 months of the year.
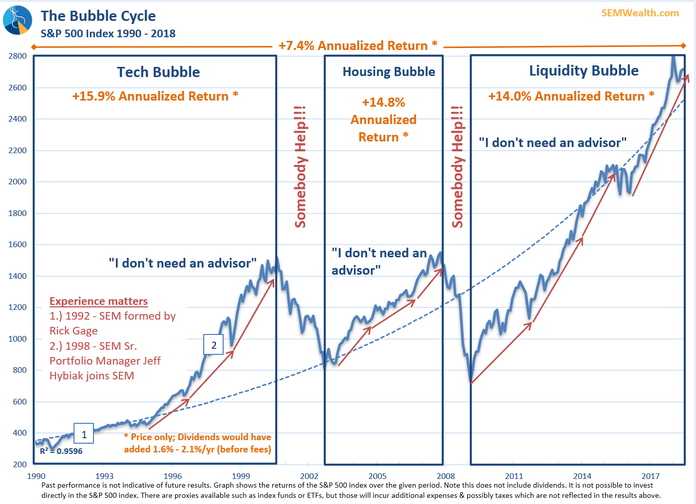
[For more on this chart see “Markets Move in Cycles“]
Conservative investors typically have far more bonds than stocks. In addition, their stock allocations usually shy away from much exposure to growth stocks, taking on a more moderate, diversified mixture. By nature, most of SEM’s clients tend to be conservative investors. First, they tend to be either already retired, or preparing for retirement. This phase is vastly different than the “accumulation” years when you are adding money monthly to your account and have decades of time on your side to overcome any losses. Second, those that saved a lot of money to retire, also tend to have a lower willingness to see their hard-earned money lost during a bear market. This does not mean conservative investors do not WANT to participate more on the upside, which makes years like this especially difficult to stick to the plan.
Your benchmark is important
For whatever reason, most investors have been conditioned to compare their returns to the “market”. The Dow or S&P 500 is the most often quoted benchmark for how the stock market is doing. I understand why. It is far easier to say, “the Dow was up 15% last year” instead of the Morningstar 60/40 Balanced Benchmark was up 11% last year.” The problem with this habit, however, is unless you are invested 100% in the stock market, the Dow or the S&P 500 should not be how you evaluate the success of your investments.

Think of it this way. If a football team is evaluating all their players and only use the speed of the average running back, every football team would be comprised of only running backs. A lineman has a completely different role than the running backs and thus should not be evaluated based on how fast he can run. The same is true with your portfolio. If you have a portfolio made up mostly of bonds, you should compare that to a benchmark that is comprised mostly of bonds. Looking at the “true benchmark” of our portfolios, our accounts were within 1-2% of their benchmark returns so far this year (both above and below). Over the long-run these portfolios have tended to out-perform their benchmark, but often over short periods of time, they may underperform by small margins.
Markets move in cycles
Since 2009, the S&P 500 has grown at a rate of 14% per year. This has conditioned many investors to believe those returns are normal. Over the long-run the market averages just 7-8% growth per year. What typically happens is a strong up move in the market is followed by a large correction. The volatility earlier this year when the stock market lost 10% in 8 days is a reminder of the risk built into a market that has gone up so much without a large correction.
Most people have heard the phrase “buy low, sell high”. The problem is, few people follow this advice. One of the most successful investors of all-time, Warren Buffett explains buying stocks in terms of hamburger prices. The admitted junk food addict, Mr. Buffett says when hamburger prices go up, his family laments the higher prices and will buy fewer hamburgers, but when they go down it is a celebration because they can buy more of them. When it comes to evaluating the value of stocks, Mr. Buffett has been quoted as saying the “single best indicator of value” is the ratio of market capitalization to GDP. In layman’s terms, if you divide the value of the stock market by the underlying economy, you can see whether “hamburgers” are expensive or cheap.
I plotted the relationship of this “Buffett” Indicator to the long-term returns on the chart below. The horizontal axis is the starting Buffett Indicator and the vertical axis is the subsequent 10-year returns. The relationship is clear – when investors have bought “low” (upper left portion of the chart), returns have been in the double digits. When investors have bought “high” (lower right portion of the chart), returns have been close to zero or negative. Note where we were at in 2009 versus where we are now. As should have been expected, investors who bought at the lows in 2009 have been rewarded with 10-year average returns of 14%. Investors buying now should expect negative returns for the next 10 years because they are buying at such a high valuation.
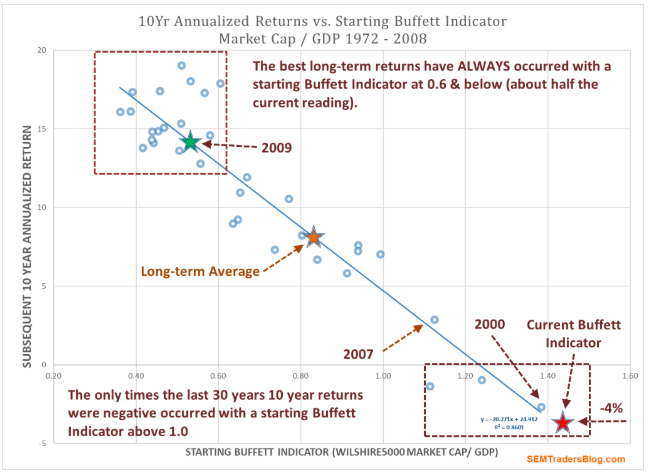
[For more on the Buffett Indicator, see “What would Buffett Do?“]
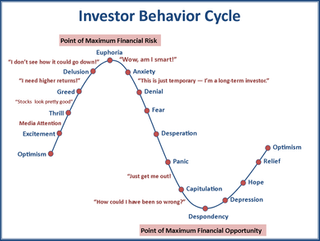
The emotional cycle
The Buffett Indicator is pointing towards annualized returns of negative 4%. This does not mean the market will go down 4% every year for a decade. Instead, based on market history, the market will lose a significant amount of money (it lost half its value in the last two bear markets) and then spend the rest of the decade clawing back some of the losses. Following 10 years of solid returns, many investors believe they could handle the big loss because “the market always comes back.” That may be true, but psychologists and our own experience the last 26 years tells us very few people will stick to an investment that loses half its value.
Investor emotions, like the market move in cycles. The more the market goes up, the more people get sucked in. As it starts heading lower, people start to become concerned. When they panic the losses start piling up rapidly and few people can get out in time. Most investors end up then capitulating near the lows before the cycle starts all over again.
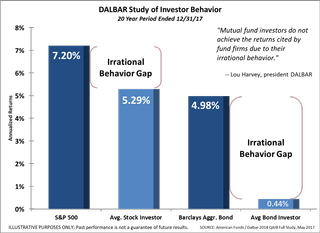
Over the years, studies have shown how damaging this cycle of emotions is on overall returns. The DALBAR study released each year documents how the average stock & bond investor fared against a buy & hold benchmark. The most recent data again shows a large gap due to investors own irrational behavior.
[For more on the DALBAR Study see, “The Cost of Behavioral Biases“]
Preparing for the next phase of the cycle is important. Only a fraction of our indicators are warning there is an immediate threat of large declines in the market. This is both good news and bad news. The good news is you still have time to re-allocate investments that are far too risky for your time horizon or loss comfort level. After 9 years of returns double the long-term average, staying much longer if not appropriate would go into the greed, delusional, or euphoric category of the Investor Behavior Cycle.
The bad news is this phase is most dangerous for conservative investors. After years of feeling like they were “missing out”, these investors are prone to jump in to the market believing the foundation in the market is solid. As the Buffett indicator shows, now is not the time to be in the market if your time horizon is 10 years or less (including your retirement date). Don’t be a DALBAR statistic.
Stick to the plan

The most important piece of your investment portfolio is your financial plan. I’ve not seen any respectable financial advisor model stock market type returns in the results of the financial plan. Most, if done correctly will assume a reasonable return based on your risk profile. This means you do not NEED to beat the market for your plan to work. In fact, if you were to get into a portfolio that has done well recently, you are very likely to become a DALBAR statistic when the inevitable losses begin to mount.
If you are feeling the urge to change direction with your strategy, the best thing you can do is contact your financial advisor and ask if your investments still fit into your financial plan.
Download / Print this article by clicking the PDF icon:

Bonus Content: Print/Download ‘Putting the Stock Market in Perspective’ Charts:
The information provided is for informational purposes only and should not be considered investment advice. Information gathered from third party sources are believed to be reliable, but whose accuracy we do not guarantee. Past performance is no guarantee of future results. Please see the individual Program Reports for more information on the risks, historical returns, and appropriate benchmark for each. There is potential for loss as well as gain in security investments of any type, including those managed by SEM. SEM’s firm brochure (ADV part 2) is available upon request and must be delivered prior to entering into an advisory agreement. Returns stated for SEM programs are based on composite performance numbers provided by TCA by E*TRADE. Composites include all accounts in a specific program for the period evaluated. Benchmark and market returns were provided by Morningstar.


