
When the estimated growth rate for the US economy was released for the 2nd quarter, President Trump touted it as evidence of “an economic turnaround of historic proportions.” One of the secrets of the President’s success throughout his life has been his ability to spin things into being “great”. Don’t get me wrong, I’m excited about the “official” economic growth rate hitting a 4% annualized rate. The last time we saw a number that high was in 2014. It actually eclipsed 5% “officially” in the 2nd quarter that year.
I’m not sure why, but few people understand how misleading this statistic is when trying to get a read on what is happening in the economy. It is essentially how much the economy grew from March to June multiplied by 4. Due to seasonal fluctuations (spring is usually the lowest activity of the year) the government uses ever-changing factors to adjust this growth rate. Nearly all other areas of economics and finance looks at the 1-year percent change to measure and evaluate growth trends. I’ll never understand how everyone from Wall Street analysts to financial reports to Congress to the President fails to understand how useless this seasonally adjusted, annualized rate of change is in measuring the health of the economy.
This week’s Chart of the Week plots the “official” GDP numbers since 2000 versus my preferred measure — the 1 year percent change. Looking at the last year removes all seasonal factors and truly shows us if the economy is growing or shrinking.
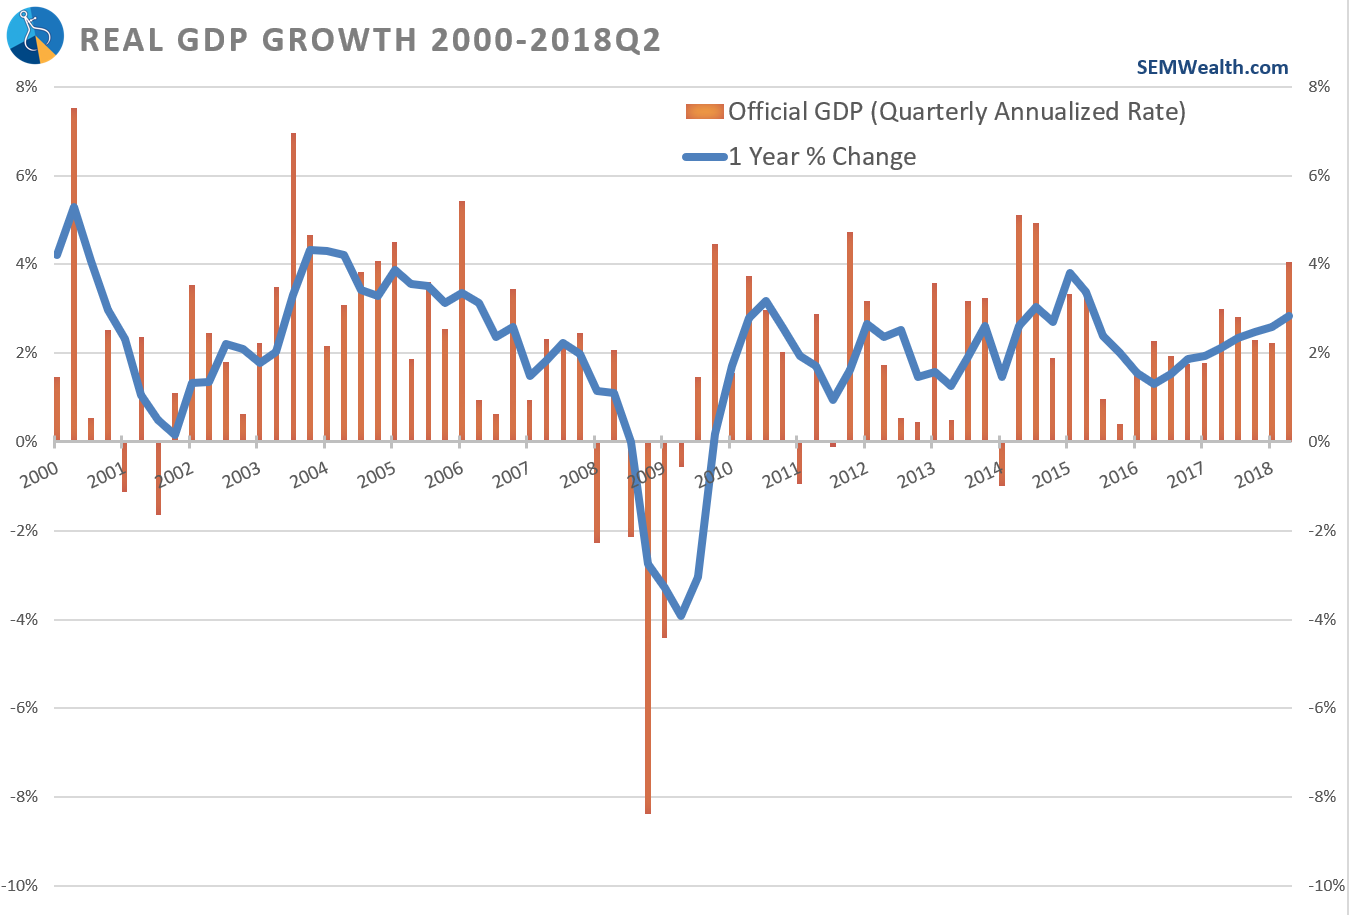
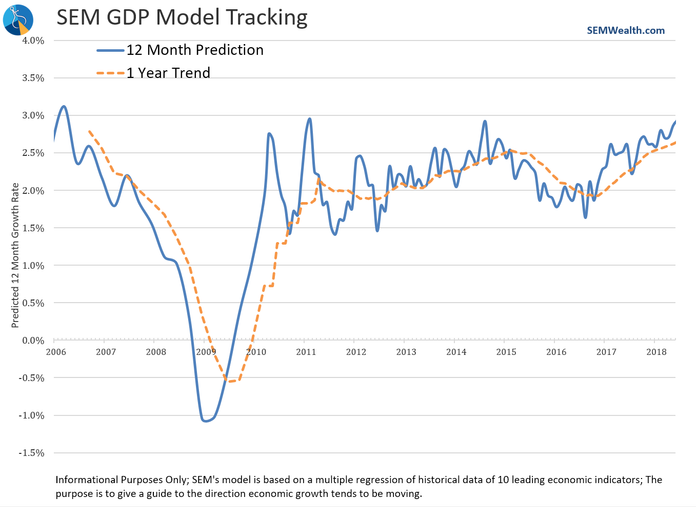
The bars are the official number and you can see the fluctuations. The 1 year % change gives a much more clear picture. Whether looking at the bars or the line, it is easy to see neither the growth last quarter, nor the “economic turnaround” is historic. The economy has been in a nice steady uptrend. The SEM Economic Model shows little signs of letting up (although the manufacturing numbers released on Wednesday were a bit disappointing). This means the economy should continue to rise over the near-term (but again, not at historic levels).
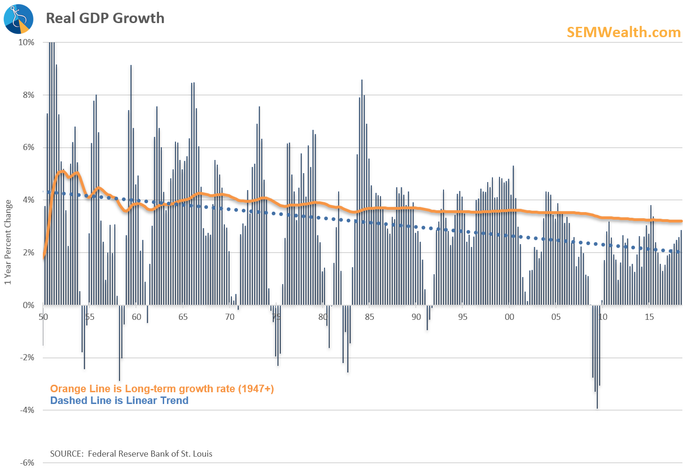
The bigger concern and something I believe the President is attempting to address is the steady downturn in the US economy over the past 30 years. The Chart below shows the inability of the economy to hit the long-term average growth rate for our economy (the orange line). We briefly went above it in 2015 and may be able to get there for a few quarters coming up (please note these are the true 1 year growth numbers, not the government’s seasonally adjusted annualized rates).
Exporting more than we import (or at least finding a little bit more ‘fair trade’) will help, but will take time. The brute force of tariffs has not historically worked, but if it brings the other side to the negotiation table, who is to argue? Whatever the outcome, the US does not have the workforce to handle making more stuff (both in terms of size and skills) because we’ve been importing foreign goods and exporting our jobs to other countries for 40 years. Jumping up manufacturing capacity in the US will take several years, which will lead to a recession in the near future. This wouldn’t necessarily be a bad thing if it meant a reversal of our long-term downtrend in economic growth.
What I haven’t even mentioned and need to start once again is the sheer amount of debt our country has accumulated both during the economic “recovery” and the last 40 years. Maybe the ‘historic’ precedent the President was talking about was the largest amount of debt ever accumulated during an economic recovery. If the trends continue, but 2020 he will have added more debt to our country than President Obama did in his first 4 years. This isn’t a political statement. Both parties have used deficit spending (which includes tax cuts) to position themselves for re-election without any regard to the long-term consequences.
Until our leaders (on both sides) wake-up and realize this, we will not see a “historic” recovery, but simply a bunch of misleading smoke and mirrors. That said, because our Scientifically Engineered Models are saying the near-term trends are strong, we remain heavily invested in all of our investment programs. The difference between SEM and most of the investment management industry is we realize this will not continue forever and the reset we need to get our country back on track will be ugly and damaging, which is why all models have the ability to move some or all of the money to the sidelines when that inevitably happens.


