
2nd Quarter GDP growth again fell below expectations. While many market participants view this as good news as it may keep the Fed from raising rates in the near future, sooner or later the lack of growth should hurt stock prices.

The Fed assumes the economy will return to normal growth.
The CBO (Congressional Budget Office) assumes the economy will return to normal growth.
Most Wall Street Analysts assume the economy will return to normal growth.
Most pension funds are modeling a return to normal growth.
What is “normal” growth? Around 3% (the average growth since 1947 is 3.2%)
Since the recession ended back in 2009, how many times has the 12 month growth rate exceeded 3%?
Twice……….in 30 quarters.

The economy has exceed the long-term trend line just once (back in 2015) during this entire recovery. This lack of growth has led to cries of “we need to spend more”. Last week we updated one of our most popular articles discussing WHY the deficit spending has not worked . (Click here to read it) Keep in mind this article was written 5 years ago. The only thing that has changed is we have even more debt that will be an overhang on future growth.
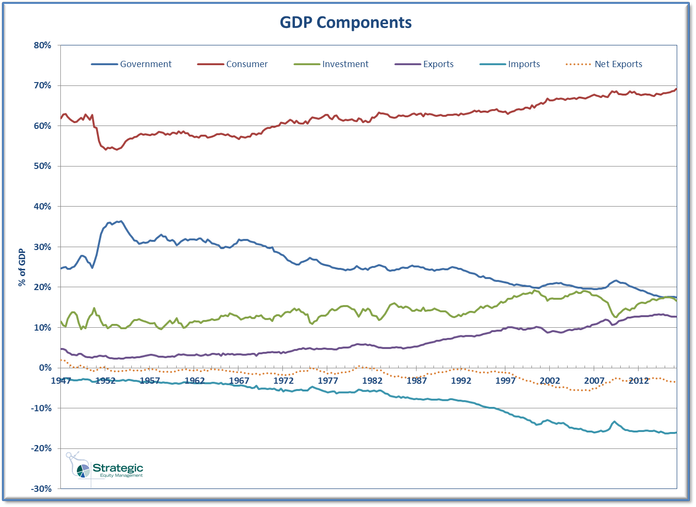
Looking at the components of GDP Growth, we can see how the growth rate has changed over time.

Over the past year, the primary culprit is a continued decline in investment. Corporations simply do not feel confident enough to invest in the future nor do they have any incentives to do so. Why should they when they can simply buy back stock and pay dividends to boost their stock prices and bonuses? These are all major STRUCTURAL issues with our economy. The fact the stock market has not yet reacted to this yet does not mean it will not be a problem going forward. (For those of you that believe the Fed will save the day, you might want to click over to read our most popular article ever — The Pending Forest Fire).
Tuesday, August 2
Stocks broke out of an 18 month, 14% trading range on July 8. Since July 14, the S&P 500 has been in a tight range between 2158 & 2178 (less than 1%). I do believe that could be the definition of a “coiled” spring — a market that could move quickly whichever way it ends up breaking…..up or down.
Market participants are wrestling with the lack of economic growth, which will continue to be a drag on corporate earnings, but offset by the fact we could see more central bank stimulus to fight it. Overall our leading indicators continue to point to an economy that should be growing around a 2.3-2.6% pace over the next 12 months, but it is a mixed bag. A continued decline in investment spending, specifically inventory investment remains a drag on GDP growth. Yesterday’s ISM Manufacturing Survey for July was a mixed bag as far as our leading indicators go.

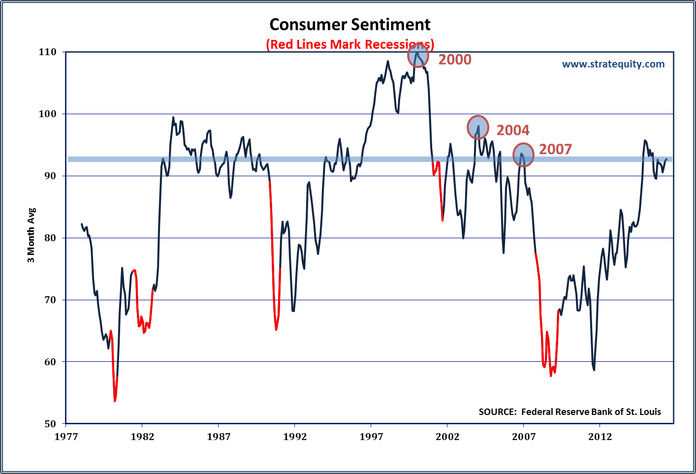
Consumers continue to be the primary driver of growth for our economy. In July sentiment declined and remains off the peak we saw in early 2015. Interesting to note is how the overall level of consumer sentiment has declined throughout the 21st Century.
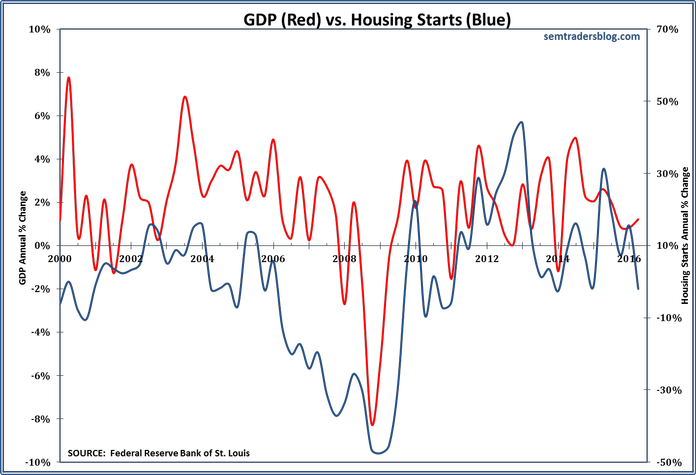
In addition housing appears to be slowing which is also not a good sign for economic growth. GDP growth actually overcame the lack of new homes (investment) in the 2nd Quarter.
Wednesday, August 3
On Tuesday stocks broke the 13 day trading range the wrong direction if you’re bullish on the market. It did manage to recover a bit off the lows, but it still caused a bit of a panic in the middle of the day.
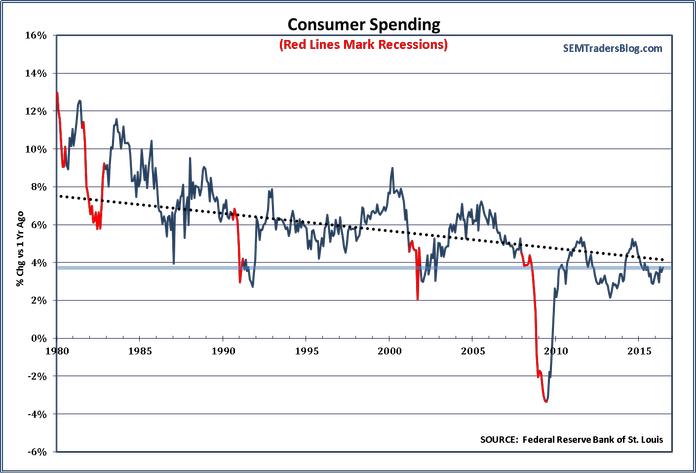
Even though the market participants do not seem to care about fundamental economic data (unless it causes them to worry about the Fed pulling back their stimulus), over the long-run economic growth is really the only thing that can drive stock market returns. Business Insider had an interesting chart yesterday showing the US Economy without consumer spending. Without the consumer, the US economy would be in a recession.
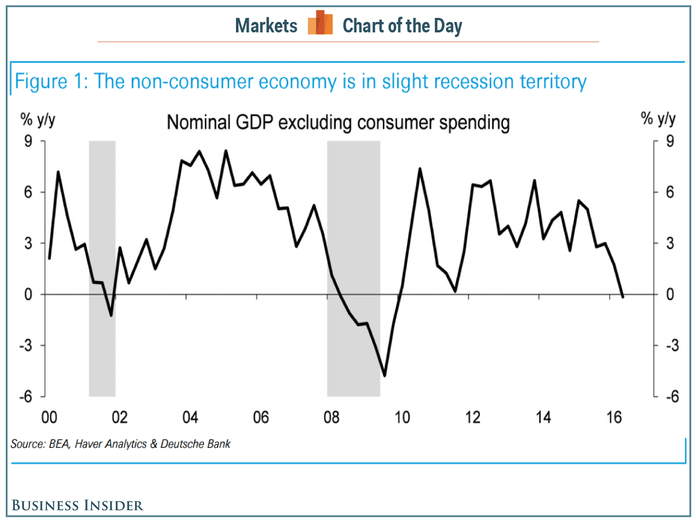
Of course, Consumer Spending is nearly 70% of GDP so we are a long way off from recession.
However, the pace of consumer spending is falling & the long-term trend growth is also declining.
At the same time we can see Real Disposable Personal Income growth is also slowing and is well off the 2014 peak.
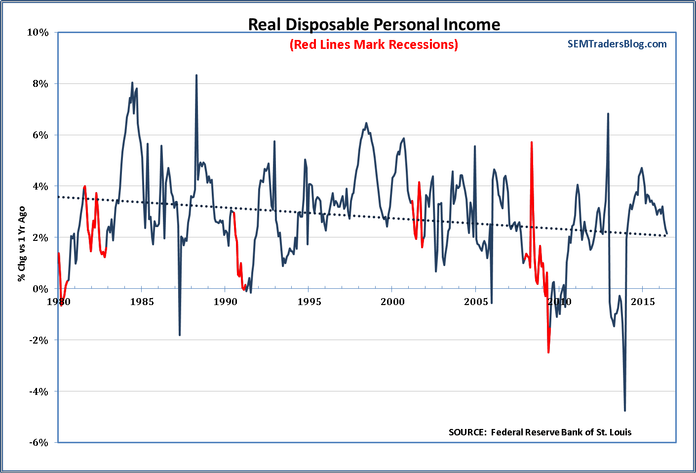
No amount of Fed QE or more interest rate cuts will help these trends. These are STRUCTURAL issues that are actually being made worse due to the Fed’s policies.
Thursday, August 4
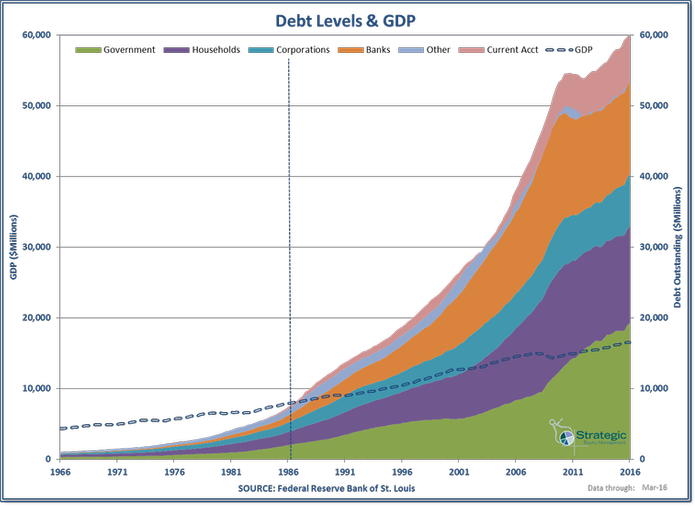
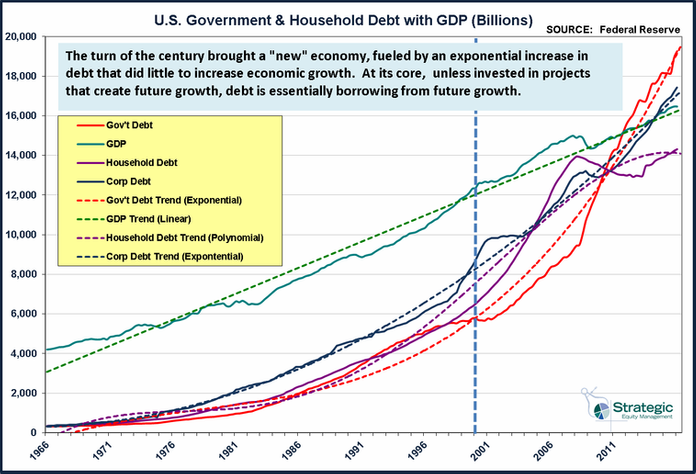
Stocks returned to their tight trading range on Wednesday in another low volume, quiet session. This leaves us time to continue our focus on longer-term growth trends. When we are talking about long-term trends we cannot ignore the level of debt our country has accumulated. Debt by itself is not a bad thing so long as it is used to fund investments that will increase future growth. Unfortunately that has not been the case. Over the past 30 years we have seen an exponential increase in debt focused more on easing short-term concerns rather than investing in long-term growth. As we’ve added to our overall debt load, we’ve seen constantly diminishing returns (meaning it takes more debt to generate the same amount of growth.) We highlighted this in The Grand Experiment.
Last week we included these charts illustrating not only the size of the debt load relative to our economy, but also the recent increases.
What most people do not realize is the fact the “official” debt levels do not include the promises made via the entitlement programs, (social security & medicare). Most people assume the money paid into social security & medicare is in a “trust”, but beginning in the late 1970s and then accelerating in the 1980s Congress decided it was unproductive to simply leave that money sitting in the trust funds while they had to borrow money to fund their other expenses, so they began using the trust fund and replacing it with IOUs. That worked great when there were 7 to 9 workers for every recipient, but now that we are down to 3 workers for every recipient, that money must be paid back.
These payments now come directly out of the budget each year. This is a perfect example of when I say debt is borrowing from future growth. You cannot get more unproductive than paying an increasing percentage of the budget to fund the living expenses of a large group of retirees. We need to be spending money on things that INCREASE productivity.

Instead, we are likely going to have to see future taxes go up for the current workers, less investment in infrastructure and other projects and cuts to many government services just to pay for social security & medicare. The projections for the independent Congressional Budget Office are not pretty for the future of our country.
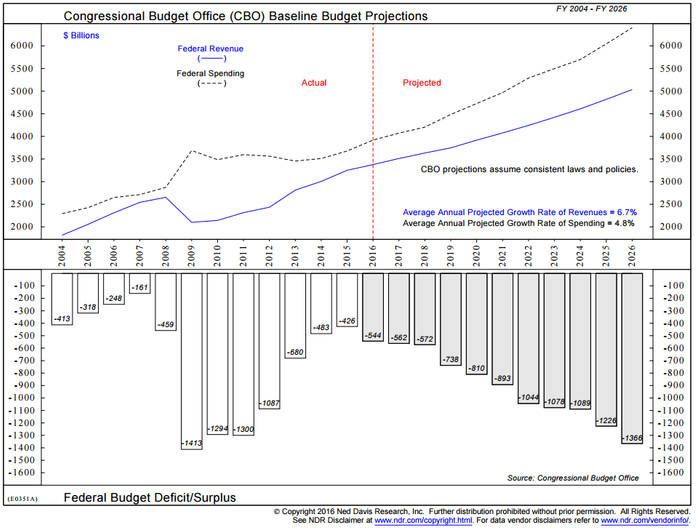
Sooner or later our country will wake up and have to address this problem. The longer it waits the worse the consequences will be.
Friday, August 5
The latest reading on the labor market is out and it was surprisingly good. Even more surprising, the market is (so far) reacting positively to this report even though this puts the prospects of a Fed rate hike back on the table. Remember, the market broke out to all-time highs after the minutes from the Fed’s June meeting were released detailing how concerned the Fed was about the labor market following a disappointing Payroll Report for May.
Looking at the monthly changes in the number of jobs, it is hard to see how the “data dependent” Fed would not be considering a rate hike.

The pace of growth, however is declining, but that has been happening for a long time.

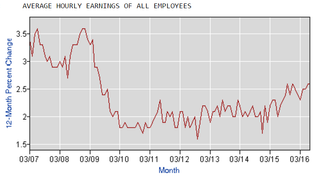
The bigger concern for market participants should be the rate of change in hourly earnings. The Fed has been ok with other metrics heating up, but they know given the amount of money sitting in reserve accounts at the Fed from the Wall Street banks, along with the record amount of money institutional investors are holding in money markets, and other short-term investments, inflation could heat up to levels that could cause all kinds of asset bubbles rather quickly.
On the other-hand, there are so many other areas of the economy that are struggling (as we’ve pointed out throughout the week), the Fed may want to allow wage inflation to heat up and attempt to deal with the consequences later. I’d hate to be the ones making those decisions although I’d love to sit in on their meetings and conference calls to see what they are thinking.
Check back next week for additional updates.


