
This week the stock market continued its impressive bull market run with the S&P 500 crossing a milestone level — a market capitalization of $20 Trillion. While most of the market participants took this as a positive sign, it reminded me of one of the most reliable predictors of long-term (10-year +) market returns — the Market Capitalization to GDP ratio. This is also known as the “Buffett Indicator” as Warren Buffett cited it as the best indicator of market attractiveness.
The concept, like most of the “Oracle of Omaha’s” investment theories, is quite simple and based on economic logic. It is mathematically impossible for the stock market to be worth more than the underlying economy for a prolonged period of time. The DATA supports this wisdom and is actually one of the stronger “fits” when it comes to regressions between valuation metrics and long-term returns (the R-squared is an impressive 82%)
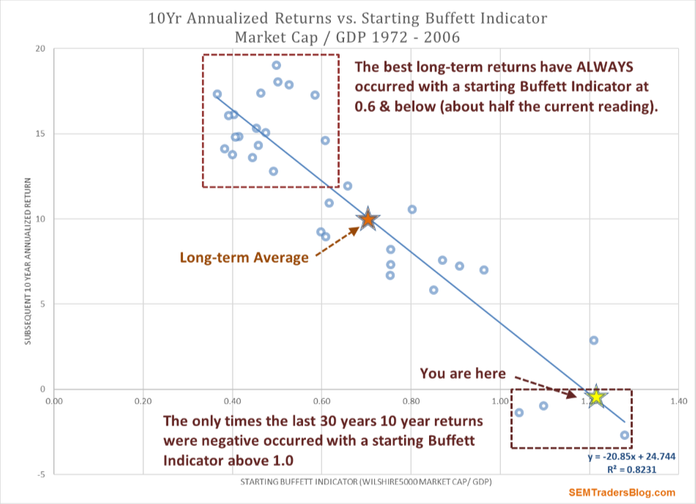
Like all valuation metrics, the simple fact the market is overvalued does not mean it will go down immediately. It does mean long-term investors should be cautious putting new money to work at these levels.
A side note – The Wilshire 5000, which represents the largest 5000 US based stocks is worth $22 Trillion and is commonly used to represent the overall US market capitalization. The fact the S&P 500, which is the largest 500 stocks is $20 Trillion of the $22 Trillion is evidence of how narrow the overall market rally has been. Again, this by itself is not a “sell” signal, but another warning of the risks in the market right now.


