
Anchoring & Availability
Last week I used the historic Super Bowl comeback by the Patriots as an example of why it is so difficult to make predictions with much confidence. I ended the week discussing the target price for the S&P 500 based on earnings estimates & the expected Price/Earnings ratio. My Chart of the Week showed the “consistency” in earnings estimates. Over the weekend as I continued to work through Thinking Fast & Slow by Daniel Kahneman I just so happened to hit the chapters that describe why most “expert” predictions end up being wrong.

Whenever our brains are forced to estimate something they start with an “anchor”. Psychologists used to believe this only occurred when our “fast” part of the brain provided an answer. Our initial assessment starts with a “normal” number and then decides if it was too high or too low. Psychologists used to believe when our “slow” (or thinking) part of the brain was called upon it would seek all the necessary data to make a wise decision. Unfortunately, numerous studies have proven that our brains are typically “primed” to start with a certain number as well. (Remember a few weeks back when I introduced Professor Kahneman’s book he described the “slow” or System 2 part of the brain as lazy — looking for the quickest way to get the job done and then moving back to relaxing.)
Going back to my Chart of the Week from last week, it is easy to see the “Anchor” analysts use when setting their expectations for the future.
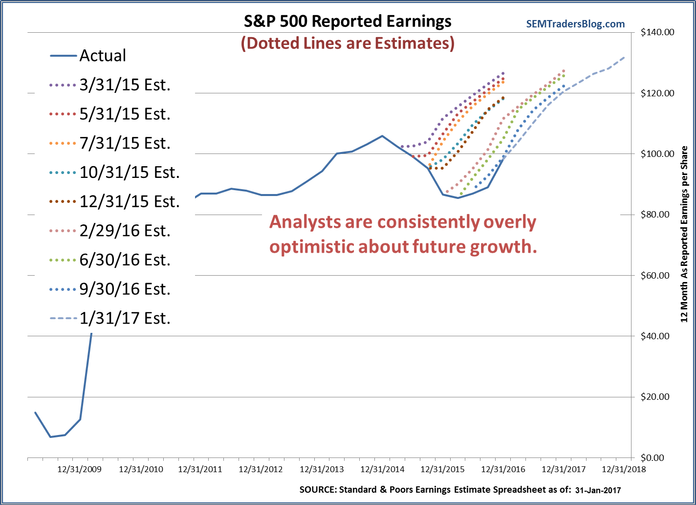
The first “anchor” is obvious — they start from the latest earnings number. From there, the growth “anchor” seems to be centered around the long-term average growth in earnings of 6%. They also seem to be primed into believing earnings can only rise as it is extremely rare to see the consensus estimates to be for a drop in earnings for even one quarter.
The most recent earnings recession from 2014 through the 2nd quarter of 2016 is an example of how these anchors can prevent the so called experts from being right. Each quarter they kept predicting a turn around. Eventually they were right. Despite being wrong for so long, everyone for some reason takes their expectations seriously.
Tuesday, February 14
The fears of “bad” Trump appear to be abating again and I’ve heard several commentators discussing the “strong” expected GDP growth due to Trump’s policies as the key driver to the recent rally. This reminded me of a chart I saw from Ned Davis Research a few days back. It compared the forecasted economic growth to the actual economic growth.
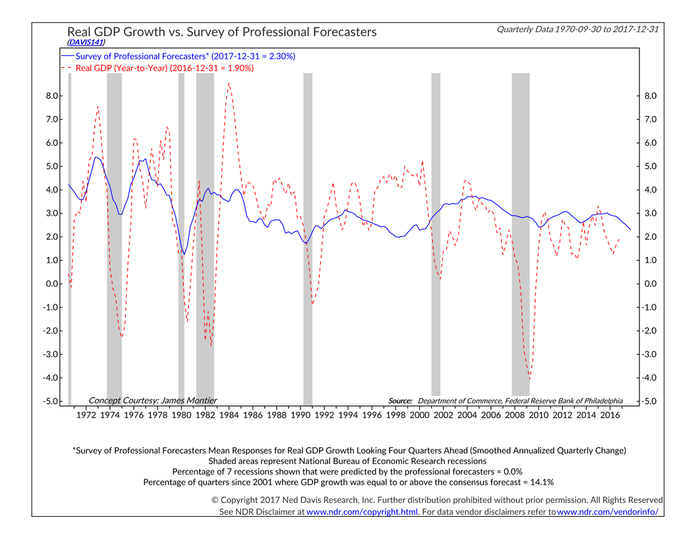
For all the technological advances it is interesting to see how poorly economists have been at providing accurate forecasts. We can see anchoring bias at its worst in these forecasts. Economists seem to be taking what they consider “normal” and then adjusting it up or down based on the more recent time frame. Since 2001 we’ve only seen economic growth exceed the forecasts 14% of the time. Even worse, economists apparently are so anchored to “normal” growth they have NEVER forecast a recession. Since 1970 there have been 7 recessions and not once has it been forecast ahead of time.
Long-time readers of this blog (and the preceding weekly and monthly email updates) know that my economic models avoid “anchoring” bias by using one simple method — I base my forecasts on the DATA, not what I think the data should say. This helped me to warn our advisors about the pending recession in early 2007 and also called the end of it in July 2009. Right now the models are saying we SHOULD see stronger growth this year than we saw last year, not because of who is President or running Congress, but simply because the indicators are showing signs of gaining strength.
Wednesday, February 15
One of the first things Rick taught me when I joined SEM back in 1998 was a term he called “recency” bias. He said most people tend to give higher weight to things that happened more recently and believe the most recent trends could continue indefinitely. Remember this was back at the time where we were in a “new era” and if a company had ‘.com’ in their name they did not need to make money or even have much revenue — the sky was the limit. The markets always come back and we heard from one unfortunate client that was leaving our management that the (Name Excluded) Tech & Telecom Fund was “guaranteed” to double in 2000. His reasoning was “Cramer said 2000 was going to be just as strong as 1999” and this fund had made 120% in 1999. This is one of many examples of how our brains can play tricks on us.
The other morning while driving to work I heard a morning sports radio show discussing “recency” bias (although they didn’t use that term or know what they were even talking about biases). The host said, “you know what’s unfortunate? Every time the Falcons have a lead next year there will not be a single person that doesn’t think ‘this lead isn’t safe — remember the Super Bowl?’ They went on to say even worse, every time a team is down 28-3 in the 2nd half they will still believe there is a chance because the Patriots were able to do it. Something just a few weeks ago that was “impossible” is now suddenly possible all the time. The odds of a team coming back from such a deficit are still so small that it is close to “impossible”, yet because it happened and we remember it our brains assign the wrong probability.
The technical term for “recency” bias is “availability bias”. Whether it was the Tech & Telecom fund or the Super Bowl our brains tend to grab the most memorable events and then believe that is “normal”. The way our brains function they remember two things the easiest — things that have happened recently, or things that were especially traumatic, exciting, or surprising. As our brains grab this available information they do a poor job understanding how to process it. In our minds, those things it recalls are “normal”. The things they cannot recall or imagine are not “normal” and therefore “impossible”.
Looking at the market valuation, it is easy to see availability bias (along with anchoring) playing a role in the risk assessments of most investors. I often hear, “yes the market might be overvalued, but that has not mattered for the past 3 years (availability bias). Besides, it was much more overvalued in 1999 (anchoring). This chart from Advisor Perspectives always provides a nice summary of where we are in terms of valuation.
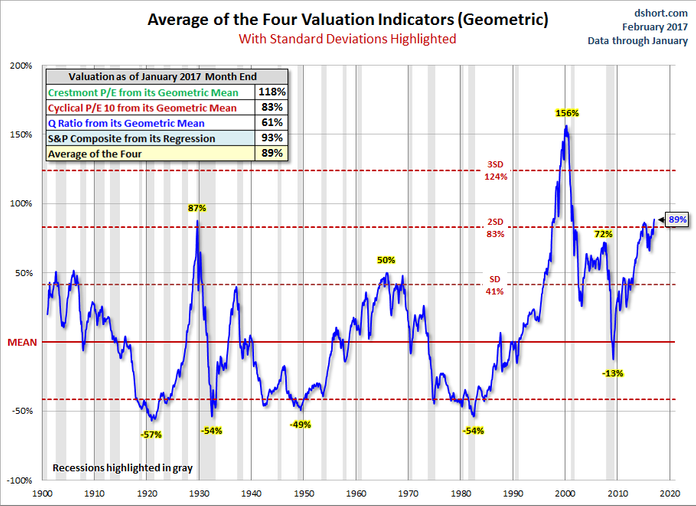
Both of those statements may be true, but it does not mean this is “normal”. The only way to overcome these biases is to study history and use DATA (not our brains) to understand the current environment. The DATA says the market is very risky right now and due for a major correction, although as you can tell from our system allocations, the chances of that immediately happening are small. That can change very quickly (along with our allocations.)
Thursday, February 16
I was scanning my usual sites this morning looking for something to write about and almost gave up. The market has been so quiet there is really not much else I can say. As I was about to just skip a post today I realized that is actually the story and it ties in nicely to this week’s theme. The calm in the markets is giving investors a false sense of security. The longer the market remains in a low volatility trend, the more investors begin to think that is the “norm”. They will both anchor their expectations and use the recent experience when they asses the market risk and where to invest.
The best way to measure this type of complacency is the Volatility Index (VIX). Without getting into the calculations, this is basically a measure of how much “insurance” costs. The lower the volatility the cheaper the insurance. Why would insurance be so cheap? When investors do not sense a need for it.
Looking at the Volatility Index historical chart we can see there have been times in the past when it has been even lower than the current readings. There have also been times where it remained low for longer.
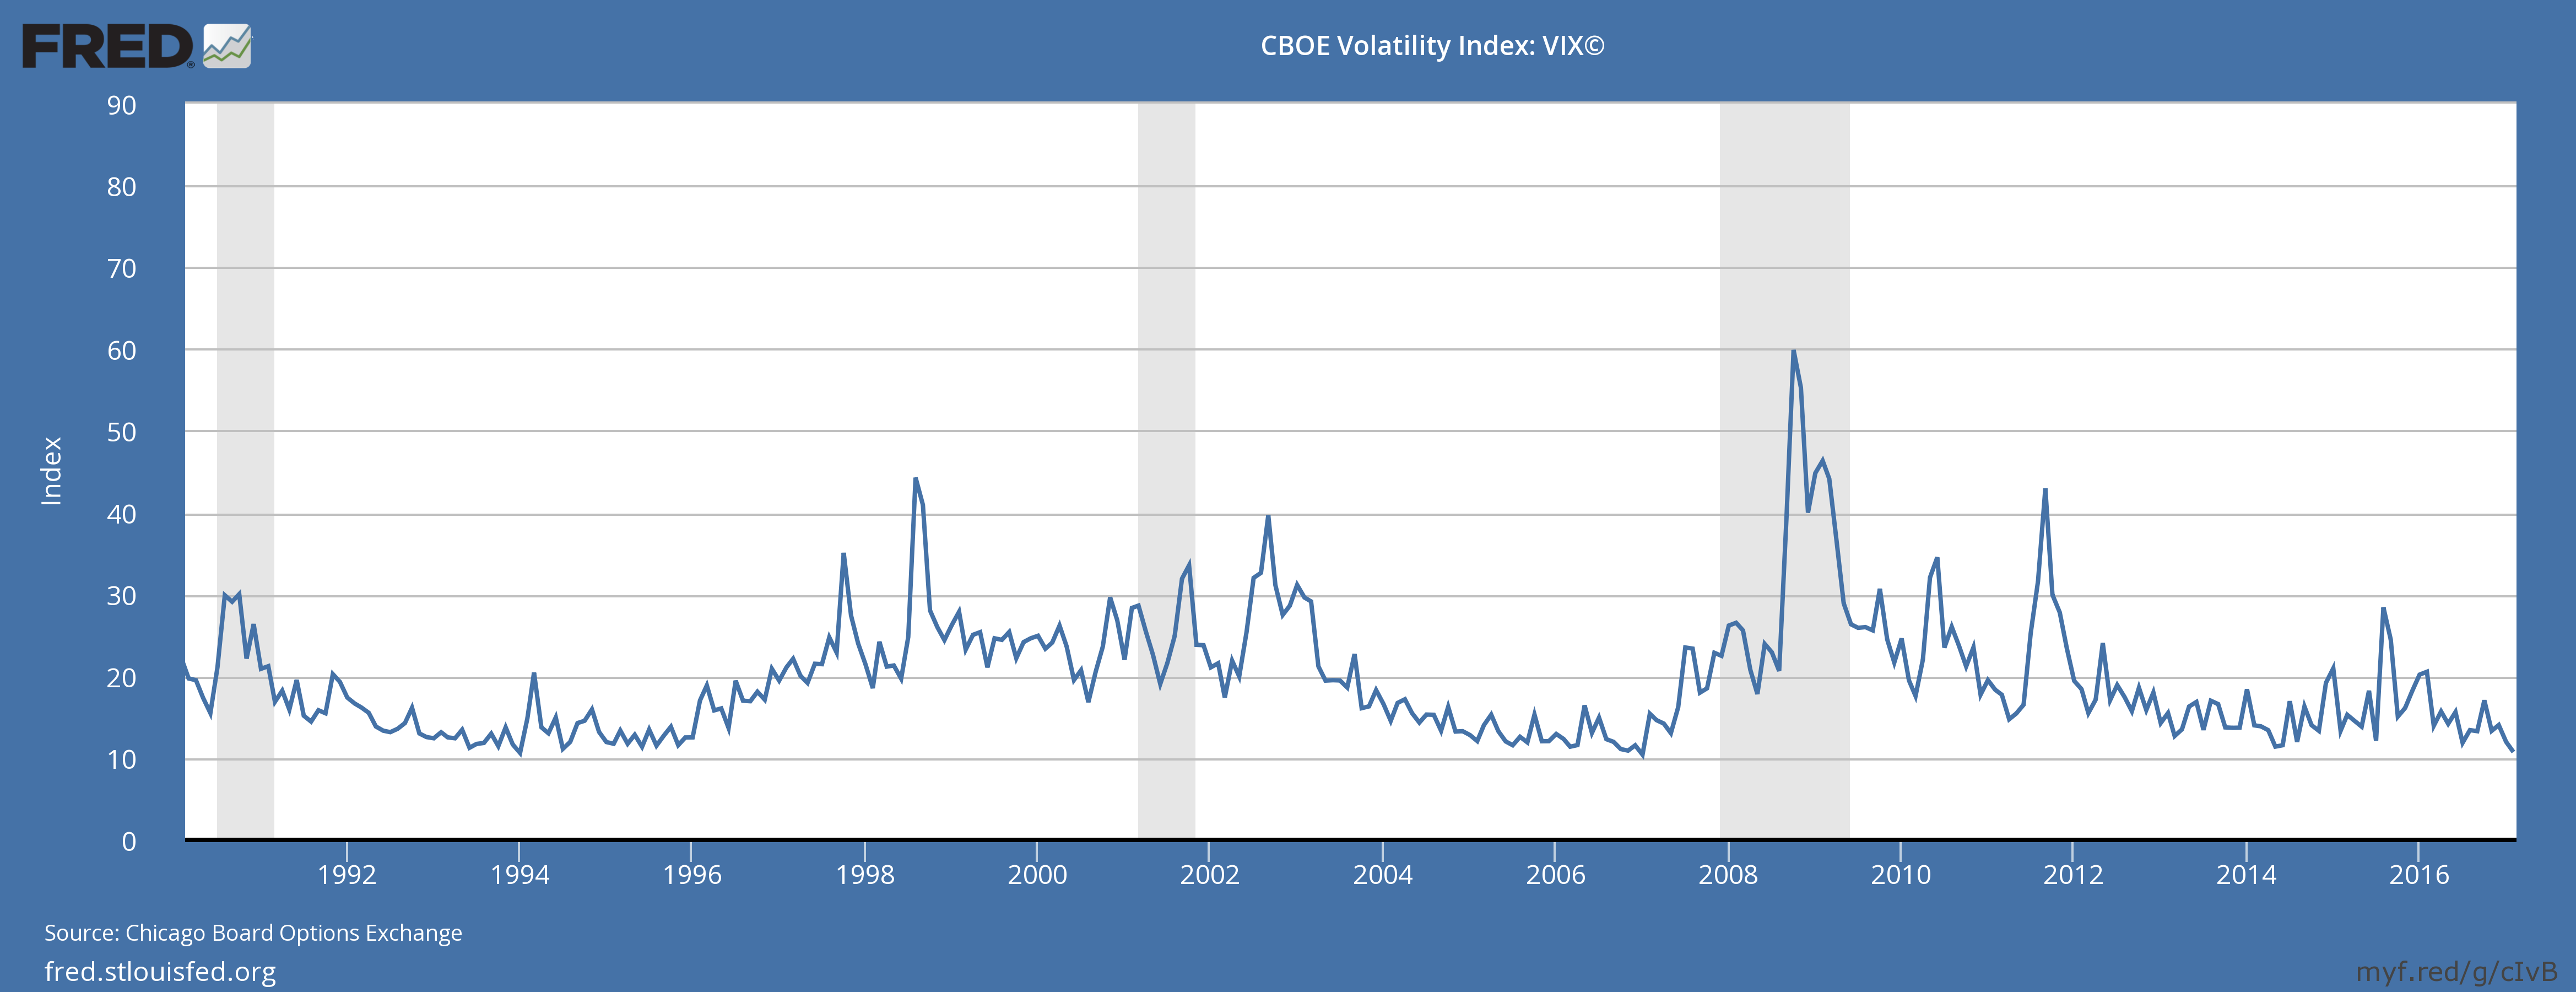
However, we know from studying the DATA that when the VIX gets this low the market is ripe for a “shock”. These shocks usually are the result of something unexpected that causes investors to question their “anchors”. We also know if the market sells off too much or for too long, that because the new “normal” for investors, which is what always happens to far too many people during bear markets.
A low VIX does not mean the market is going to sell-off immediately, but it is something we should all be aware of.


