
For most of the month, October was on pace to be the worst month since the Financial Crisis. The rally the last few days brought it up enough to take away that designation, but it was still the worst monthly performance for the S&P 500 since 2011. Corrections are normal and should be expected, but the reason behind this particular correction should serve as a warning to those who either cannot stomach or cannot afford a much larger correction.
To switch things up this week, I was challenged to do “three in three”. Here is a 3 minute video highlight our 3 Charts of the Week. (Don’t worry, for those of you that don’t like videos I include my normal written discussion below.)

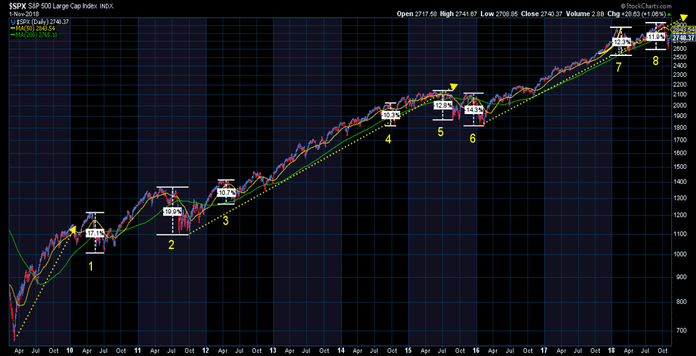
The first Chart of the Week shows the 10% corrections during this bull market. On average the market loses 10% about once a year. The shaded areas are calendar years. We’ve had five 10% corrections in five years and eight over the nine year bull market. The problem psychologically is the distance between them. If we go too long, the next inevitable 10% correction comes as a surprise and feels terrible. If they happen too closely together people begin to feel like the market is too risky for them. If you have felt either of those emotions recently, I’d encourage you to take some time to head over to WhatsMyScore.net and take the free financial assessment. It gives you a nice snapshot of whether you are positioned correctly regardless of what happens next with the market.
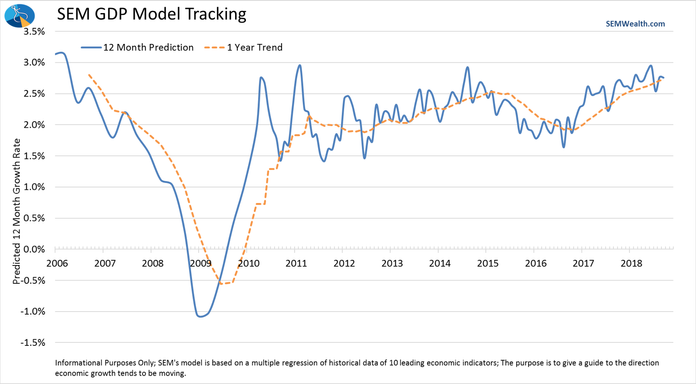
Our economic model continues to show no signs of recession. However, if you look closely the growth rate softened enough for the trend to move from “rising growth” to “neutral” growth. This by itself is not a bad thing. We are most worried about a recessionary bear market where the market typically loses 37-55% just before and during the recession. No signs of that yet, but it was enough for our Dynamic programs to go back to a “neutral” position.
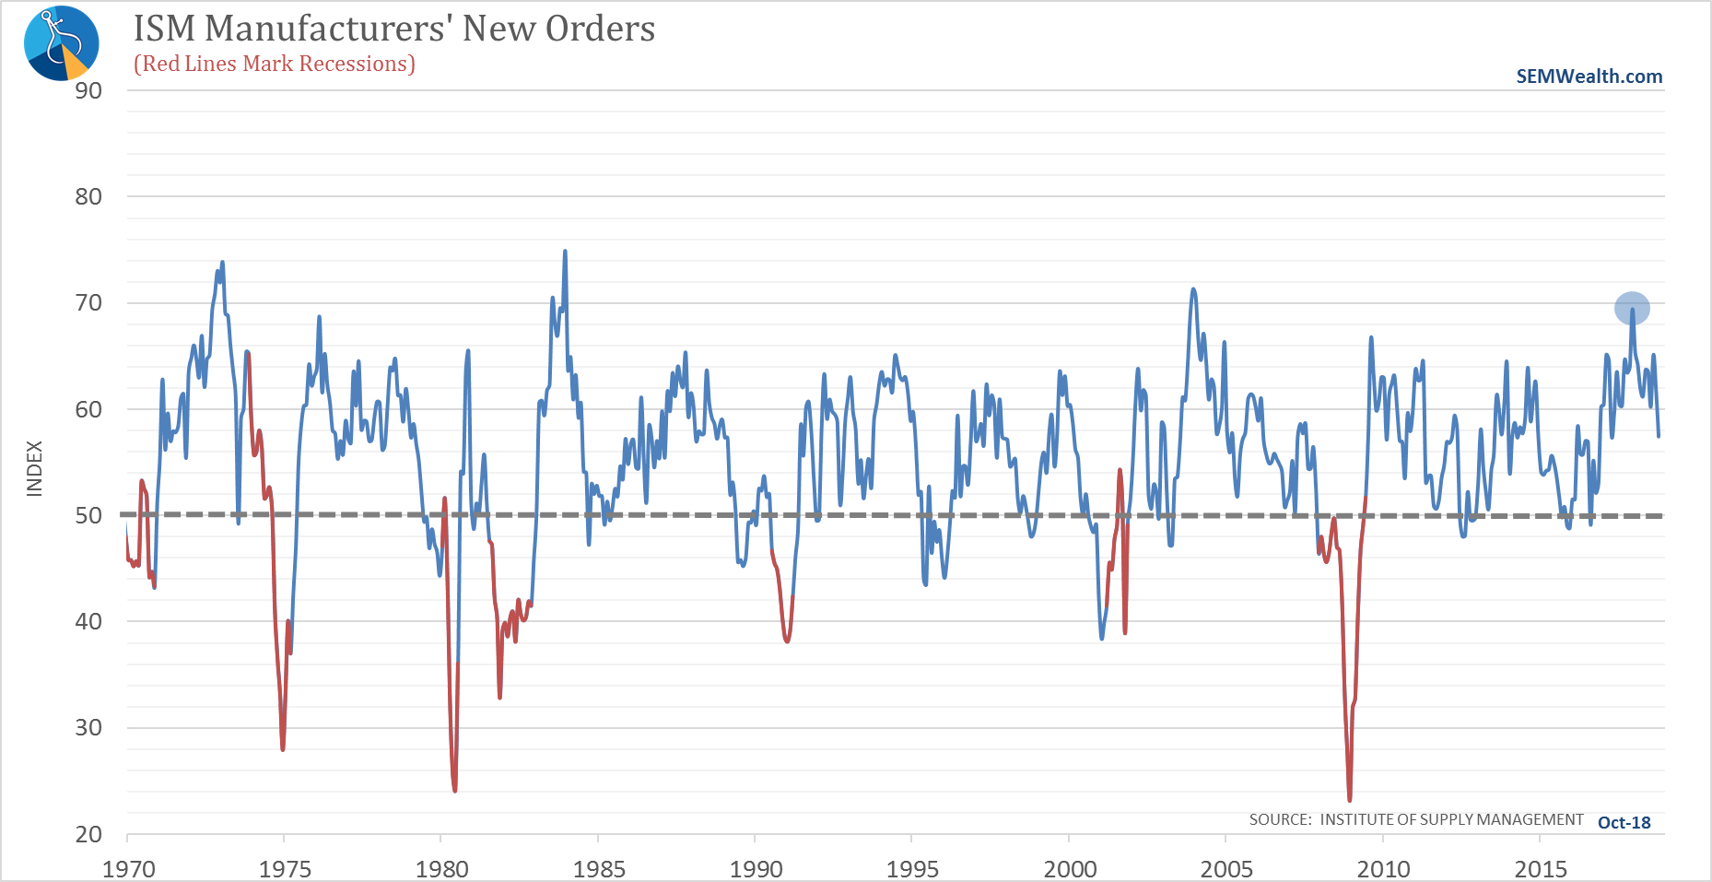
Something to watch, however is whether or not the fear of tariffs created a temporary stimulus as manufacturers increased purchases to get ahead of the January 2019 start of tariffs. We’ve seen drops in the New Orders component of the ISM Manufacturing survey in the past, but notice the big spike we had earlier in the year. This indicator is one of the better ones inside our economic model and is one we will be watching closely.
What’d you think of the video? All the marketing strategists, including our marketing coordinator (who happens to be a Millennial) tell us we need more video content. As a Gen Xer, I don’t like being in videos and prefer to read things rather than watch them. But, the blog is for you, not for me, so let me know if you want to see more videos.


