For several months now I've been promising my post on government spending and the "we can grow our way out of the debt" argument. After pushing it back several times, I decided to make it a stand-alone post. This post also brings back a topic I first discussed back in the mid-2010s while studying for the CFA exam – Potential GDP along with one which has pushed me onto my 'soapbox' many times the last 20+ years – the government budget deficit.
This post is not about politics, per se. It is based on data and economic fundamentals. Both major political parties have been responsible for the position we are in today. Both parties will have to find a way to deal with the consequences of ignoring this problem for so long because it's a problem which will end up hurting all Americans.
1.) Nobody campaigned on the debt, but the bond market will vote
Something you may have heard a lot this year is that we can simply "grow our way out" of the debt. Treasury Secretary Bessent said it on CNBC the week the national debt crossed $40 trillion ("There's nothing magic about the $40 trillion number... And we can grow our way out of that."), and in Dallas in September he put a number on it – keep spending in check and grow 3%, and "we [can] grow our way out of this."
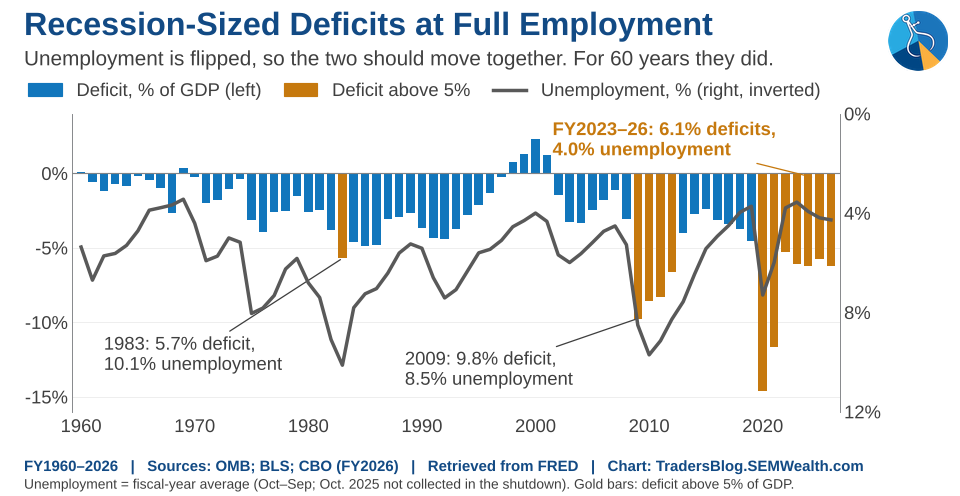
Meanwhile, the debt barely came up on the campaign trail. The Wall Street Journal counted only 30 political ads this cycle that mentioned the debt or deficit (it ranked 52nd among topics), down from 140 in 2018, even though the deficit for the fiscal year that ended September 30th came in at $1.99 trillion, or 6.2% of GDP. That's the 7th straight year above 5%.
The bond market hasn't ignored it. The 10-year Treasury yield hit 5.31% on October 5th, its highest level since May 2002, and almost all of this year's rise came from real yields (what the government has to pay above inflation to convince people to lend it money) rather than higher inflation expectations.
Nobody campaigned on the deficit, but voters keep punishing its symptoms. The party in power has lost ground in 3 straight national elections (2022, 2024 and now 2026), and each time the cost of living was at or near the top of voters' concerns. Running deficits this big with unemployment at only 4.1% adds fuel to inflation (the San Francisco Fed estimated the 2020–21 stimulus added about 3% to core inflation by the end of 2021). This is not a political statement, but simply showing you the data – both parties have run deficits of 5% to 6% of GDP every year since 2022.
2.) Spending keeps climbing while revenue stays flat
The simplest way to see the problem is the chart the Journal ran with its article, which we rebuilt from the Congressional Budget Office's (CBO) data. Since 1970, federal revenue has ranged from 14.5% of GDP (2010) to 20.0% (2000) and averaged 17.3%, while spending went from 18.7% of GDP to 23.1% last year, and CBO projects 24.4% by 2036. The gap between those two lines is the deficit, and borrowing fills it.
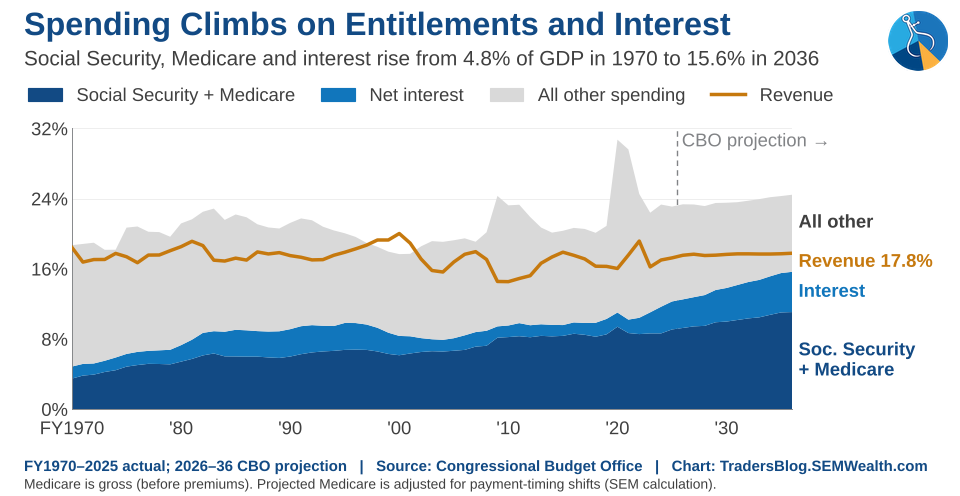
What's driving the spending is no secret. Social Security, Medicare and interest went from 4.8% of GDP in 1970 to a projected 15.6% in 2036, squeezing everything else the government does from 13.8% to 8.8%.
(Side note 2: revenue came in at only 16.8% of GDP last year, below the 17.5% CBO projected back in February. Tariff refunds were a big piece of that – customs collections were $318 billion, but $145 billion was refunded after the Supreme Court struck down the IEEPA tariffs in February, so net customs revenue came in at $173 billion, LESS than the year before.)
3.) We're muddling along at about 2.1%
Before we get to the math, it helps to know how fast the economy can actually grow. Our economic model has the economy growing at about 2.1% over the last 12 months, and the third quarter GDP report agreed (2.1% vs. a year ago, even though the headline number took ONE quarter and compounded it 4 times into 3.4%).
Economists call the economy's speed limit "potential GDP" – in plain English, it's how fast the number of workers is growing plus how much more each worker produces. CBO estimates it at 2.2% right now, slowing to 2.0% by 2030 and 1.8% by 2035 as more of the workforce retires. We're actually running a little ABOVE that speed limit (1.7% above CBO's estimate of potential), which is probably one reason inflation has been so hard to bring down.
The biggest driver in the decline, comes from the worker side which has continued to fade over time. Over the past year, job growth added only 0.3% of the 2.1%, and output per worker did the rest. Over the last 10 years, workers added 0.9% and output per worker 1.6%, for about 2.5% growth. Compare that to the 10 years ending in 1966, when job growth ALONE added 2.1%.
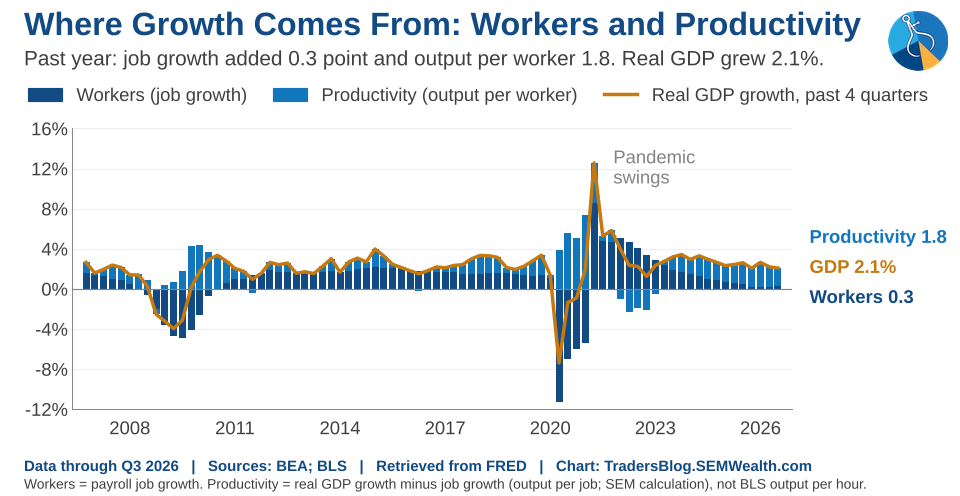
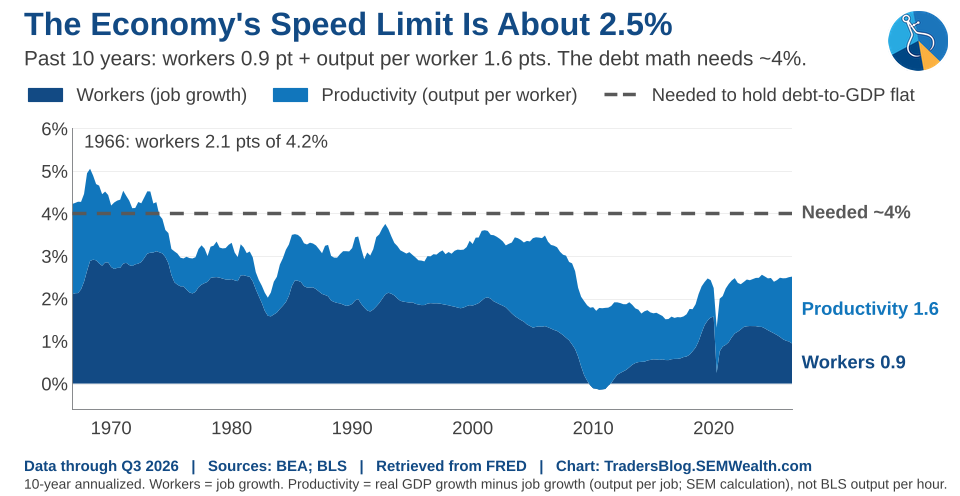
So if the labor force is shrinking or at best not growing very quickly, that leaves productivity as our growth engine. Measured the way the Bureau of Labor Statistics does it (output per hour), productivity has grown about 2.1% a year over the last decade, and the 5-year average I watch is at 1.9%. The two slow stretches since World War II ran about 1.4% and 1.5%, the two payoff stretches (the post-war boom and the internet buildout from 1995 to 2005) ran about 2.9% and 3.0%. Looking at AI, I've marked 2.5% on the 5-year average for confirmation the "buildout" is turning into the payoff.
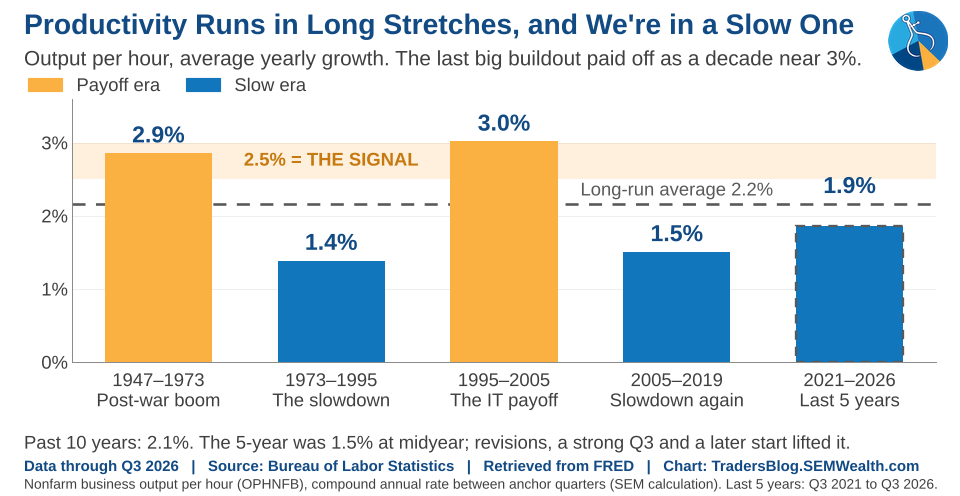
We have seen some improvement already. Productivity grew at a 3.6% pace in the third quarter (annualized), and the 5-year average has moved up from about 1.5% this summer, though some of that is data revisions and where the 5-year window now starts. One hot quarter doesn't make a trend, but it's the first thing I'd point to if I were making the bull case for prolonged, above trend economic growth. Conversely, the forecasters at the Penn Wharton Budget Model estimate AI adds at most 0.2% a year to productivity growth, peaking around 2032.
4.) Growing our way out would take 3.3% to 4% growth for a decade
This is where everyone using the "grow our way out" argument needs to be careful. Before interest, the government spent about 2.9% of GDP more than it collected last year (economists call that the "primary deficit"), and it pays about 3.5% interest on the debt it already has. With the debt now about the same size as the economy (100% of GDP), the economy has to grow fast enough each year to cover both the deficit and interest expense just to keep the debt from growing faster than the economy.
That works out to about 6.6% growth (before inflation), which is roughly 4.2% real growth with 2.3% inflation, about double CBO's estimate of potential. We do need to keep in mind that faster growth also brings in more tax revenue, which lowers the hurdle a bit. The Committee for a Responsible Federal Budget (CRFB), using CBO's own model, puts it at 3.3% real growth every year, against CBO's projection of 1.8%.
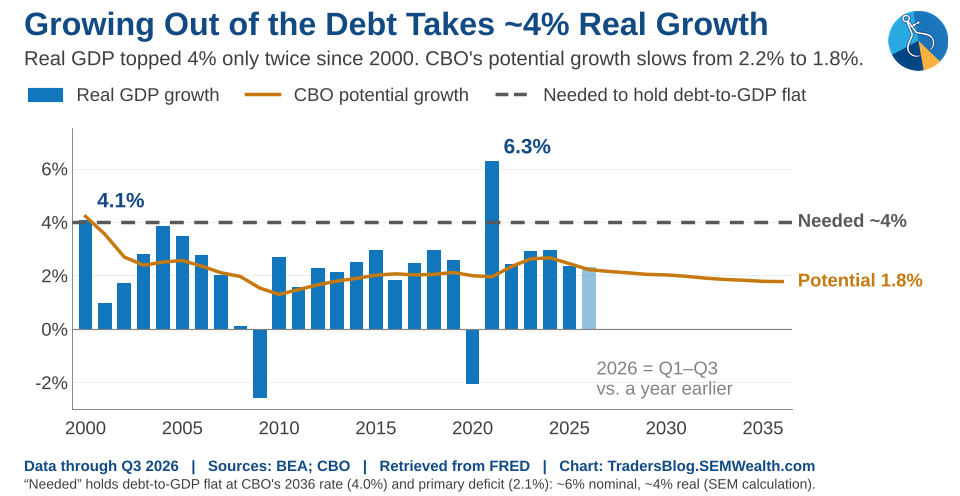
So how often has the economy actually done that? Looking at every 10-year stretch since 1947, real growth averaged at least 3.3% in about 37% of them, but in only 22% of the stretches since 1990, and the last one ended in 2006 (the tail end of the internet productivity boom). The last 10-year stretch at 4% ended in 1973, and over the past 10 years we've grown about 2.5%. The last time the economy grew fast enough for long enough to pull this off was the last tech boom, and that's the bar AI has to clear.
Secretary Bessent's 3% is in the right neighborhood, but it would have to happen every year for a decade AND spending would have to stay in check, which hasn't happened under either party. If we stay at our 2.1% GDP growth level, the primary deficit would have to shrink from 2.9% of GDP to about 0.9% just to hold the debt steady, a gap of roughly $650 billion a year.
That leaves the option nobody wants to say out loud – inflation. Inflating our way out has had its fans on both sides lately (the "MMT" push during the Biden years and the "Mar-a-Lago Accords" talk under President Trump are basically the same idea), and that story deserves its own post.
Secretary Bessent said back in February that "for the American people, inflation is not an option," and I agree with him, but that's exactly the problem – if inflating our way out is off the table, growth has to do all of the work, and the math says it would take something we haven't seen since the internet boom.
(Side note 3: the interest rate on the debt has been below the economy's growth rate in 15 of the last 16 years, which is supposed to be the "good" version of this math, and the debt still went from 60% of GDP to 100%. Friendly math doesn't help much when you keep adding to the bill.)
5.) Half of what we borrowed this year went to interest
One argument I hear often is that interest on the debt isn't a drag on the economy. I guess technically that's true. GDP counts what the government buys, and interest is a payment to bondholders (just like a Social Security check is a payment to retirees), so it doesn't subtract from GDP. The problem is it's the least productive dollar in the budget.
Net interest cost us $1.05 trillion last year, up from $475 billion just 4 years ago. That's $87 billion more than we spent on national defense and about the same as Medicare. It took 19.5% of all federal revenue, a new record (the old record of 18.4% was set in 1991, and we passed it in 2025), and CBO projects about a quarter of revenue by the mid-2030s.
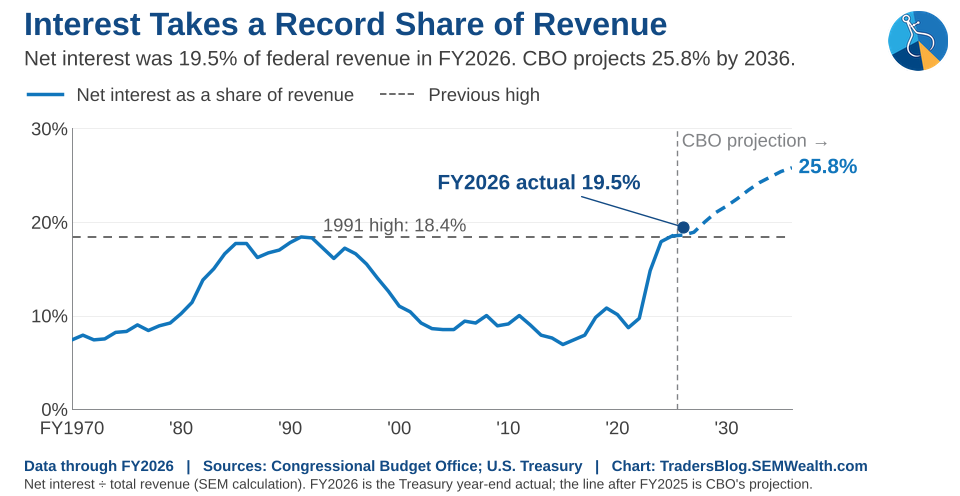
Interest was also more than half of the deficit. Of the $1.99 trillion we borrowed last year, $1.05 trillion went to interest, so only the 2.9%-of-GDP primary deficit was new spending or tax cuts that could actually help the economy grow. Half of what we borrowed this year went to paying rent on what we borrowed before. CBO has the primary deficit holding near 2% of GDP over the next decade while interest climbs to 4.6% of GDP ($2.1 trillion) by 2036, so all of the projected widening in the deficit comes from interest.
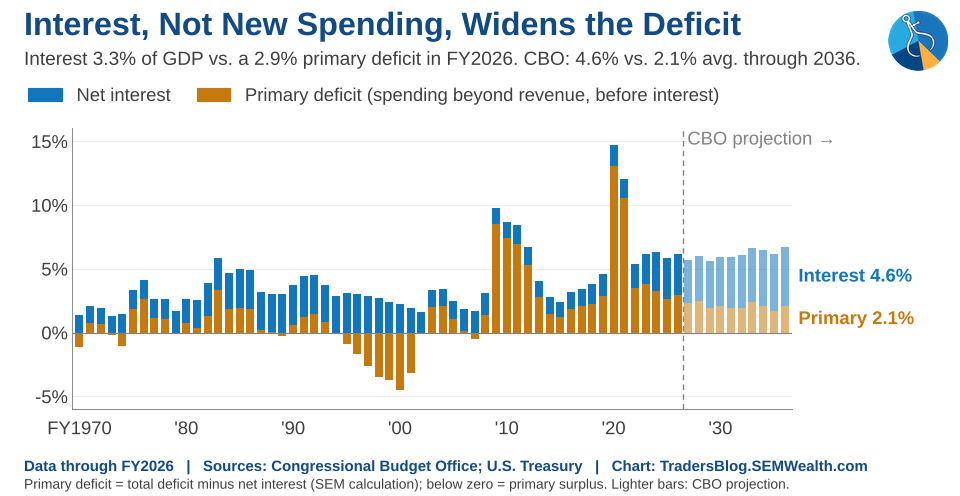
Interest is also a weak engine for growth because of where it goes. Bondholders (banks, funds, wealthier households and foreign investors) spend less of each extra dollar than most social program recipients, and about 30% of the debt is held overseas (down from about half in 2008, which I've said before is a good thing).
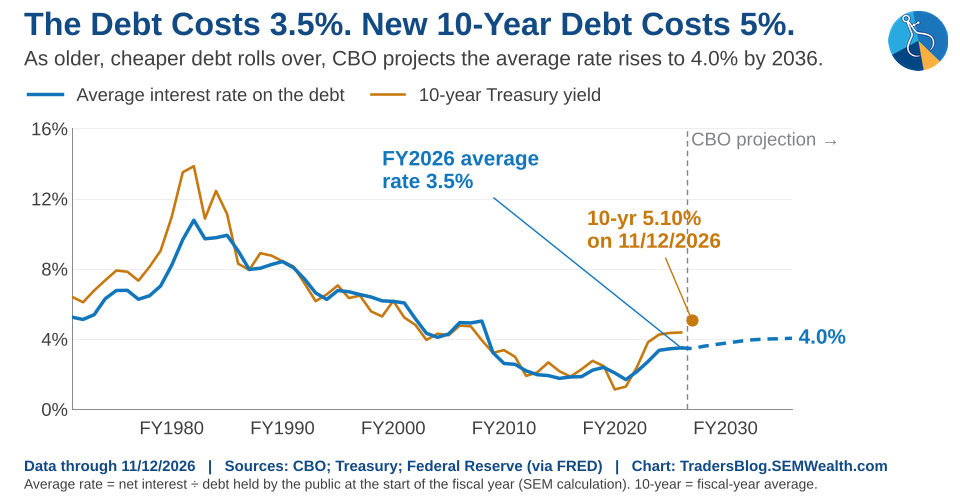
Even if interest rates stay the same, the bill keeps growing. The average rate on the debt is about 3.5%, but new 10-year debt costs about 5%, so every time older, cheaper debt matures and gets refinanced, the interest bill goes up. CBO projects the average rate rising to 4.0% by 2036. More borrowing can also push long-term rates higher. The CBO estimates each 1% increase in debt-to-GDP adds about 0.02% to 0.03% to long-term rates, which sounds small until you remember CBO has the debt going from 100% of GDP to 120% by 2036, which would add roughly 0.4% to 0.6%. Higher rates raise the interest bill, which leads to more borrowing.
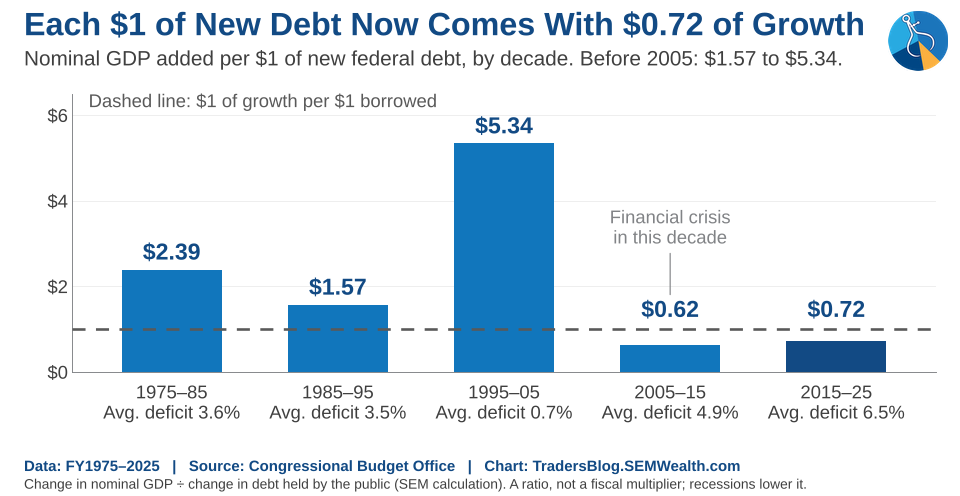
One more way to look at it is how much economic growth we're getting for each dollar we borrow. Over the last decade, each $1 of new federal debt came with about $0.72 of economic growth, compared with $5.34 from 1995 to 2005 (when the budget was close to balanced). It's a simple ratio (recessions make it look worse, since they raise deficits and lower growth at the same time), but the direction tells the story – we're borrowing more and getting less for it.
6.) Social Security and Medicare are the built-in squeeze
The part of the budget nobody wants to touch is also the part that grows on autopilot. Social Security and Medicare total 8.5% of GDP (Social Security 5.2%, Medicare 3.3% after premiums), and CBO has them rising to about 10.1% by 2036. Together with interest, they account for most of the projected growth in spending.
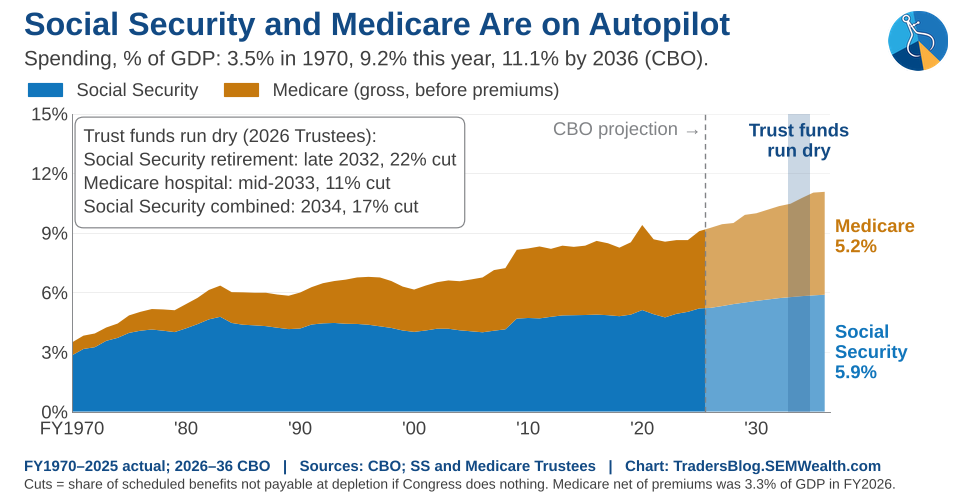
According to this year's Trustees report, the Social Security retirement trust fund runs dry in late 2032 (an automatic benefit cut of about 22% if Congress does nothing), Medicare's hospital trust fund in mid-2033 (about an 11% cut) and Social Security's retirement and disability funds combined in 2034 (about 17%). When you hear "2032," that's the retirement fund by itself.
Since the 1983 reform, Social Security ran surpluses that were lent to the Treasury and spent, which made the rest of the budget's deficits look smaller for decades. That flow has now reversed, as the trust fund cashes in those IOUs and the Treasury has to borrow from the public (or raise taxes) to pay them. Redeeming IOUs doesn't change the total debt, but it does change who we owe – interest the government used to pay itself becomes real interest paid to outside investors. That's a big enough topic for its own post down the road, likely when Congress takes it up (hopefully next year?!?).
7.) What would change our path?
I've said before that we do have a chance with AI to potentially grow our way out of this.......if things go right. What would that look like? The first would be productivity holding above 2.5% on the 5-year average (see #3 above). I personal am a big believer in the technology, but my own experience and backed by researching past cycles keeps me from being as optimistic (short-term) that we will see a sustained productivity surge (yet).
 Jeff Hybiak, CFA
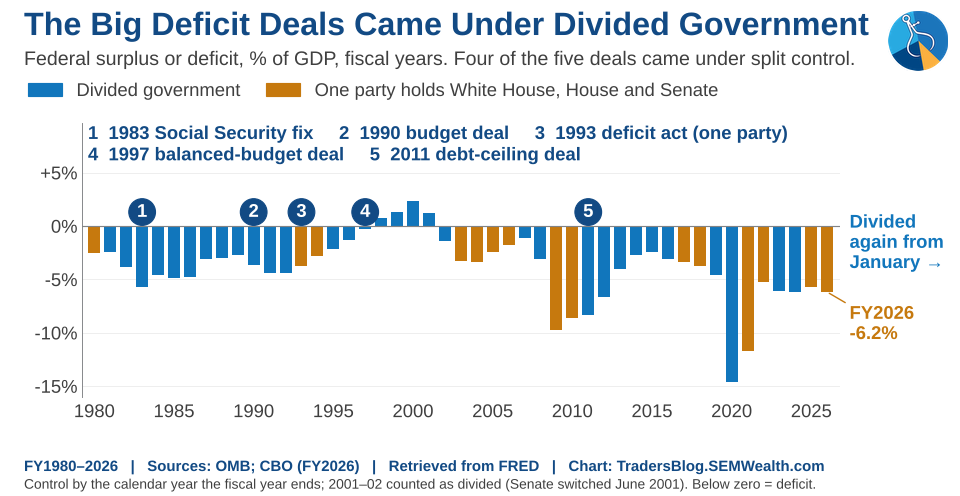
The second would be a real bipartisan deal to shrink the deficit (some spending restraint AND some new revenue, so both parties give something up), along the lines of the 1983 Social Security fix or the 1990 and 1997 budget deals.
That second one may not be as far-fetched as it sounds. Starting in January we'll have divided government, and four of the five big deficit deals since 1980 came when neither party controlled both Congress and the White House (1993 was the exception). Taking the other side, divided government doesn't fix anything on its own (the 14.7% deficit in 2020 came under split control too, but that was during COVID) The lesson is the deals that actually worked needed both parties' fingerprints on them.
As I showed last week, a Republican president with a Democratic Congress has been the weakest of the six combinations for stocks since 1950, though the average year was still up 8.6%.
For portfolios, the biggest impact is likely on long-term interest rates. Nobody can reliably predict where deficit-driven long rates will go (I learned that lesson again this fall), which is why we don't bet on interest rates or rely on passive "core" bond funds. Our Tactical bond models follow price trends instead of forecasts (they've been in money market since the September 24th sell signal). Our Dynamic Income Allocator uses outside tactical/quantitative bond managers rather than aggregate bond funds.
None of this means we're doomed. Some growth, some restraint and a little inflation have shared the work before (the 1990s), but anyone telling you we can simply grow our way out of $40 trillion is asking the economy to do something it hasn't done in 20 years.
As always, we are here watching and adjusting so you don't have to.
I'll update this post as the numbers change.