Once again it was a whirlwind of a week for the markets. We had an election, the Dow's best day since April 2025 (even though I personally don't follow or quote the Dow, it did make mainstream headlines), followed the next day by the S&P 500's worst day since April 2025, the biggest weekly drop in oil prices since the start of COVID, and a jobs report that came in at more than double what the "experts" expected.
On Tuesday (Election Day) I was teaching Liberty University's Investments class about behavioral finance, and I couldn't have scripted a better week to show how human behavior causes overreactions in BOTH directions. I told them to expect post-election volatility, but didn't imagine what we'd see on Wednesday and Thursday.
That's again a lot of news, so we're going to stay with the original "musings" format (quick hits that tell the story with pictures). I had planned to finally publish my post on government spending and the "we can grow our way out of the debt" argument this week, but it deserves its own space, so look for it next Monday (11/16)......hopefully!
Before we get there, Cody broke down what the election results mean (and what they don't):
 Cody Hybiak

We also updated our Everchanging AI post on Friday, including some new SpaceX financial data and some new levers we can play with. Check it out here:
 Jeff Hybiak, CFA
With that out of the way, here's what's on my mind as we kick off the week:
1.) The election's biggest market impact was on AI
Every headline I read this week had the same storyline – the election CAUSED the AI sell-off. Democrats won control of both the House and the Senate, which means divided government starting in January, but the result that seemed to matter most to the market was further down the ballot. Texas and Georgia both elected governors who campaigned on pausing new data centers, and 38 of the 41 local data center measures on the ballot went for a ban or a pause. Those two states hold about a third of the planned data center capacity in the country (Texas 27% and Georgia 7%), according to Wells Fargo. Georgia voters also gave Democrats control of the commission that sets Georgia Power's rates, which could make power contracts for new data centers more expensive.
(Make sure you check out George's "Charts of the Week" for a closer look at this.)
As I always say, do not let your political opinions influence your investment decisions. (Cody's post above covers the politics, so I'll stick to the data.) Back in October I showed that a Republican president with a Democratic Congress has been the weakest of the six combinations for stocks since 1950. That's now the setup for the next two years. The average year was still up 8.6% and the typical (median) year was up 7.1%, with 16 of the 22 years positive.
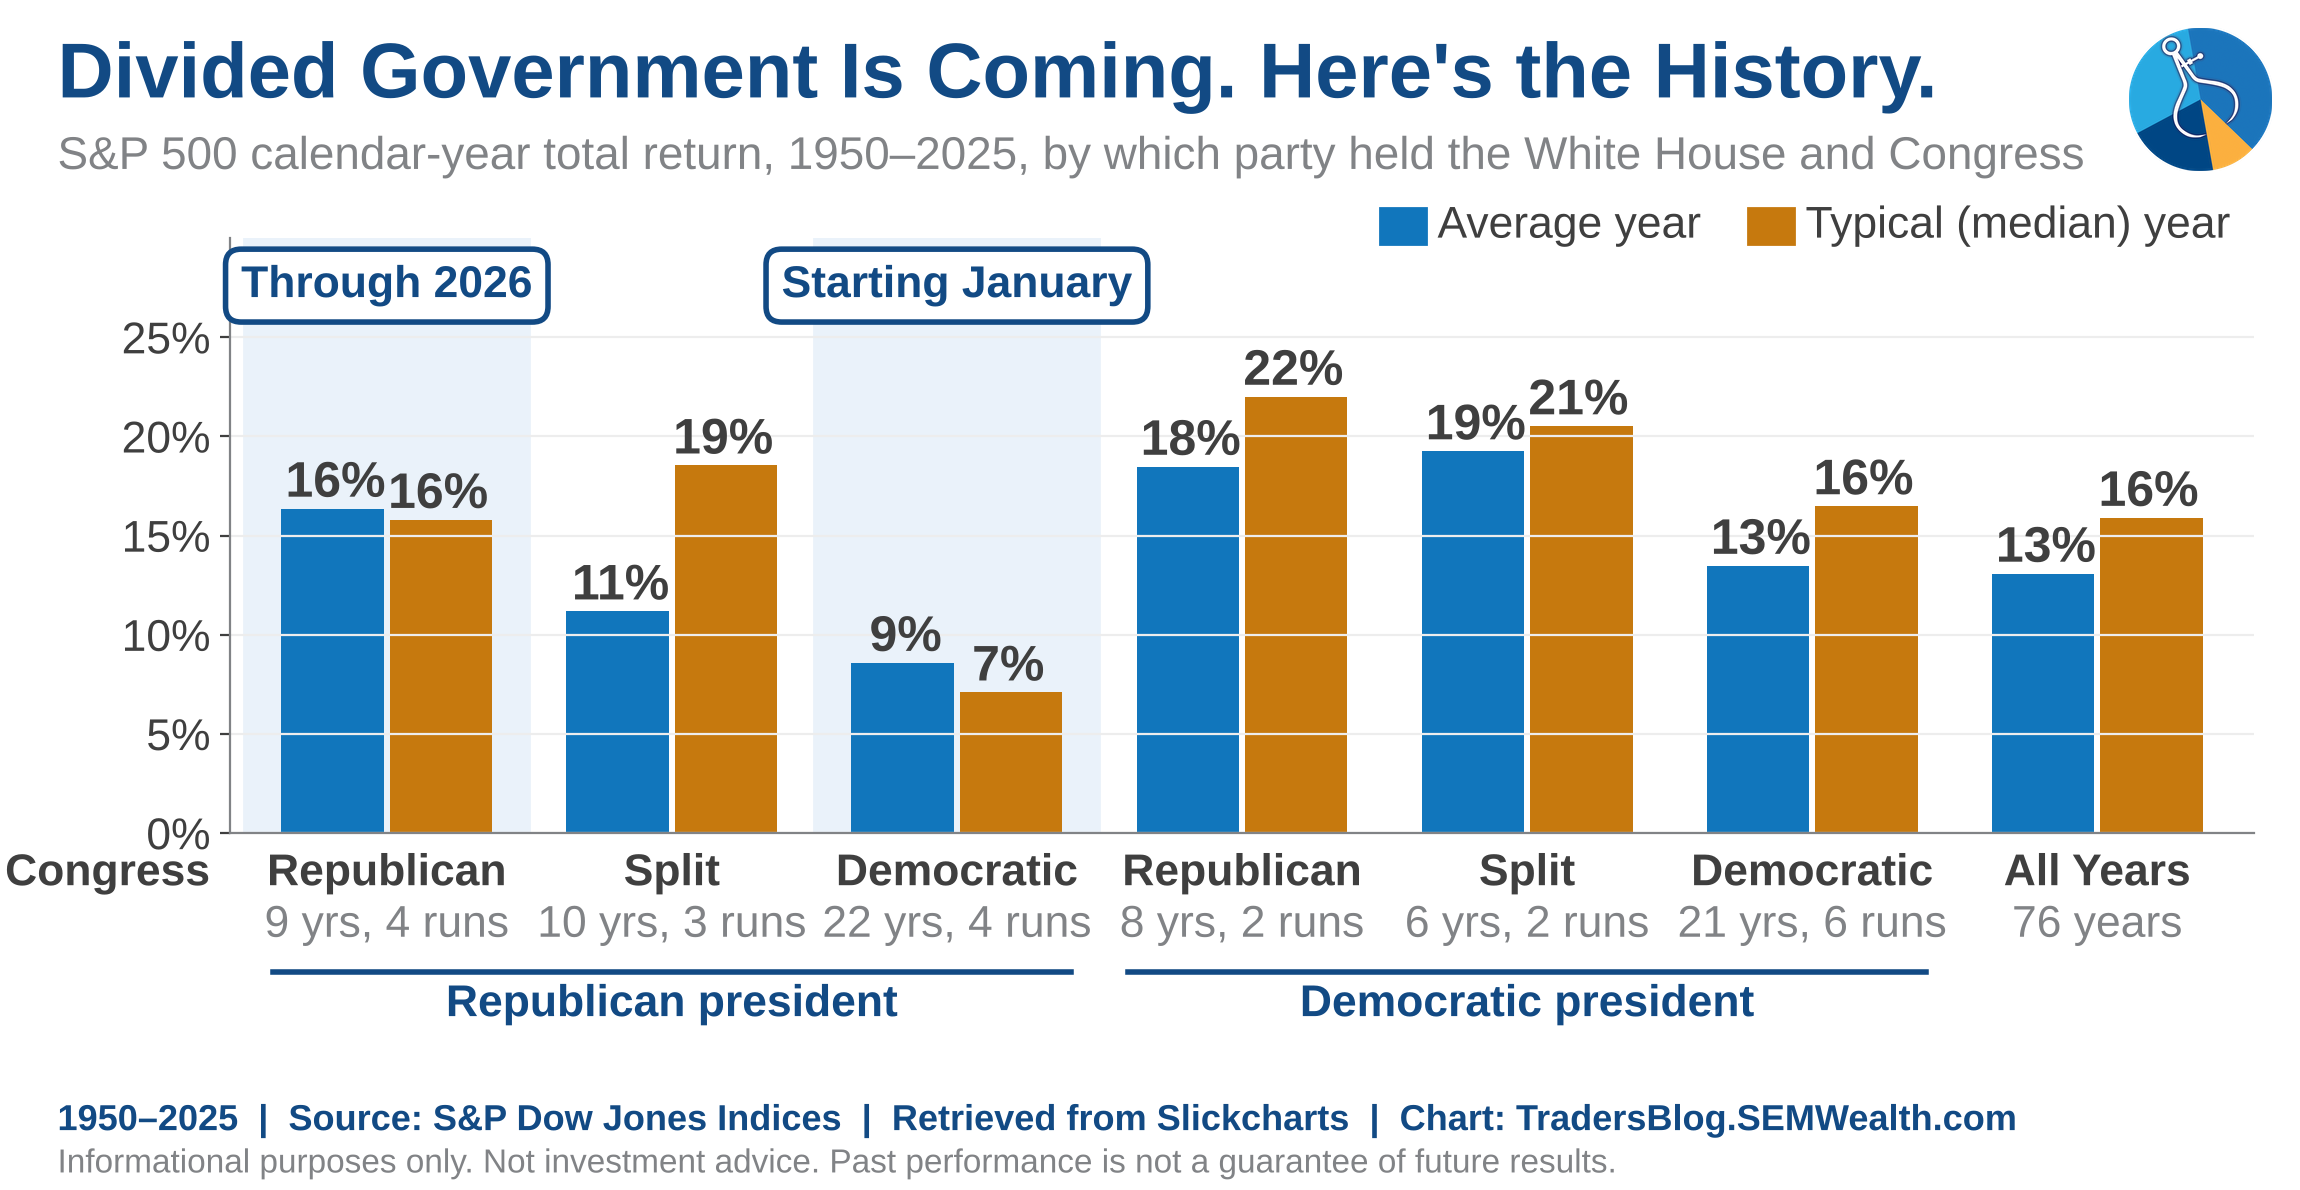
I'd be careful reading too much into this. Those 22 years came from only 4 stretches, and the average is dragged down by 1973-74 (an oil shock, sound familiar?) and 2008. Campaign promises also rarely become actual policies. Texas and Georgia will both have divided government too – Democrats won (or are projected to win) the state House in both, but Republicans kept both state Senates, and any new law has to get through both chambers. A governor can't simply block projects by decree either. In Texas, the biggest lever is appointing the state's environmental regulators, and those appointments need two-thirds of the (Republican) Senate to confirm them. In fact, the outgoing Republican governor had already paused state approvals for new data centers in August and September (until a grid and water audit due in December), which tells you the backlash is bipartisan.
On the stage this fall I said I thought some of the opposition would fade after the election ("Well, actually this data center is ok because (insert political spin here)."). It's still too early, but so far the market is betting the other way for now.
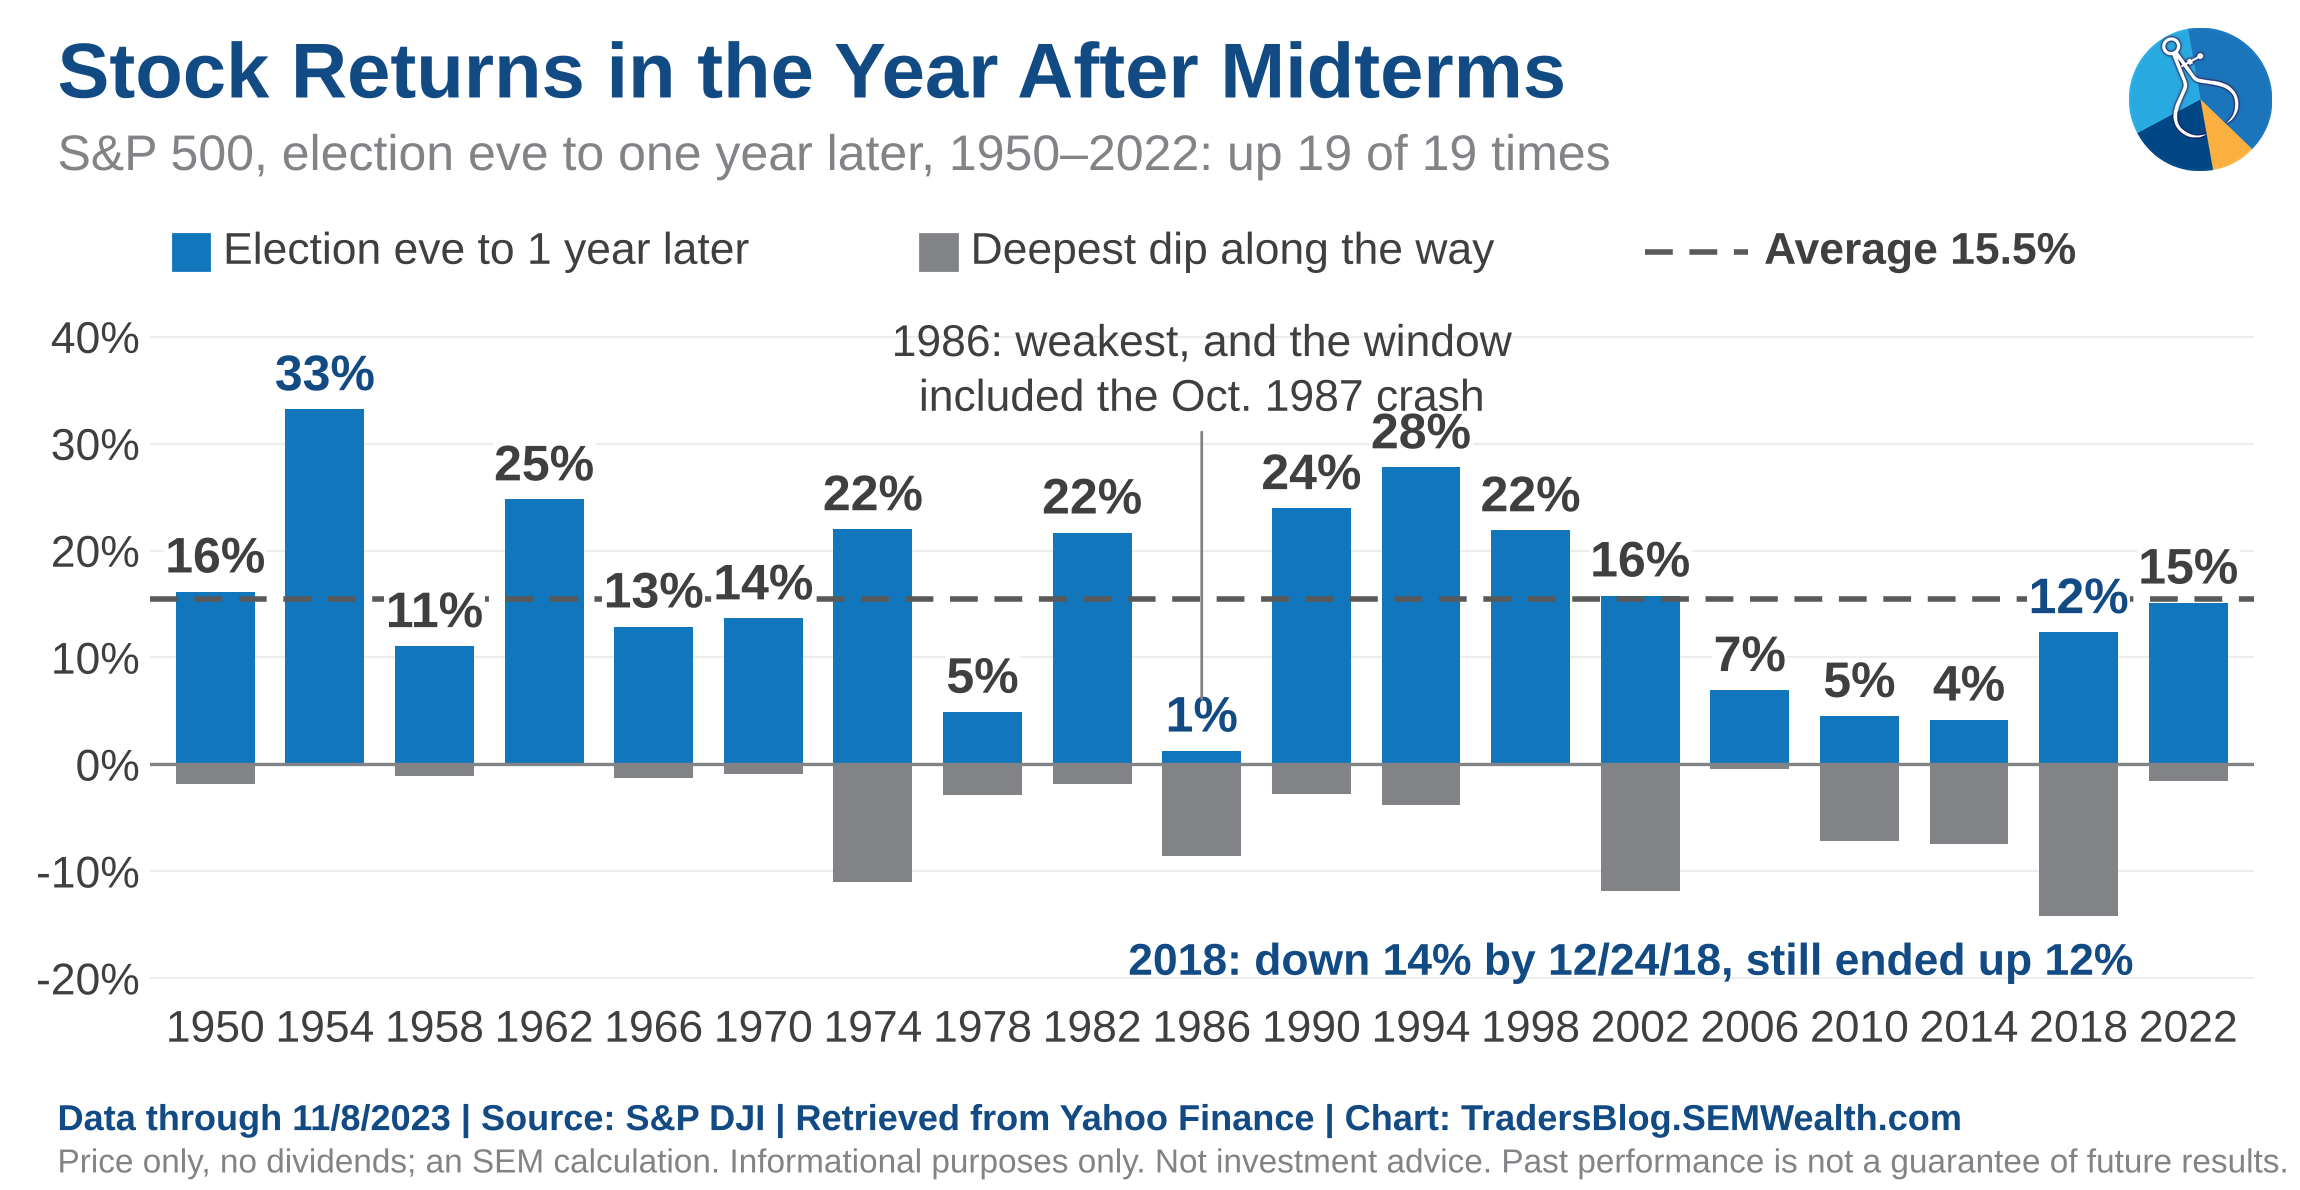
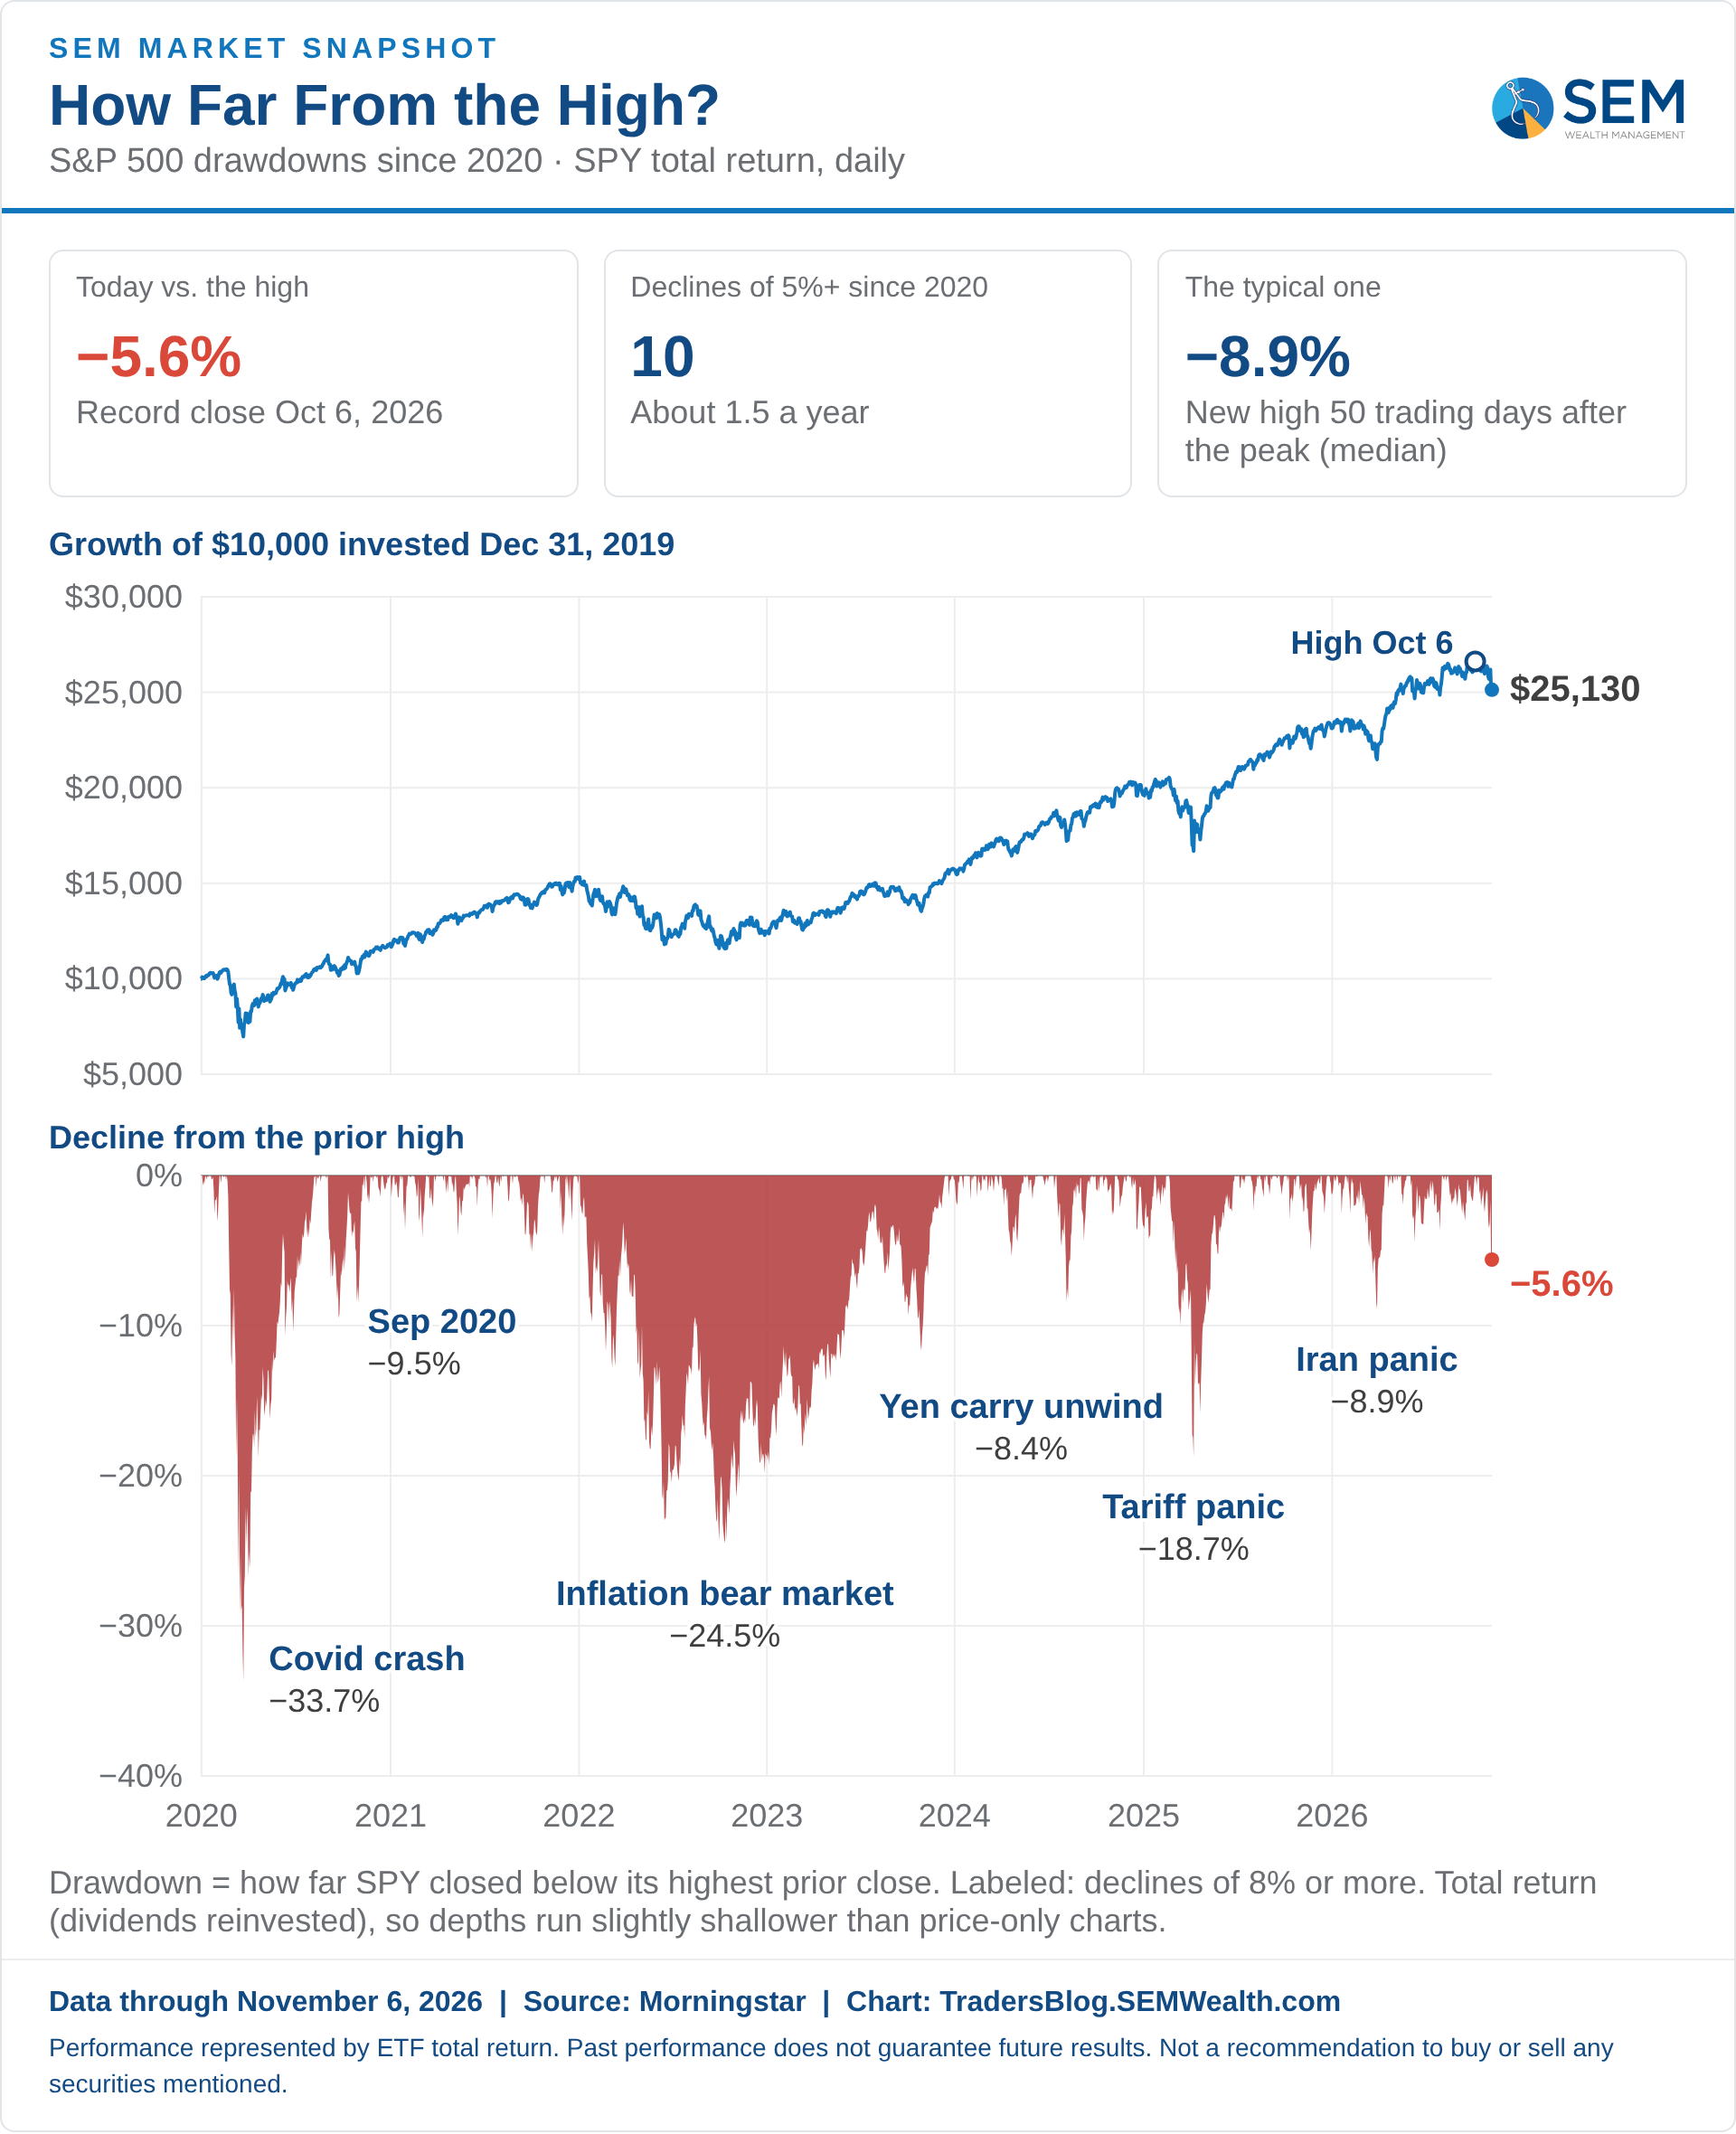
(Side note: the "perfect" 19 for 19 record for stocks in the year after a midterm, which I mentioned last week, is measured from the close before Election Day. Year 20 got off to a rough start, with the S&P 500 down about 2% in its first four trading days. As I said last week, it's rarely smooth.)
2.) The market sold the builders, not the spenders
The "AI sell-off" headlines made it sound like everything AI-related was dumped, but under the surface the market made a very specific bet. From the Election Day close through Friday, the companies SPENDING the money on AI (aka the hyperscalers – Microsoft, Amazon, Alphabet and Meta) were actually UP slightly (on average). The companies building the data centers, supplying the power and renting out the capacity (the "neoclouds" like CoreWeave and Nebius) fell 14% to 17%, even after Friday's bounce.
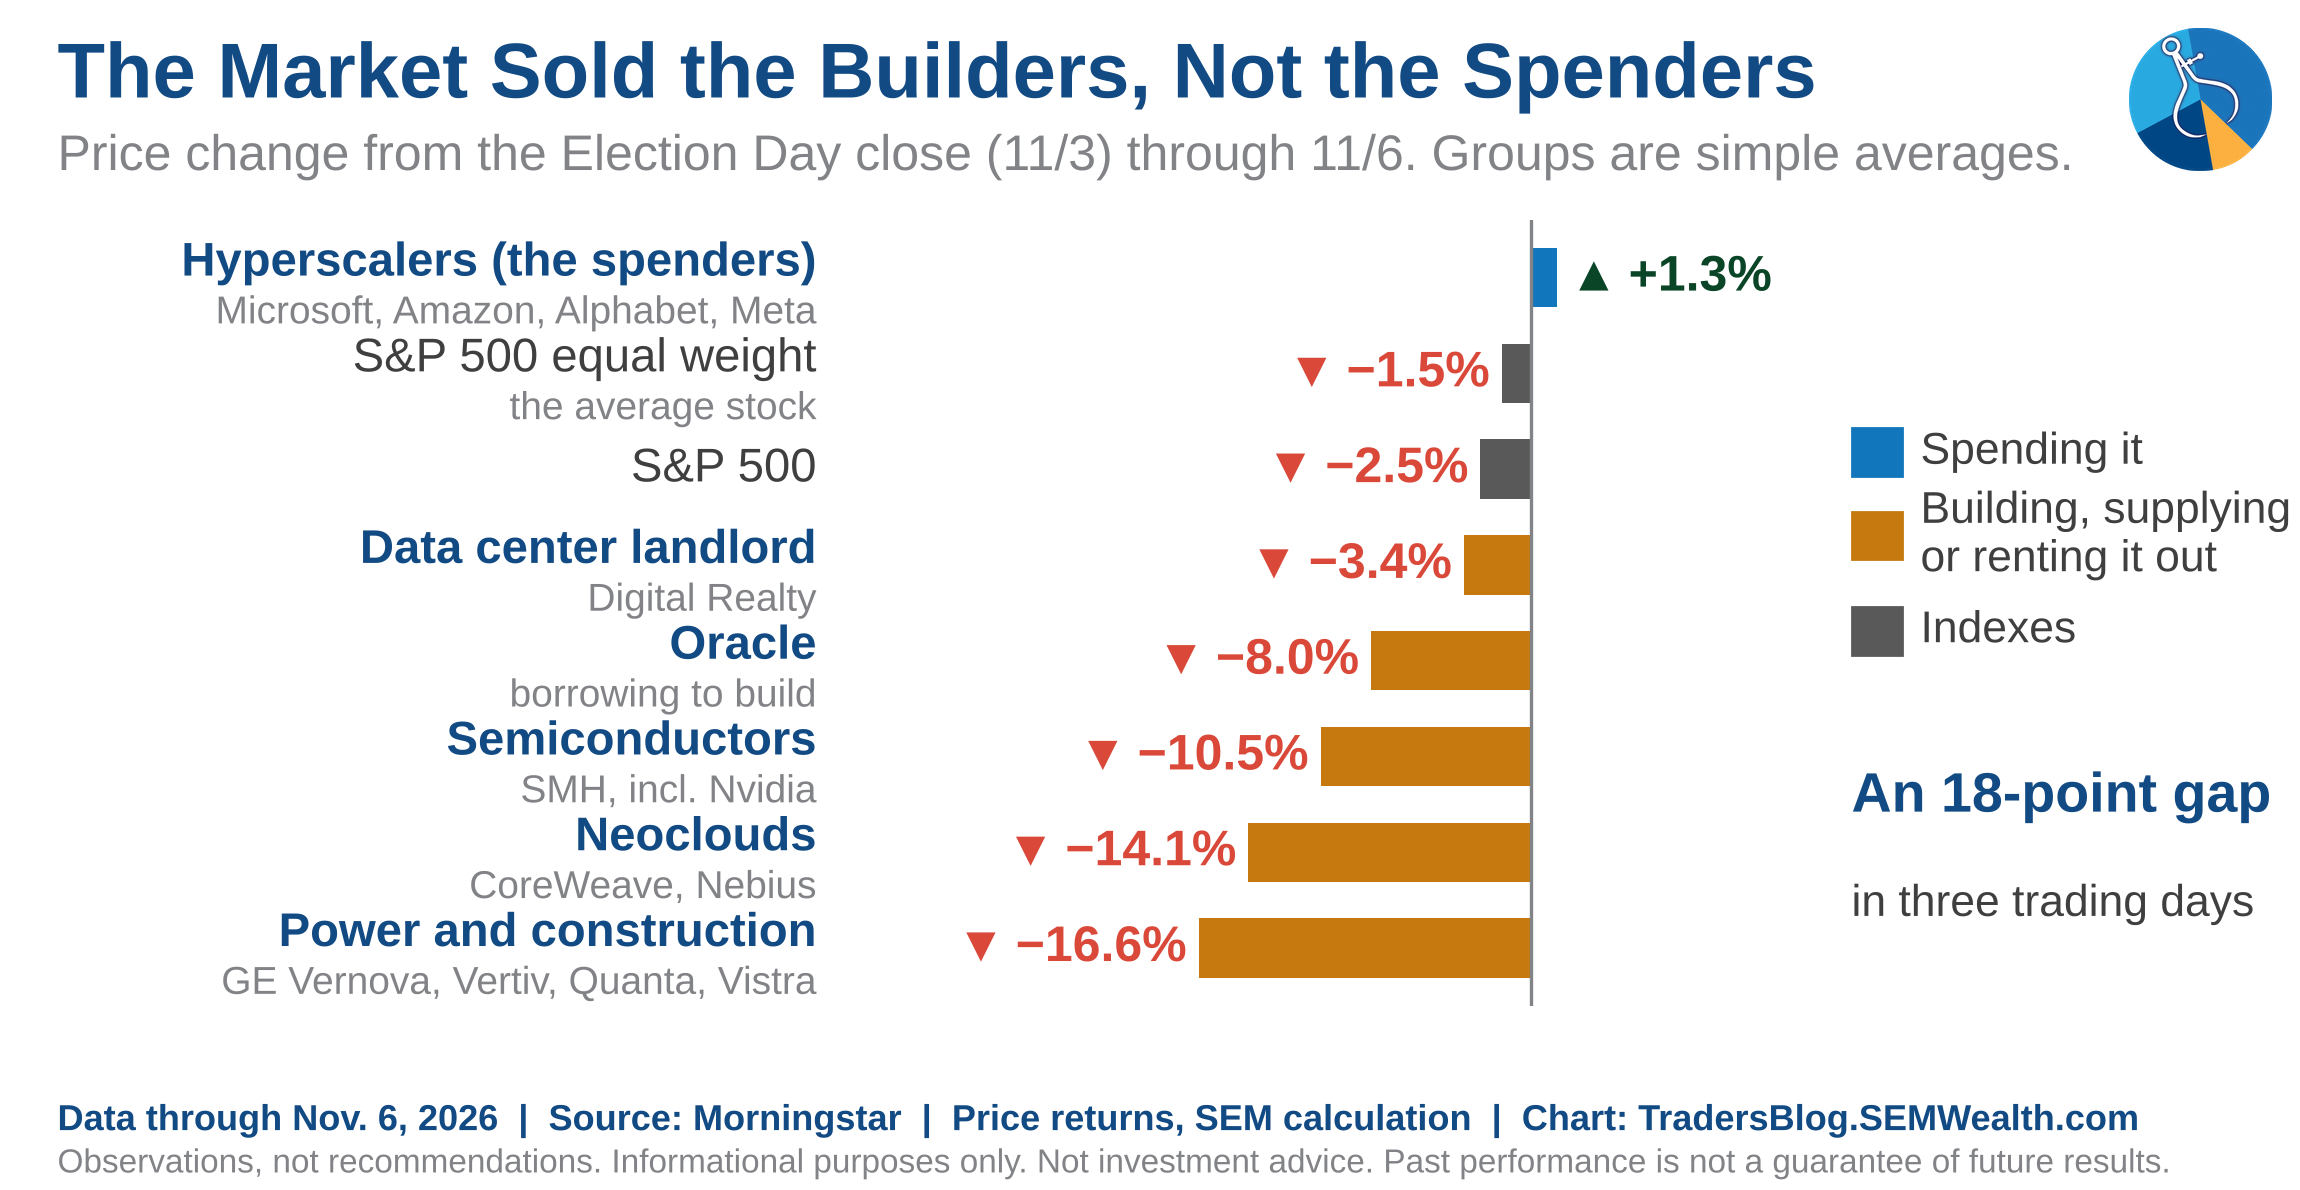
My read is that the market thinks slower data center construction could actually be GOOD for the hyperscalers. The capacity already being built still comes online, and if new projects get delayed, the biggest spenders would be forced to slow their capital spending, which means more free cash flow (which, as I showed last week, three of the four burned through last quarter). The ones who get hurt are the companies whose growth depends on the buildout continuing to accelerate.
Taking the other side, the hyperscalers could simply build somewhere else (another state or overseas), likely at a higher cost and later than planned, so their spending may not fall at all. It also limits how fast they can grow their cloud business, which is their growth engine. On Friday chip stocks bounced (semiconductors gained 3.6%) after the President said he fully backs the AI buildout.
Two other things caught my eye. AMD beat earnings estimates AND raised its outlook, but its free cash flow fell 64% and it took on $4.7 billion of new debt, which led to the stock dropping 17% on Thursday. That's the same "cash, not growth" story we saw with the hyperscalers last week. Add to that Anthropic's IPO, which we covered in our "Everchanging" report, is now reportedly looking at a valuation closer to $1 trillion rather than the $1.5 trillion investors expected a week ago, with the listing possibly delayed.
3.) Chicken or the egg? The chip sell-off started before the vote
This is the question I kept coming back to this week – did the election cause the AI sell-off, or did it just pour gas on a fire that was already burning? The data says mostly the latter. Semiconductor stocks peaked on October 5th and were already down 18% by the close on Election Day. Even after Friday's bounce they finished the week down 27% from the peak, so about two-thirds of the decline happened BEFORE anyone voted.
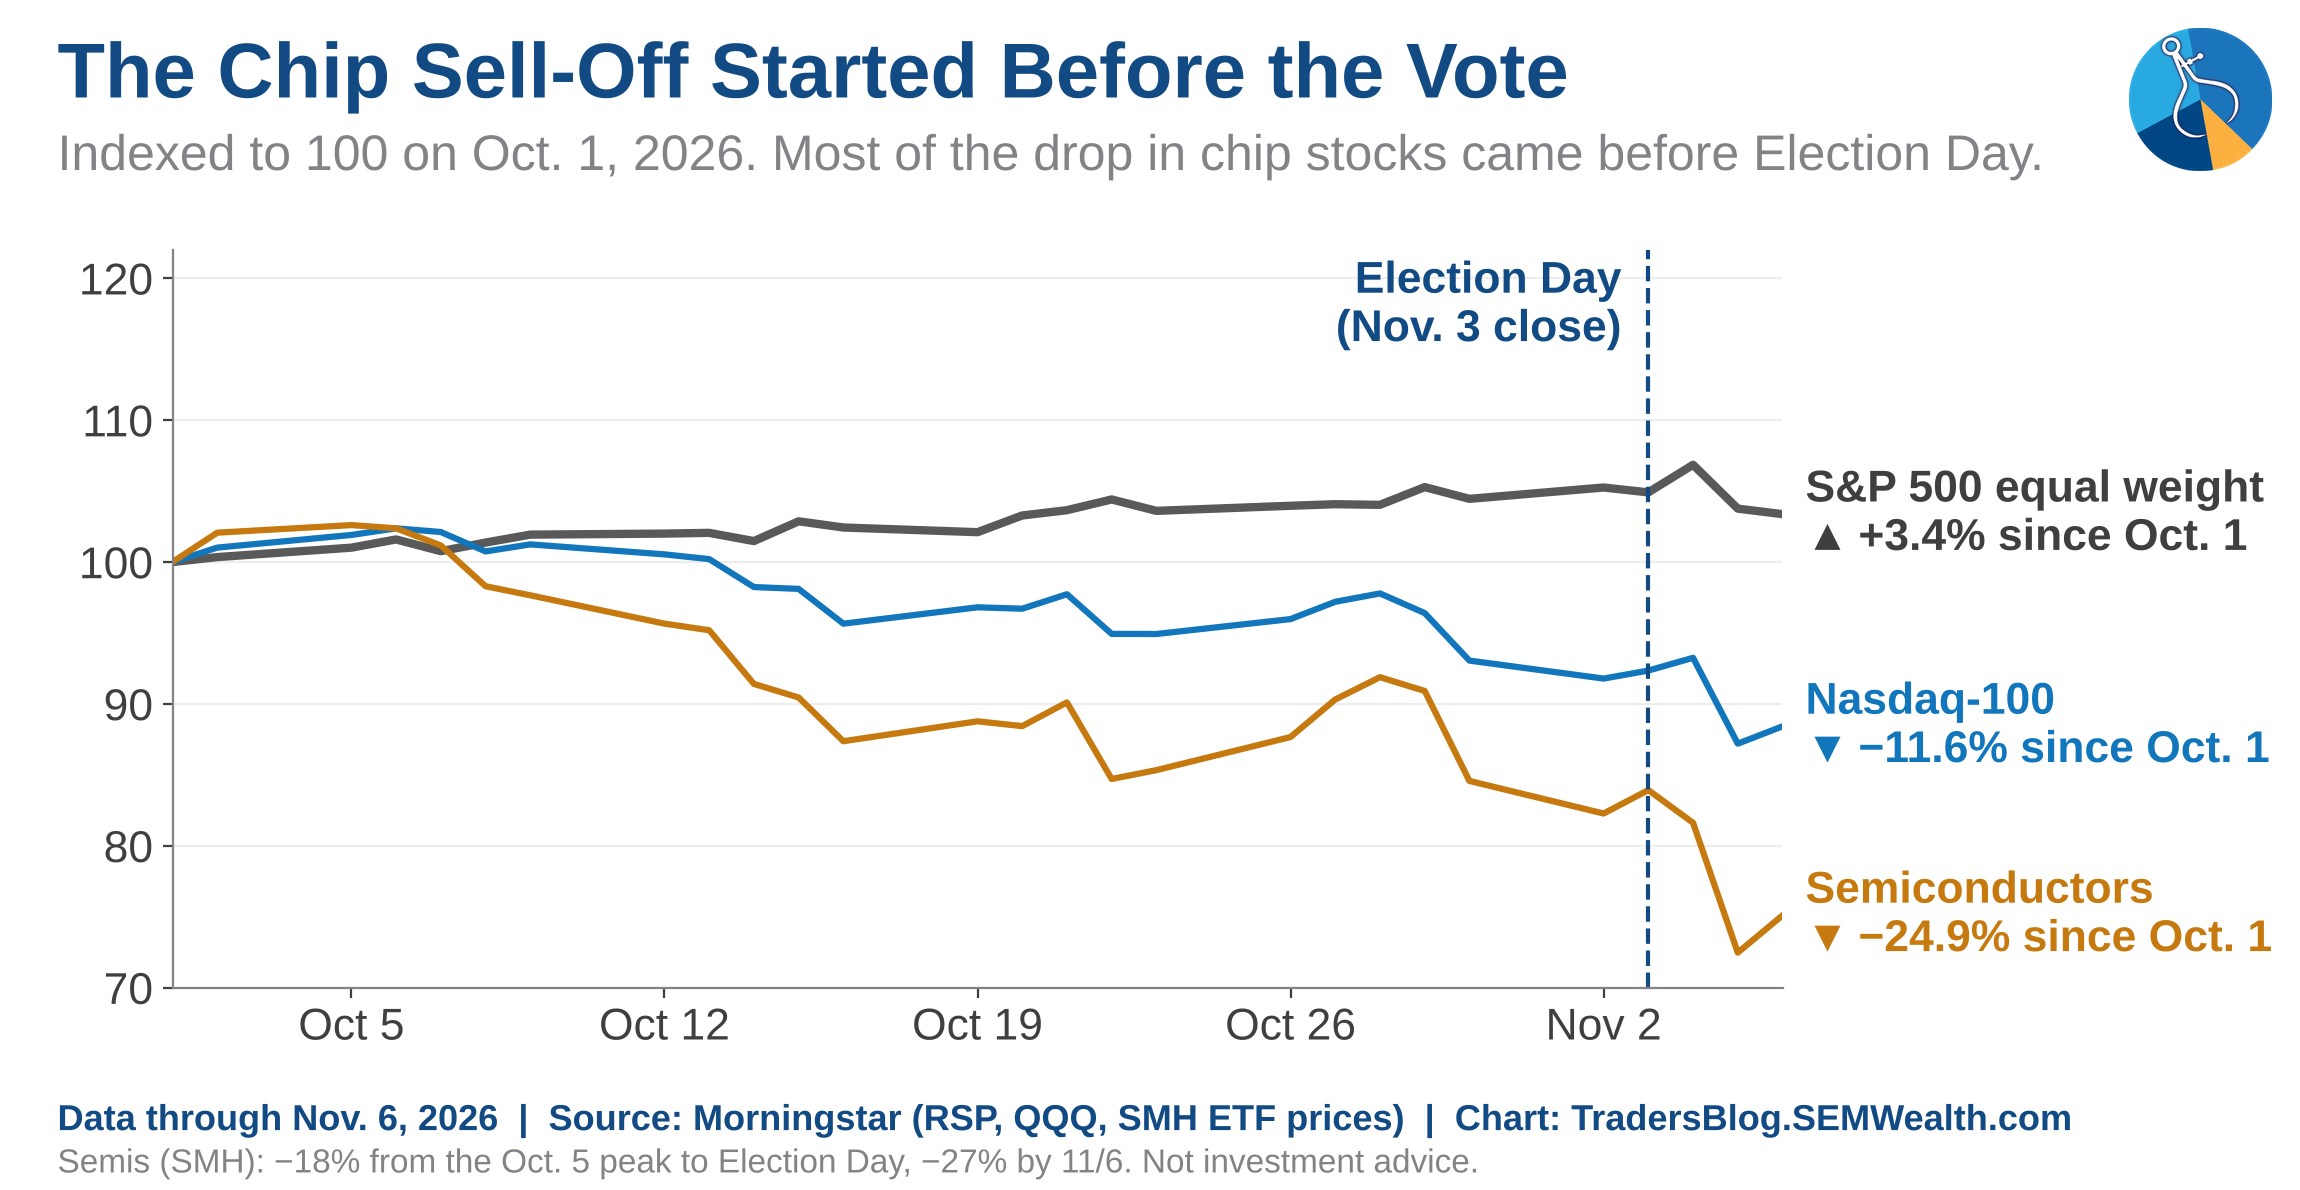
Remember Intel's 29% drop the Friday before the election, and the memory "squeeze" I wrote about last week. The selling also hit South Korea (down 6% Thursday) and Japan (the Nikkei is now in a bear market), and neither one votes on Texas data centers. The election was likely the spark, but the fuel was already there. (Also keep in mind, the market could have already been pricing some of this in -- Cody's pre-election post reminded us that all the polls showed a Democratic sweep.)
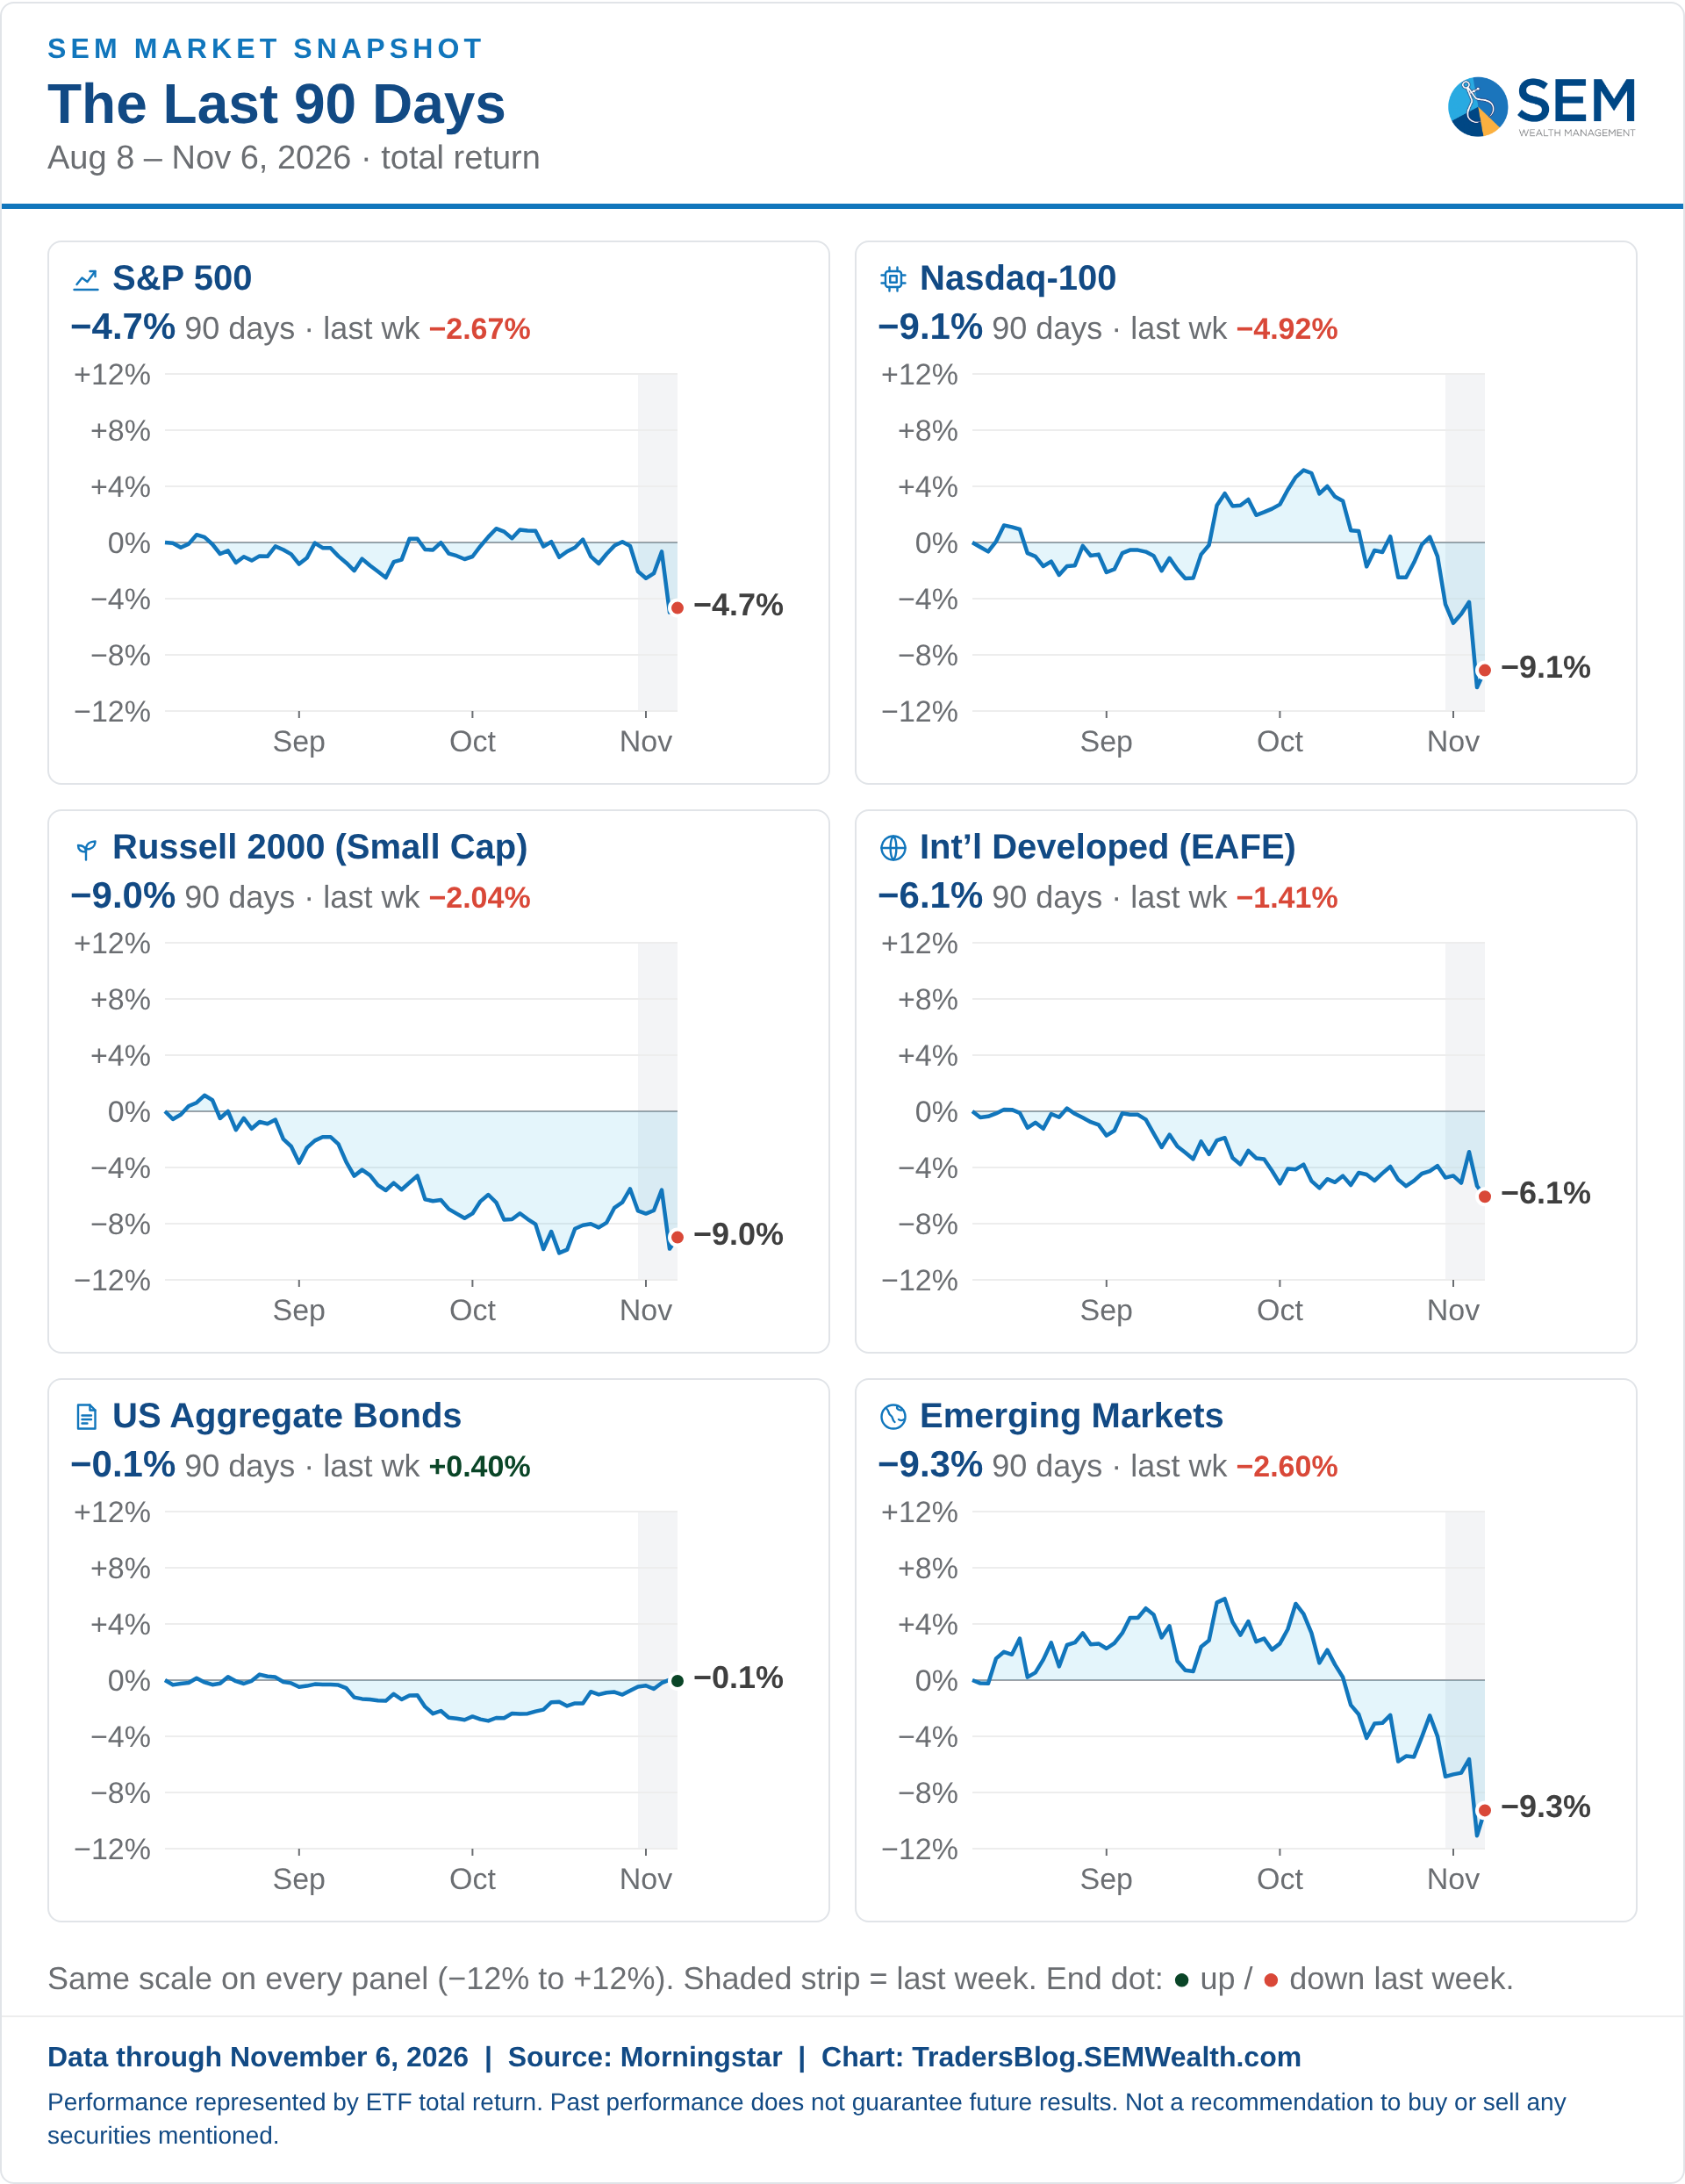
The good news for diversified investors is the average stock held up much better. For the week, the S&P 500 fell 2.7%, the Nasdaq-100 5.0% and semiconductors 11.2%, while the equal-weighted S&P 500 slipped only 1.0%. Since October 1st, the average stock is still UP 3.4%, while the Nasdaq-100 is down almost 12%. Just like in October, the fear (for now) is in the leaders, not the average stock.
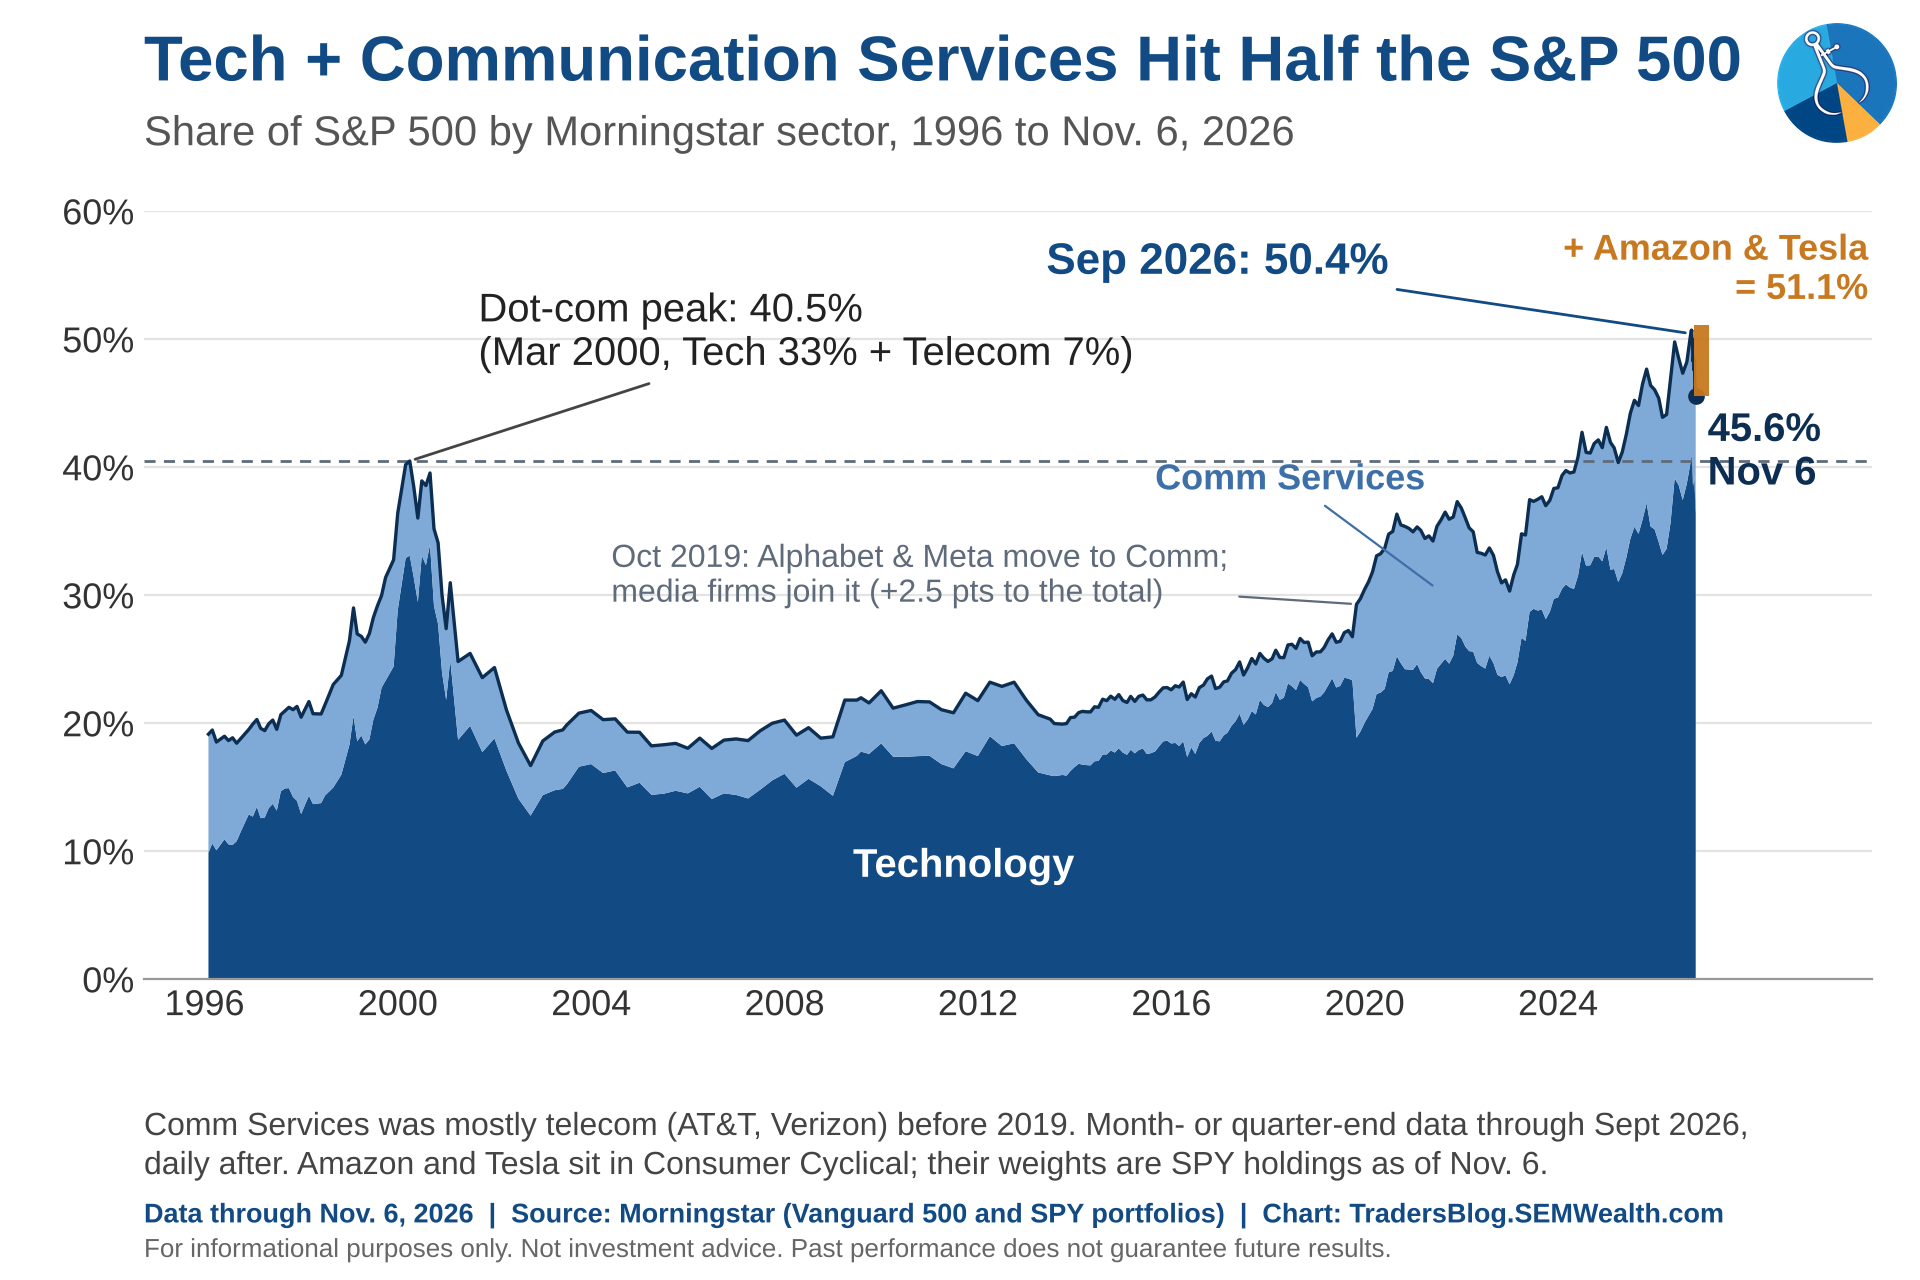
The problem, of course is not everyone is fully diversified. We've been lamenting for several years now about the overweight position investors have if they own S&P 500 index funds. Obviously, those overweight positions have been fantastic and selling them 2 years ago for an "equal-weight" portfolio would have left lots of money on the table. However, investors should at least be aware that the tech-overweight positions that drove spectacular returns the last several years, could be at risk if earnings growth slows due to the opposition to data centers across the country.
The chicken-or-egg question matters because it can run the other way. AI spending has been a big part of business investment, and a lot of construction and electrical jobs depend on it. If the buildout really does slow, that could eventually show up in hiring, GDP and earnings. We aren't seeing it yet (see #5 below), but it's something we'll be watching.
4.) Oil had its biggest weekly drop since COVID
Possibly lost in all of the AI headlines was oil. Brent crude finished the week at $98.32 after a steep weekly decline, and energy stocks fell 12%. Brent fell sharply Wednesday as traders bet that the election results made an earlier end to the Iran war more likely. Thursday's tanker attacks in the Gulf pushed it back up 4%, which tells you the risk hasn't gone away.
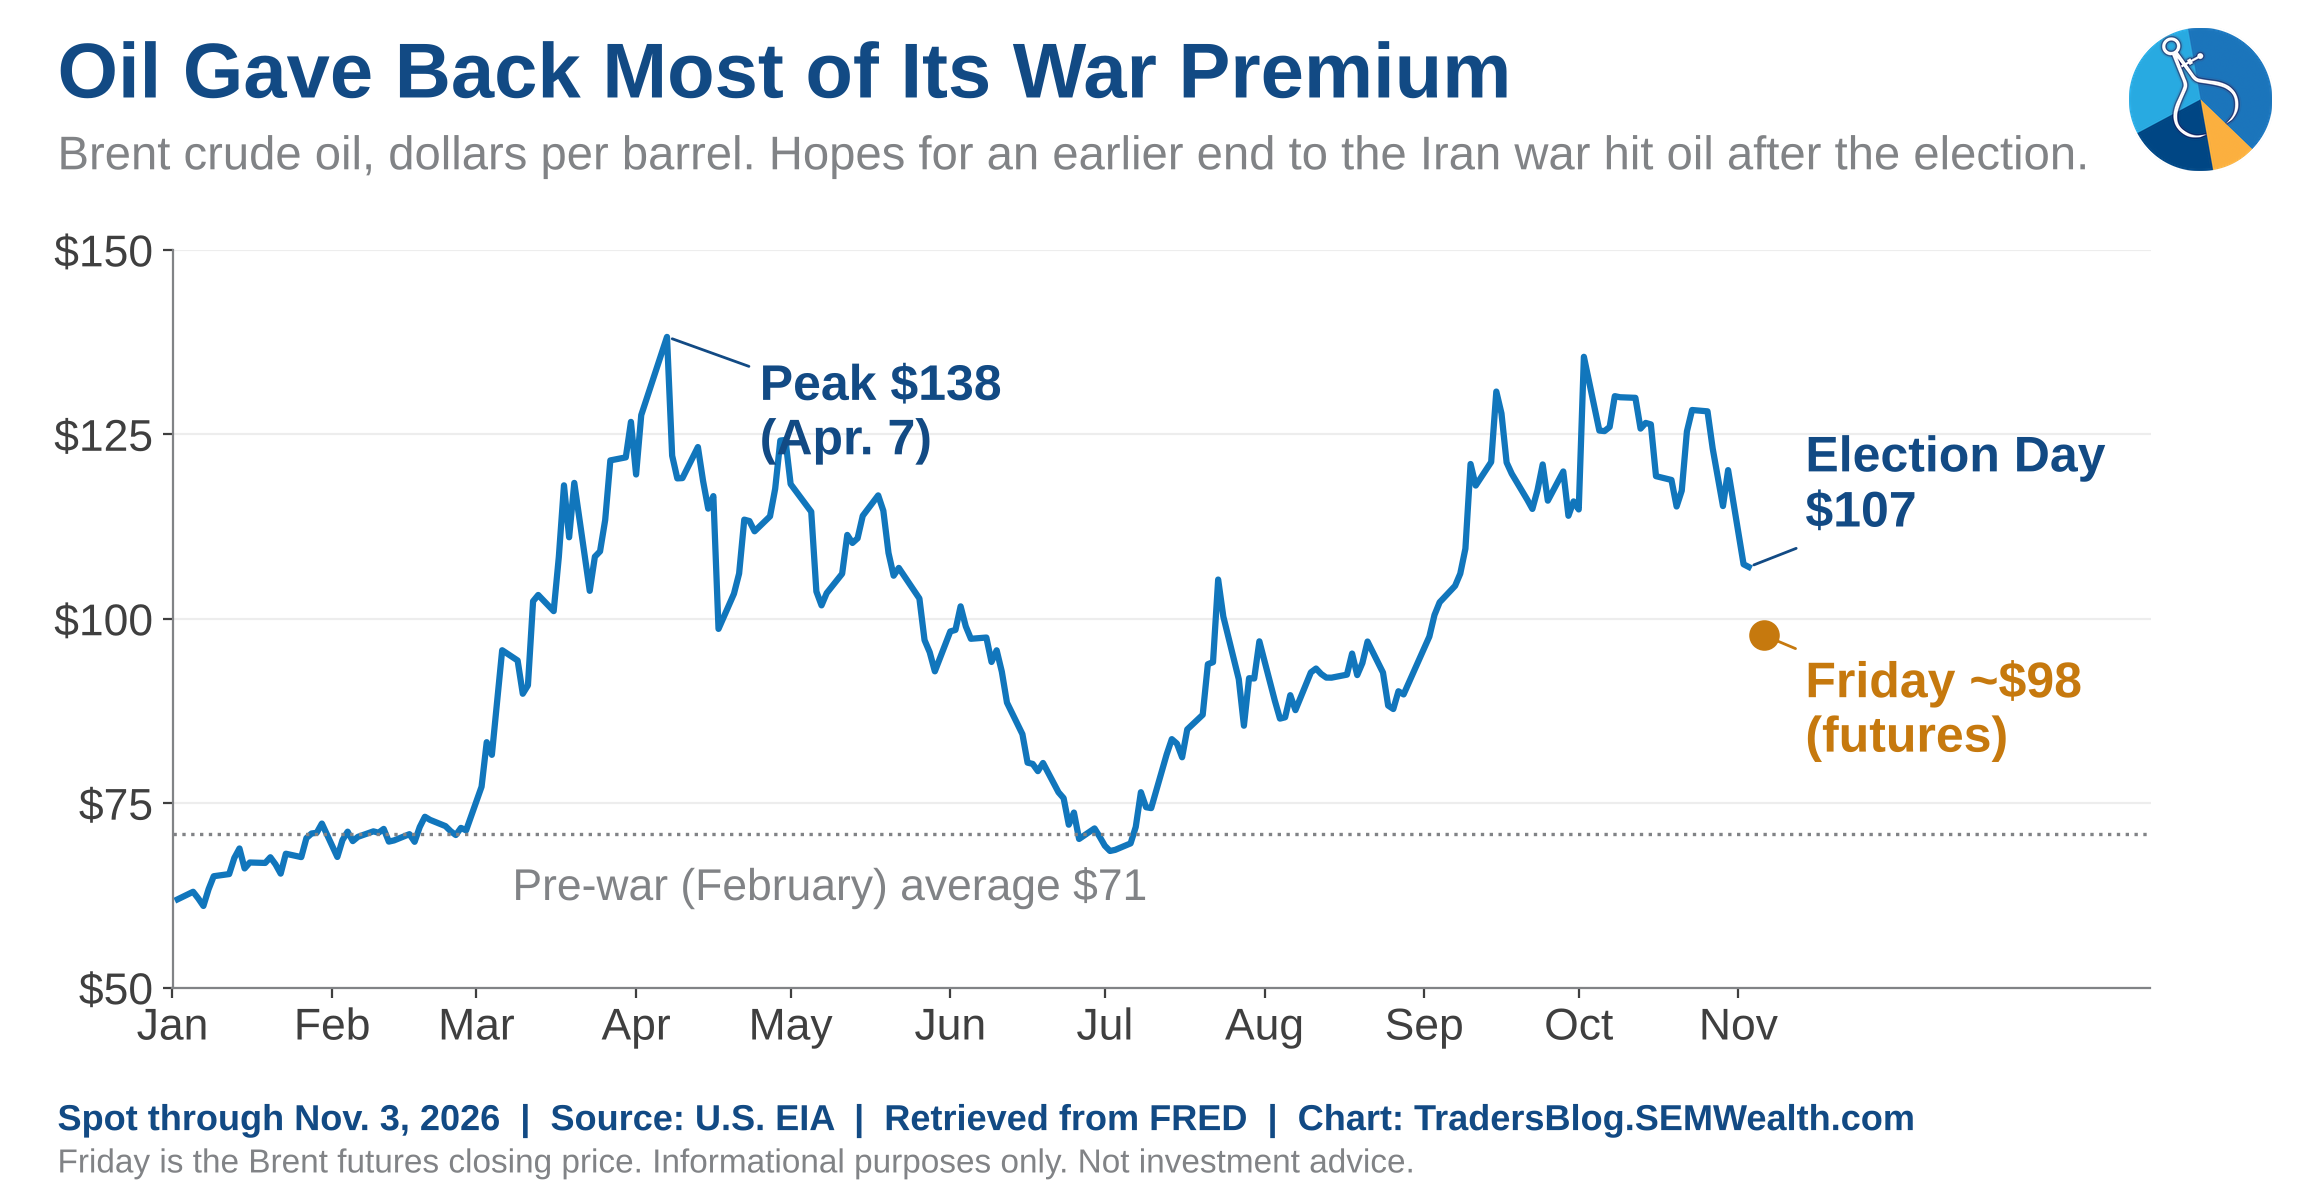
I need to own something here. Last week I wrote that "the upside risk is an escalation with Iran after the election." So far the opposite has happened. Brent is now around $98, compared with roughly $71 before the war started and a peak of $138 in April, so oil has given back most (but not all) of its war premium.
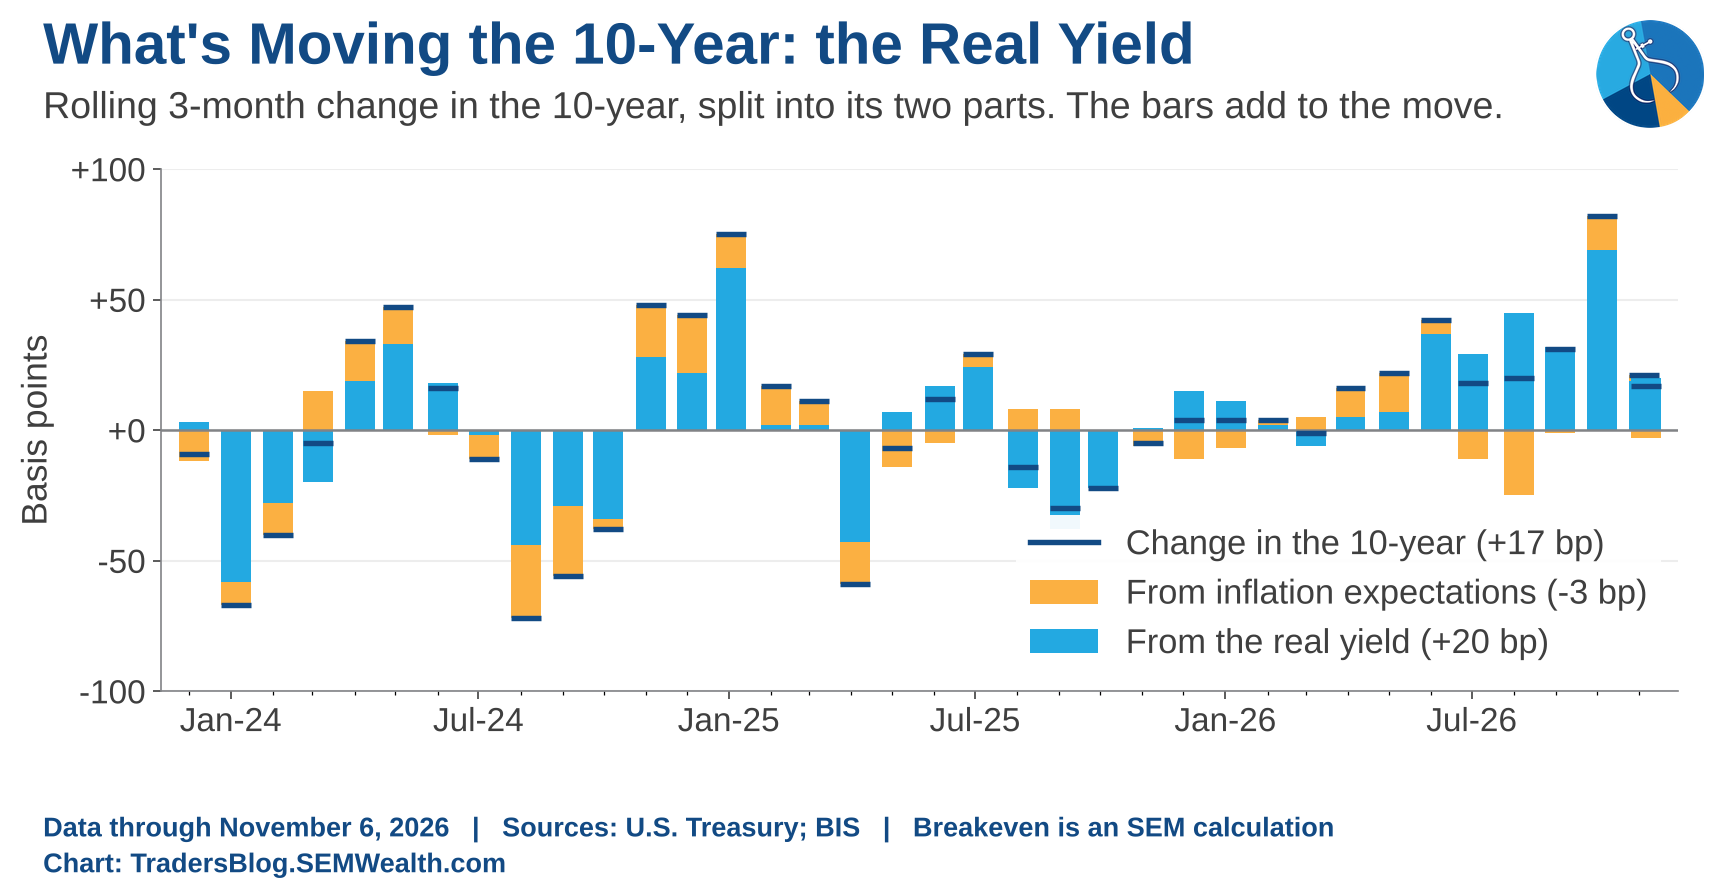
This matters for inflation, because as I said last week, energy was up 20% from a year ago, and that's an oil supply shock short-term interest rates can't fix. The bond market noticed – the 10-year breakeven inflation rate fell from 2.34% to 2.23% this week, and that's what pulled the 10-year Treasury yield down from 4.94% to 4.86% (the real yield barely moved). If oil holds here, headline inflation should start cooling over the next few months, but that's a big "if" with tankers still being hit.
5.) Jobs came in hot
The October jobs report was much stronger than expected. The economy added 165,000 jobs (economists expected about 60,000), and August and September were revised UP a combined 84,000. Over the last three months hiring averaged about 137,000 jobs per month, which is above our 0 to 90,000 "breakeven" band (the number of jobs needed just to keep the unemployment rate steady) for the first time in a while.
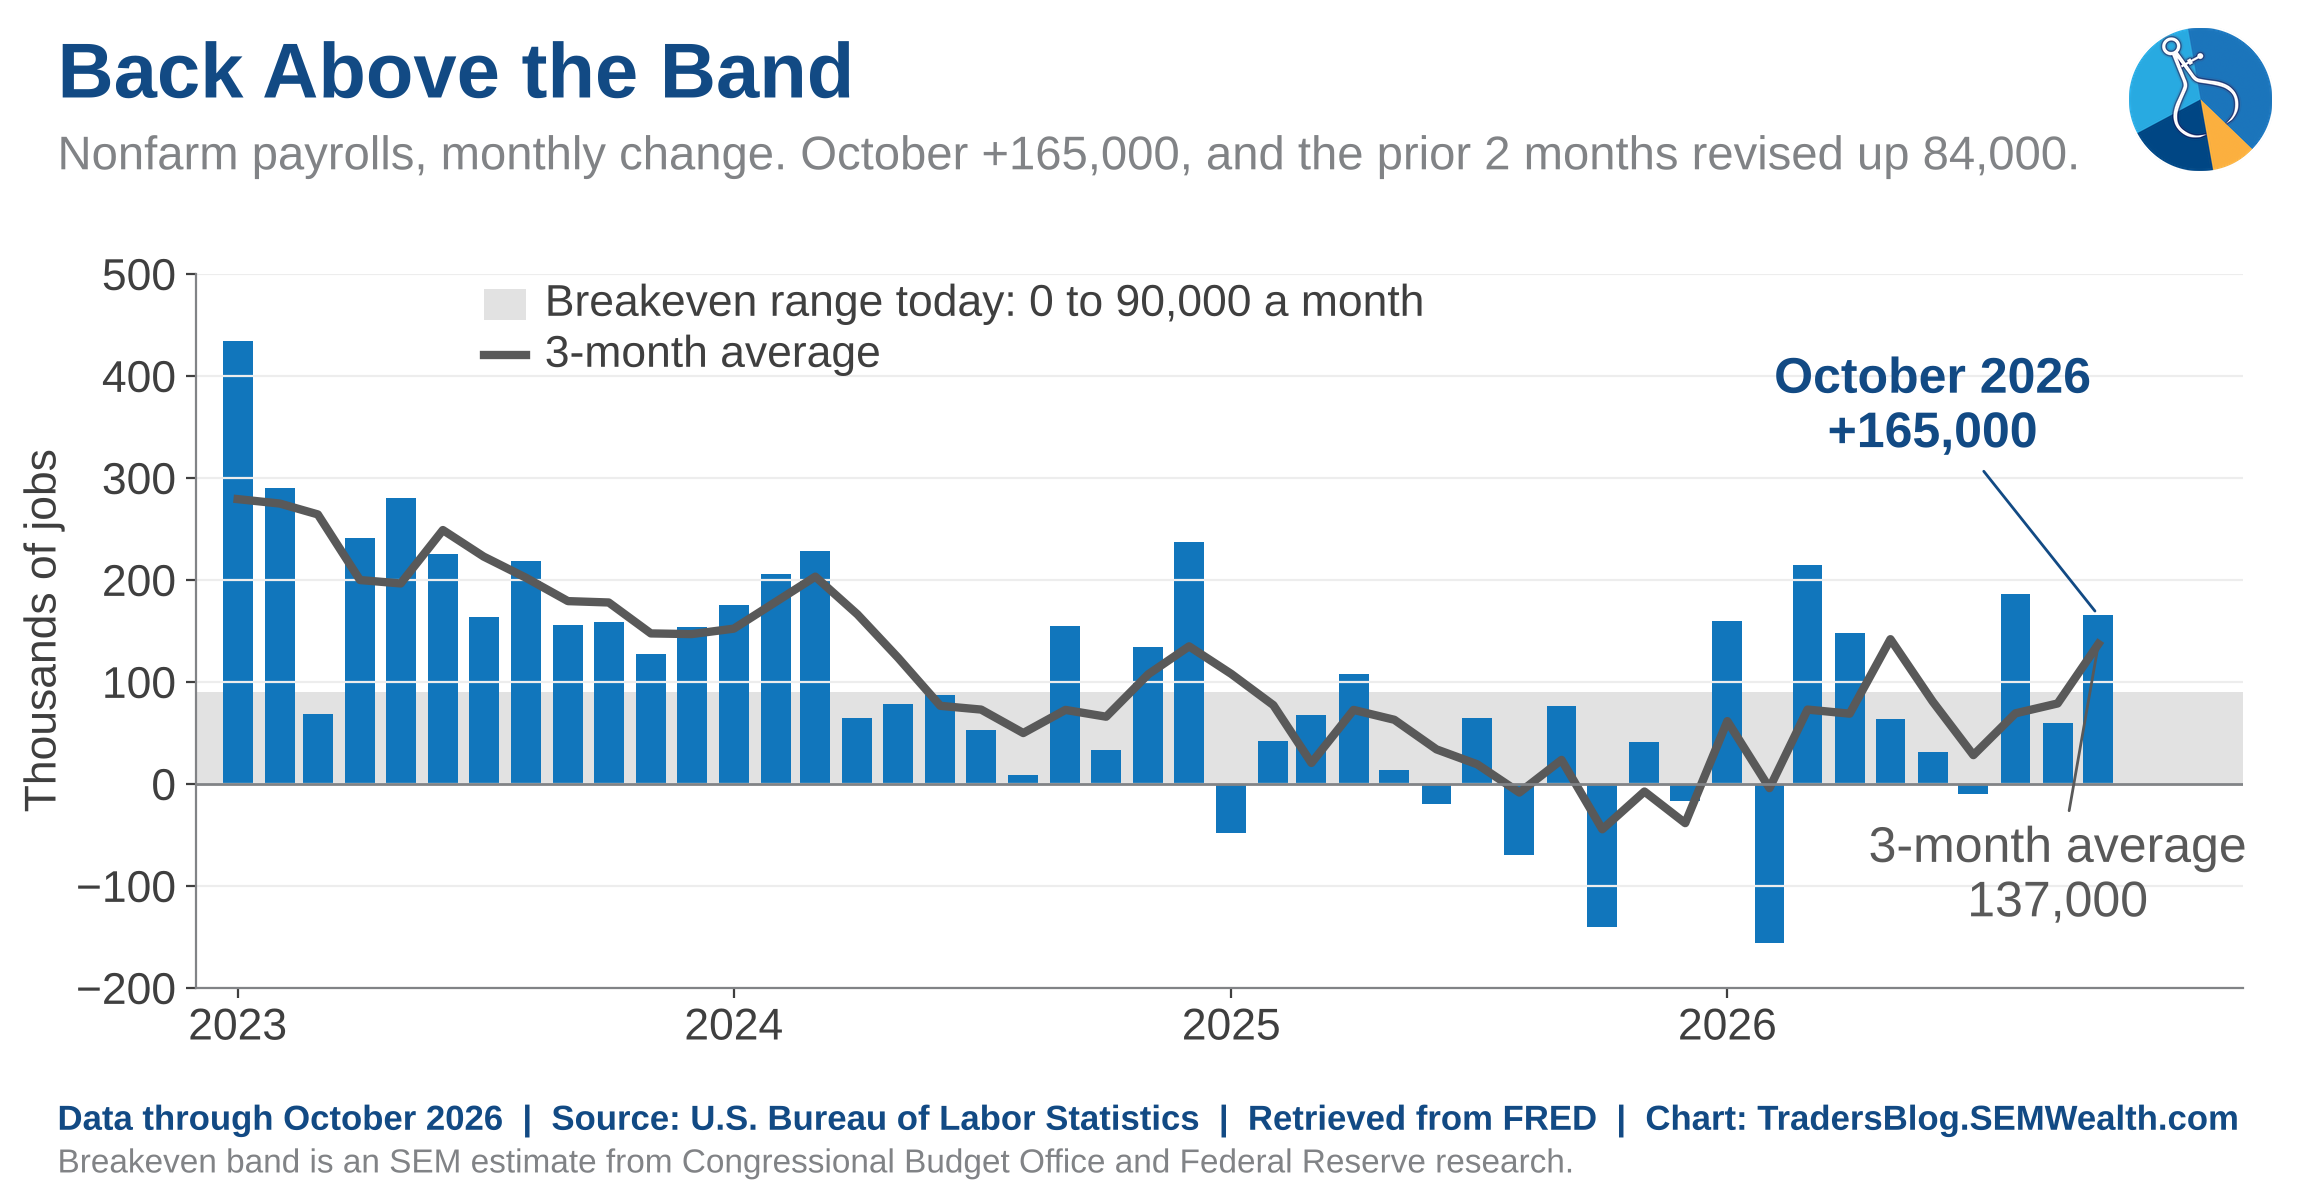
Back in September I said one good jobs report isn't a trend, but if the next two looked like August, the "economy is cooling so the Fed can't raise rates" argument would lose its evidence. September looked cool when it was first reported (it has since been revised up from 29,000 to 60,000) and October looked a lot like August. Hours worked didn't budge (34.4) for a third straight month, which is the piece that keeps me from calling it a "strong" job market. One hot month also doesn't change the bigger picture much – payrolls are only up about 0.6% over the last 12 months, and the jobs piece of our economic model still points to growth just under 2% (see #6 below).
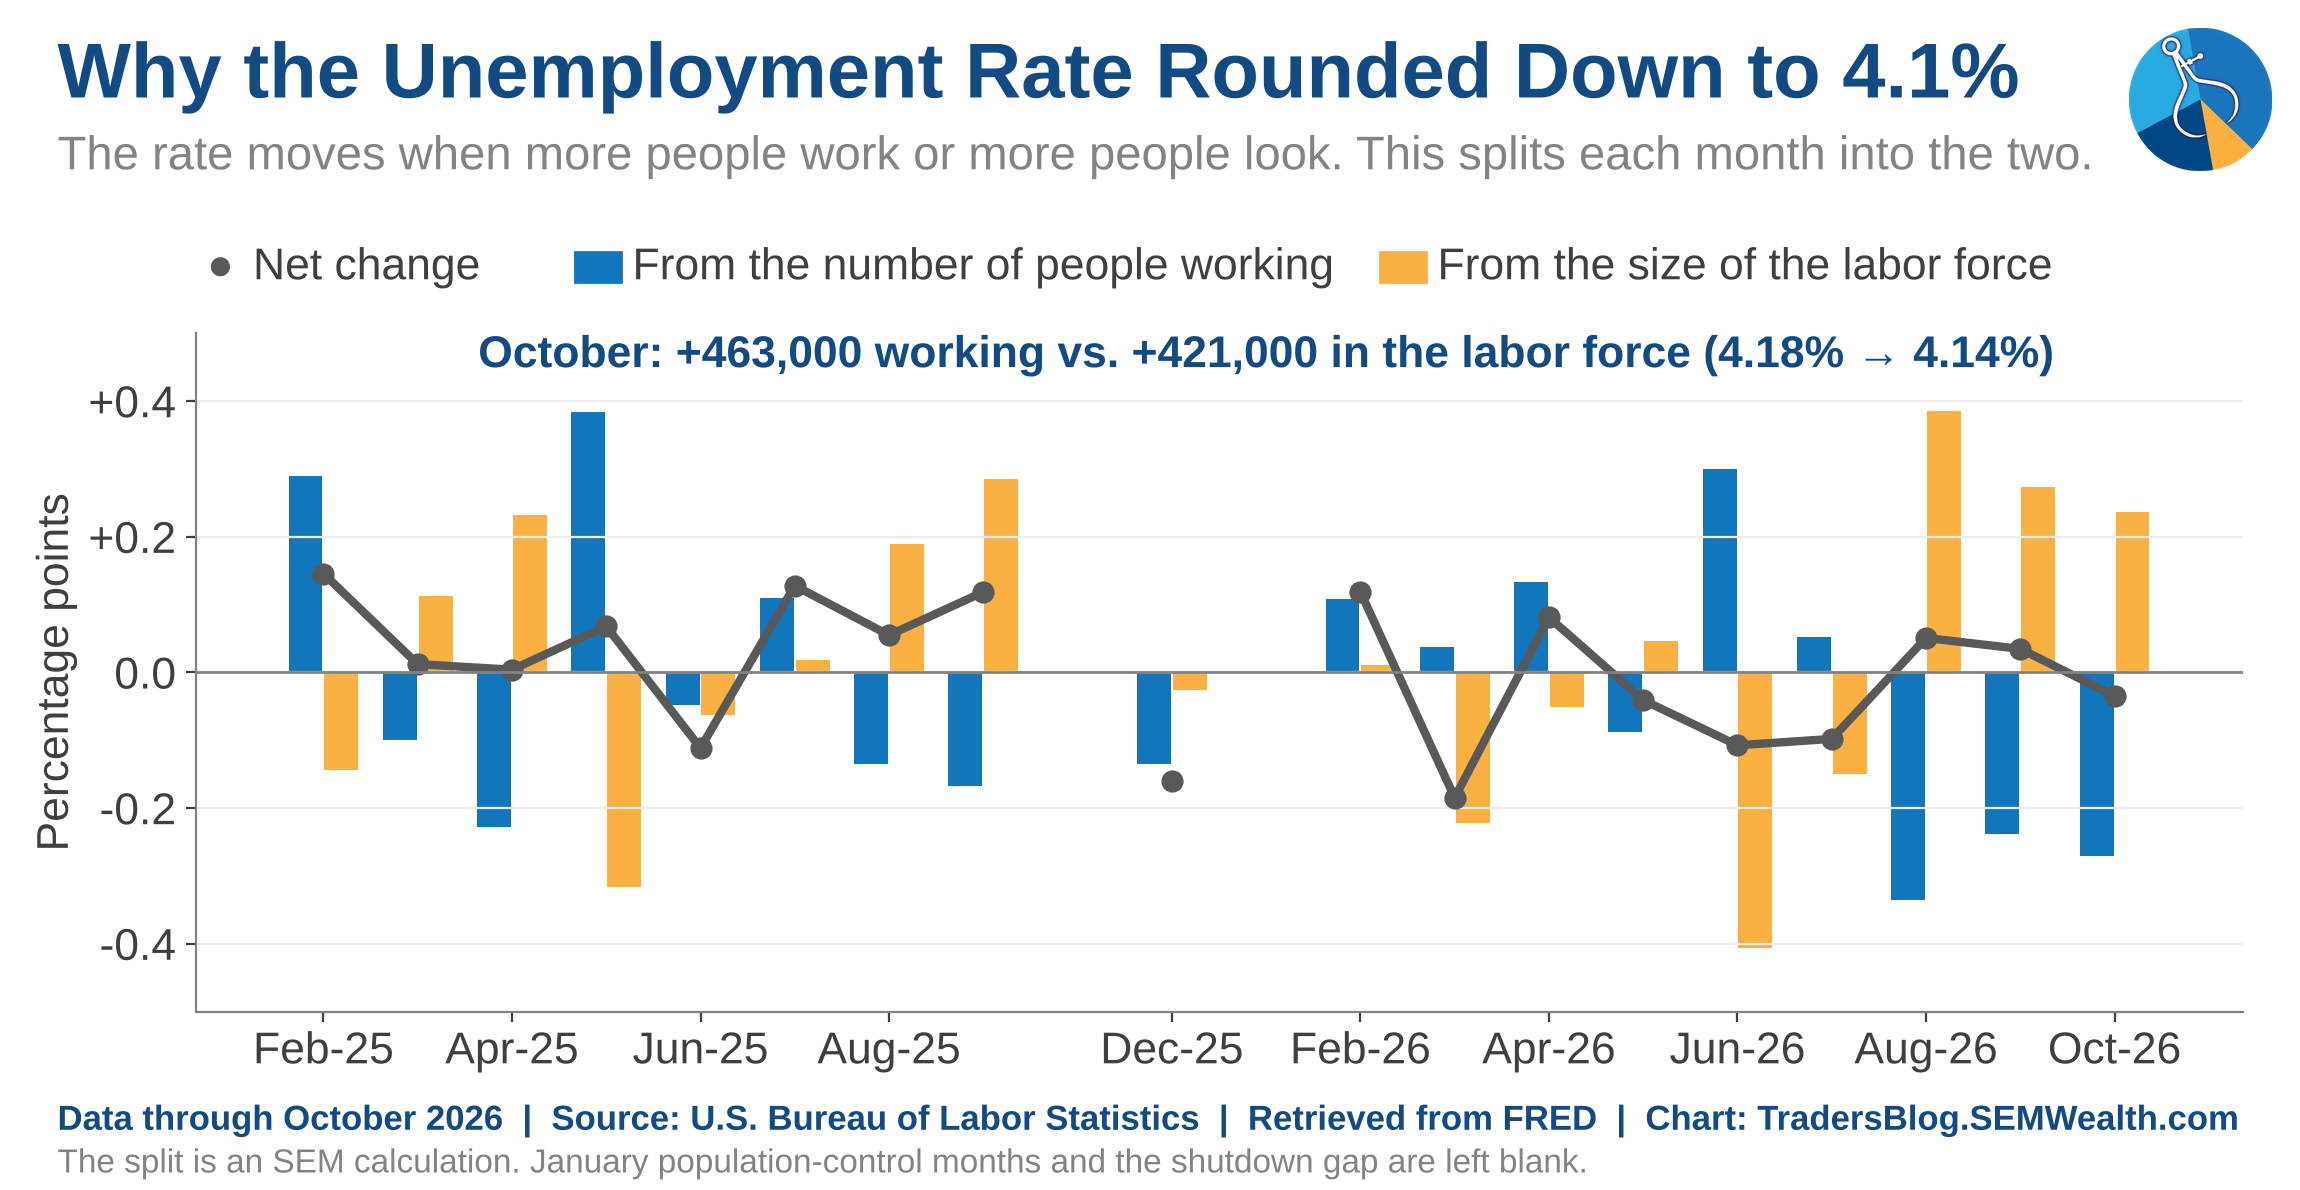
The unemployment rate rounded down to 4.1%, and this time the reason is good news. More people found jobs (+463,000) than joined the labor force (+421,000). Before anyone gets too excited, the unrounded rate only moved from 4.18% to 4.14%, and the number of people working part-time because they couldn't find full-time work jumped by 339,000.
Wages grew 3.1% over the past year, which is still BELOW the 3.65% inflation rate from the September PCE report, so the typical worker's paycheck is losing ground. For the Fed, a hot jobs report is the type of "good news" that's actually "bad news." Futures still put the odds of a December rate hike somewhere between 65% and 78%, about where they were before the report.
6.) Our economic model is still at 2.1%, but the cycle crossed the "strong" line
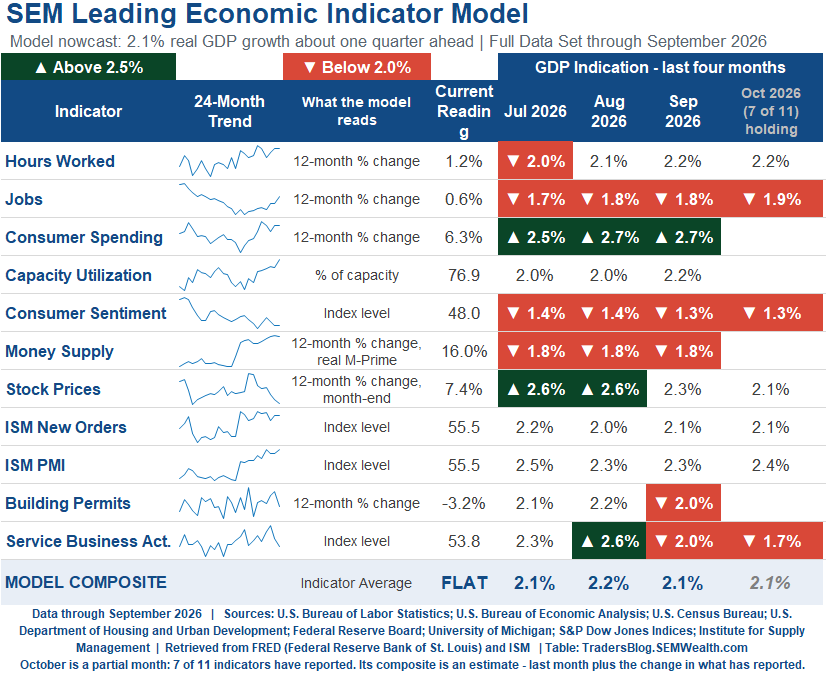
Our economic model's early read for October has the economy growing at a 2.1% pace over the last 12 months, unchanged from September. As I explained last week, if that holds, the Q4 GDP number coming out in late January could print close to zero (around 0.3%).
Our Cycle Position for September was revised UP from 58.8% to 61.5%, which puts it above the 60% "strong" line for the first time since January 2023. August was also revised up (from 55.6% to 56.3%). The upward revisions to the jobs data were the reason. The government revised August and September payrolls up by a combined 84,000, which raised total hours worked across the economy enough to move the hours piece of our model from 0.9% growth over 12 months to 1.2%. None of the other four pieces changed.
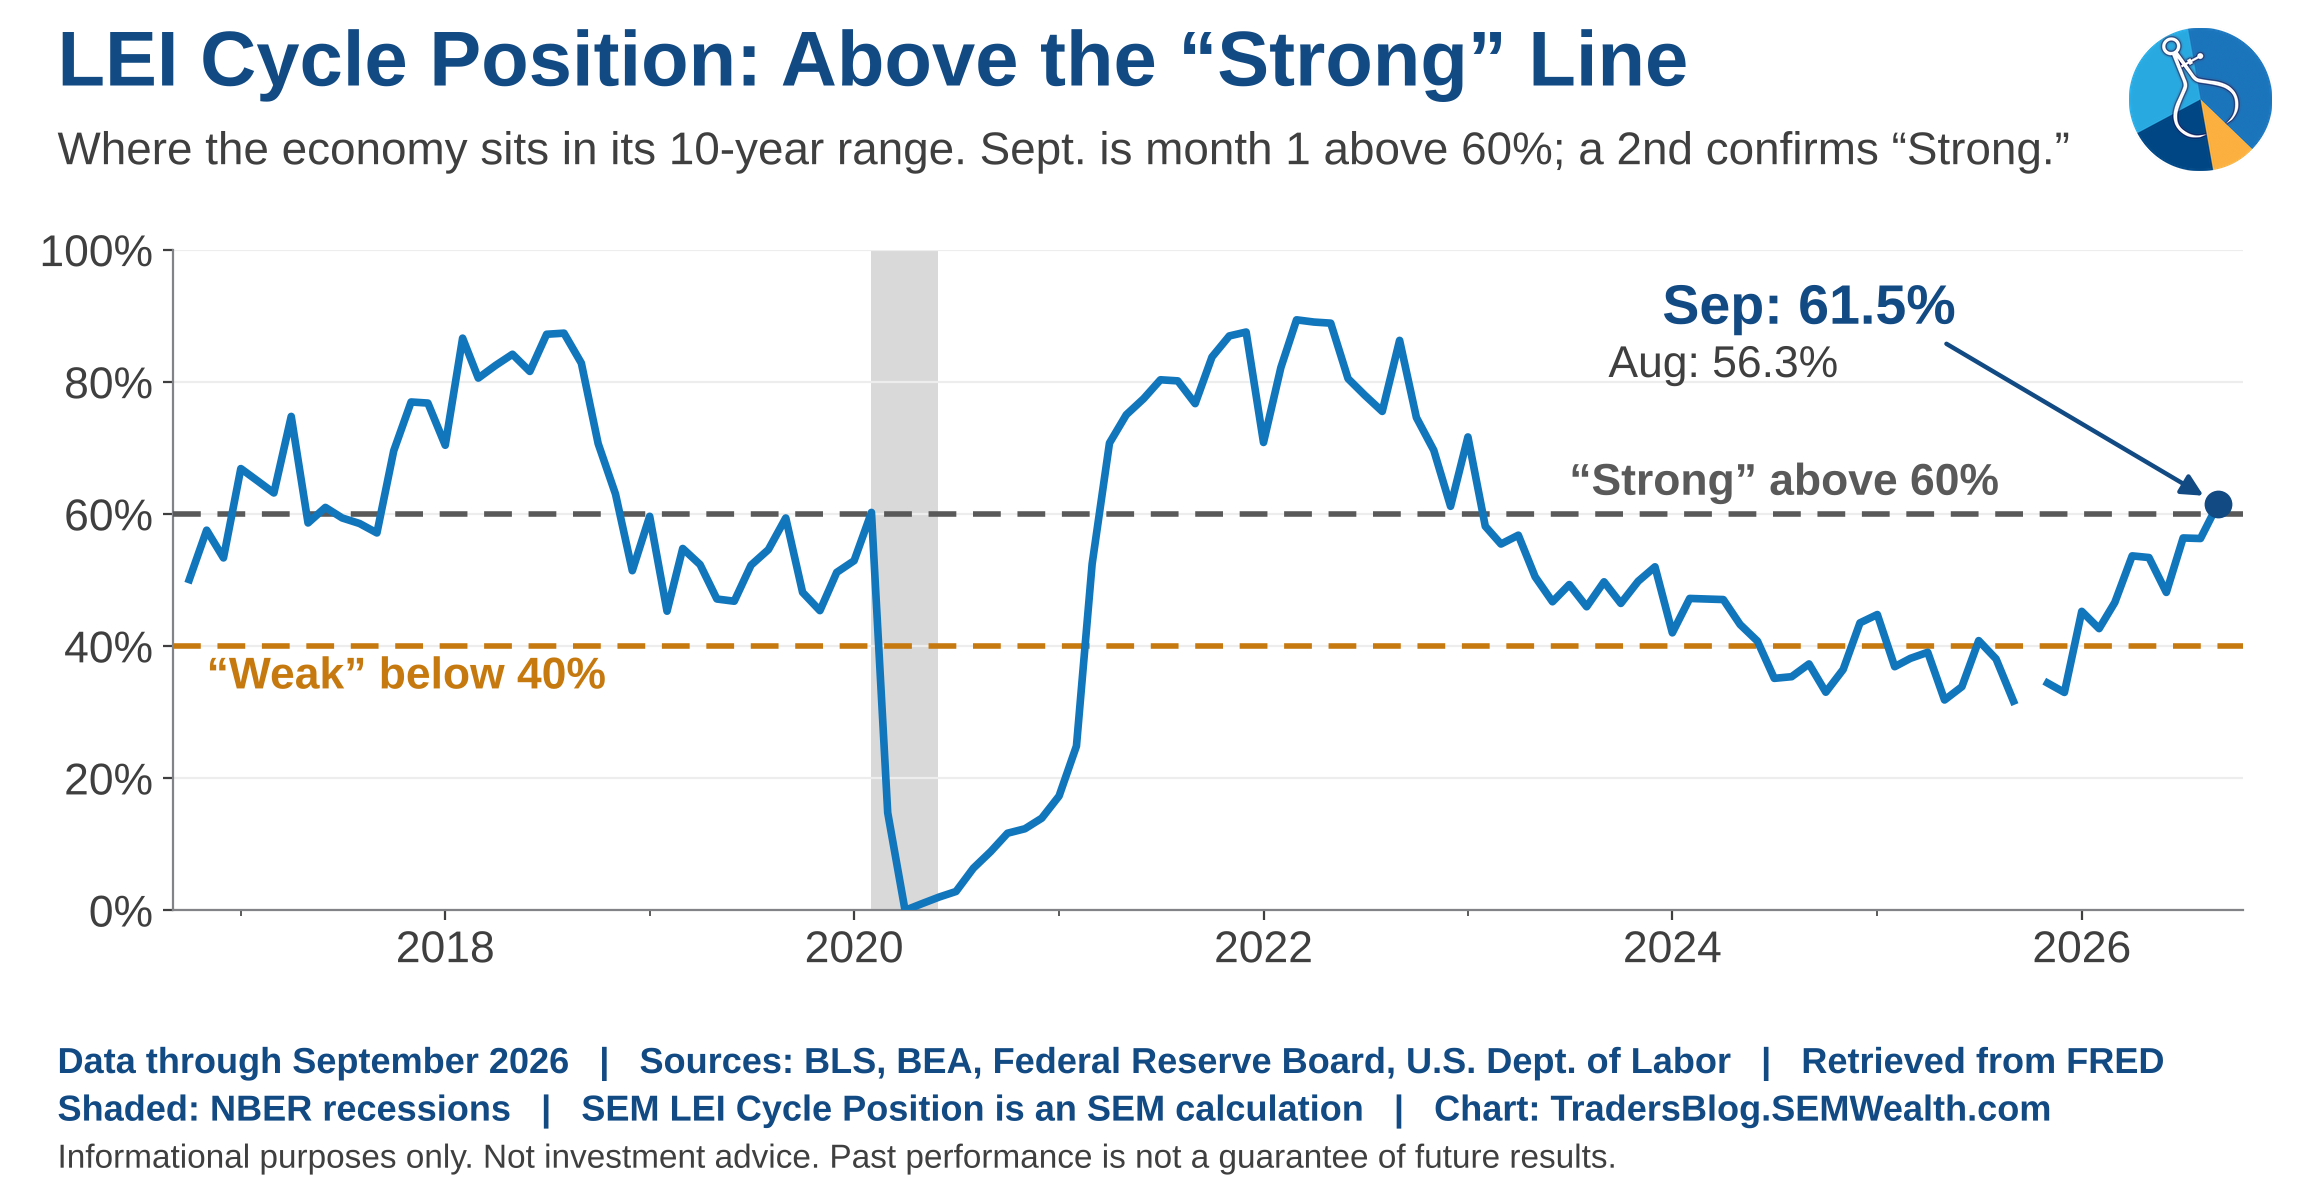
As I said last week, "strong" in our models means a MATURE cycle. It takes two months in a row above 60% to confirm, and September is month one. The October pieces we have so far (hours worked, unemployment and jobless claims) are holding, so if consumer spending and factory use also hold steady, October would likely be the second month. We won't know until that data is in later this month, and even if it confirms, we'll wait for the December jobs report to make sure there aren't any other revisions or downgrades before we act.
If it holds, it would take small caps to zero in our Dynamic Aggressive Growth allocation. That's less risk, not more, and I want you to hear it from us before it happens.
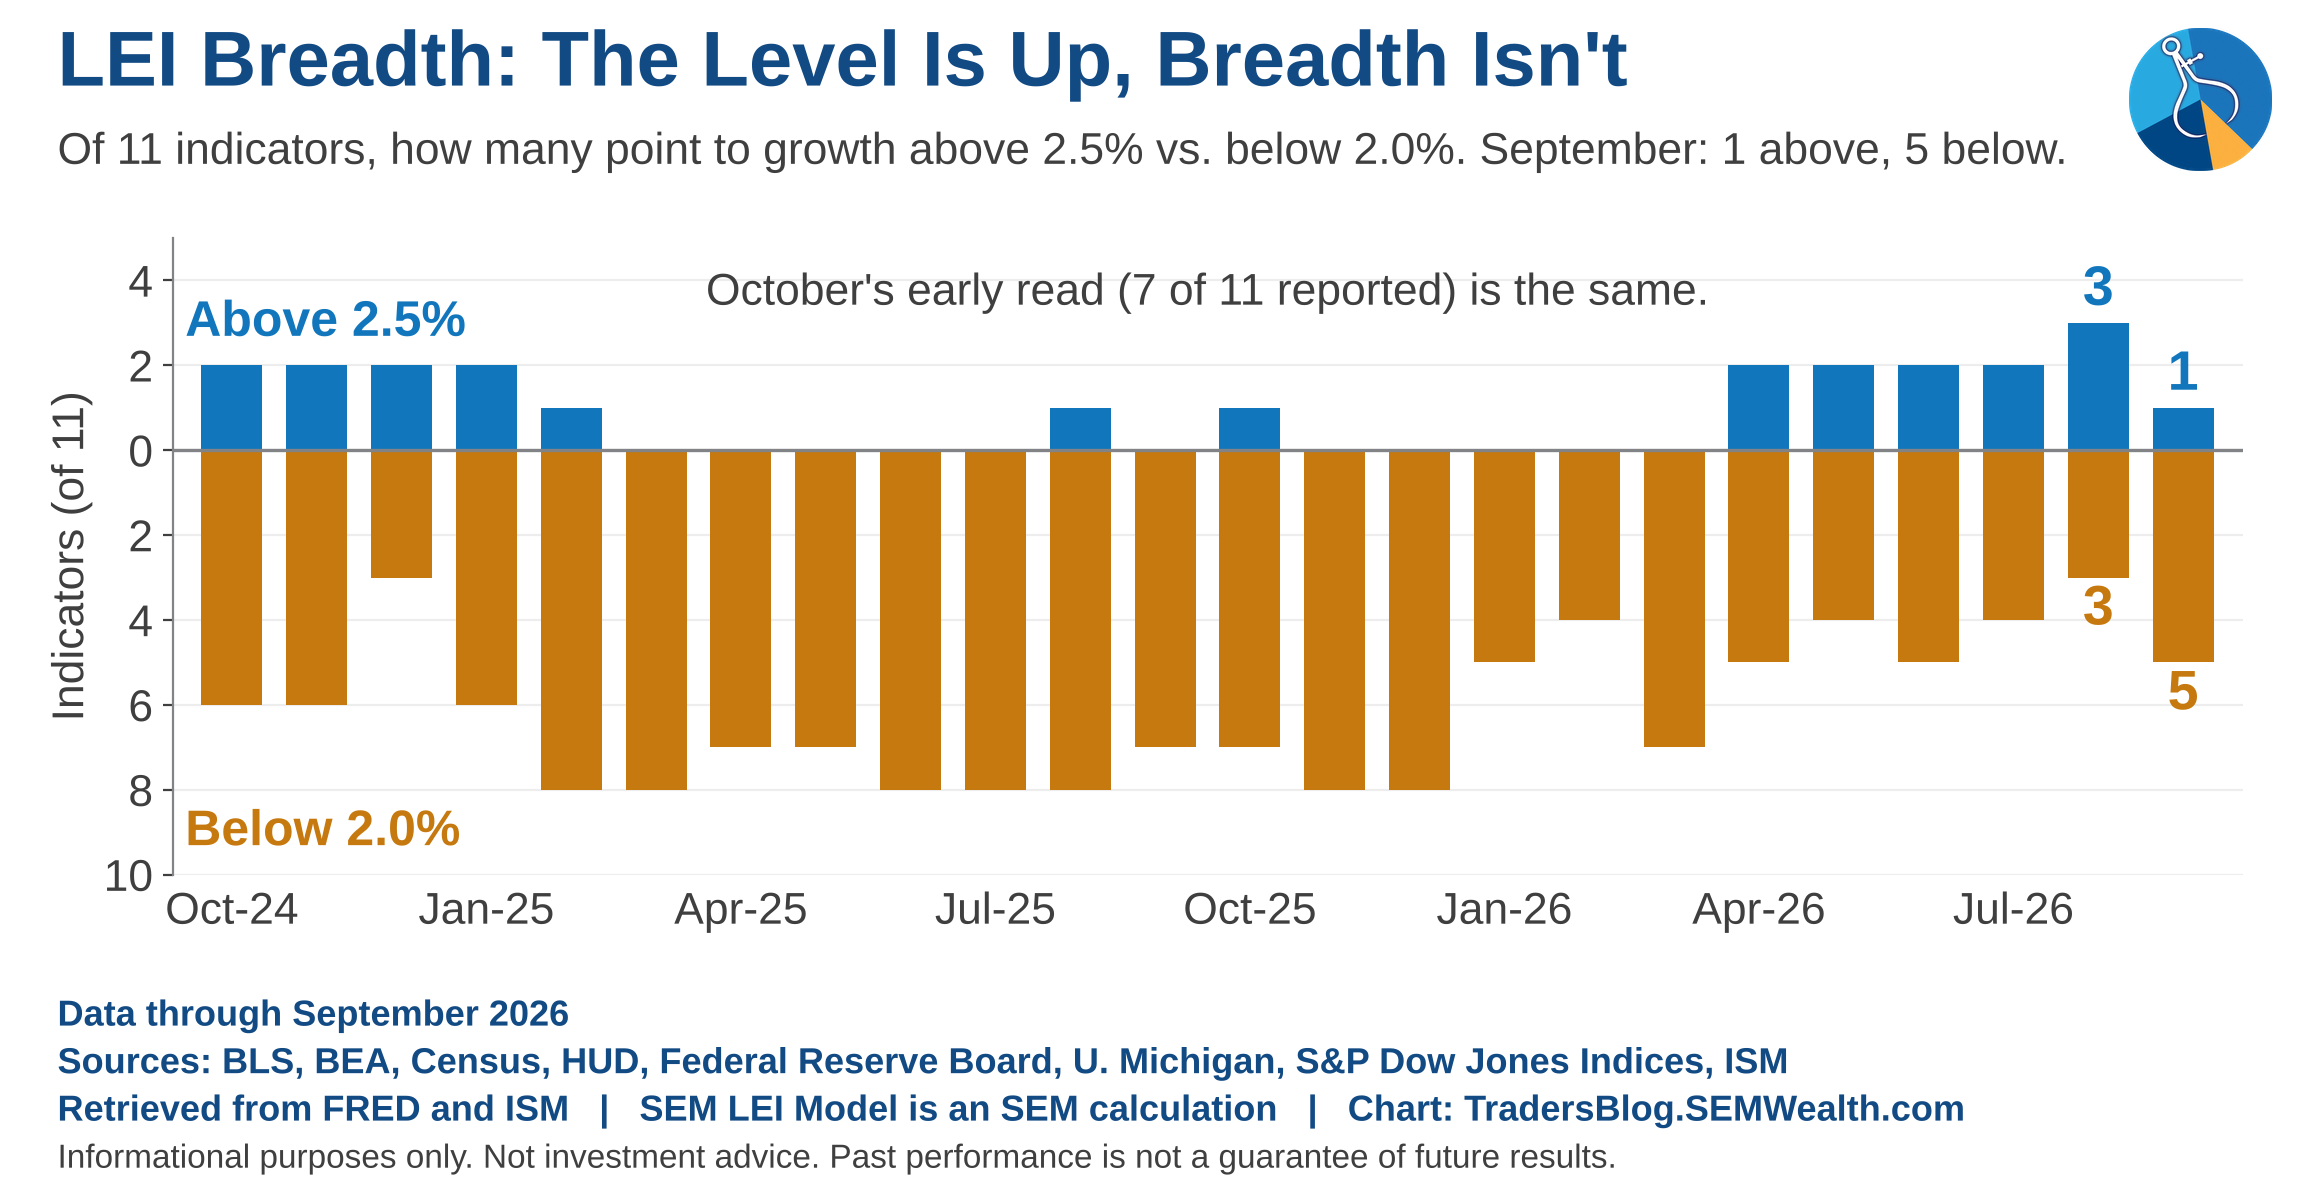
Breadth is still weak, though, with only 1 of our 11 indicators above 2.5% and 5 below 2.0%, the same as September. The level is rising because the cycle has gone on so long, not because more of the economy is accelerating.
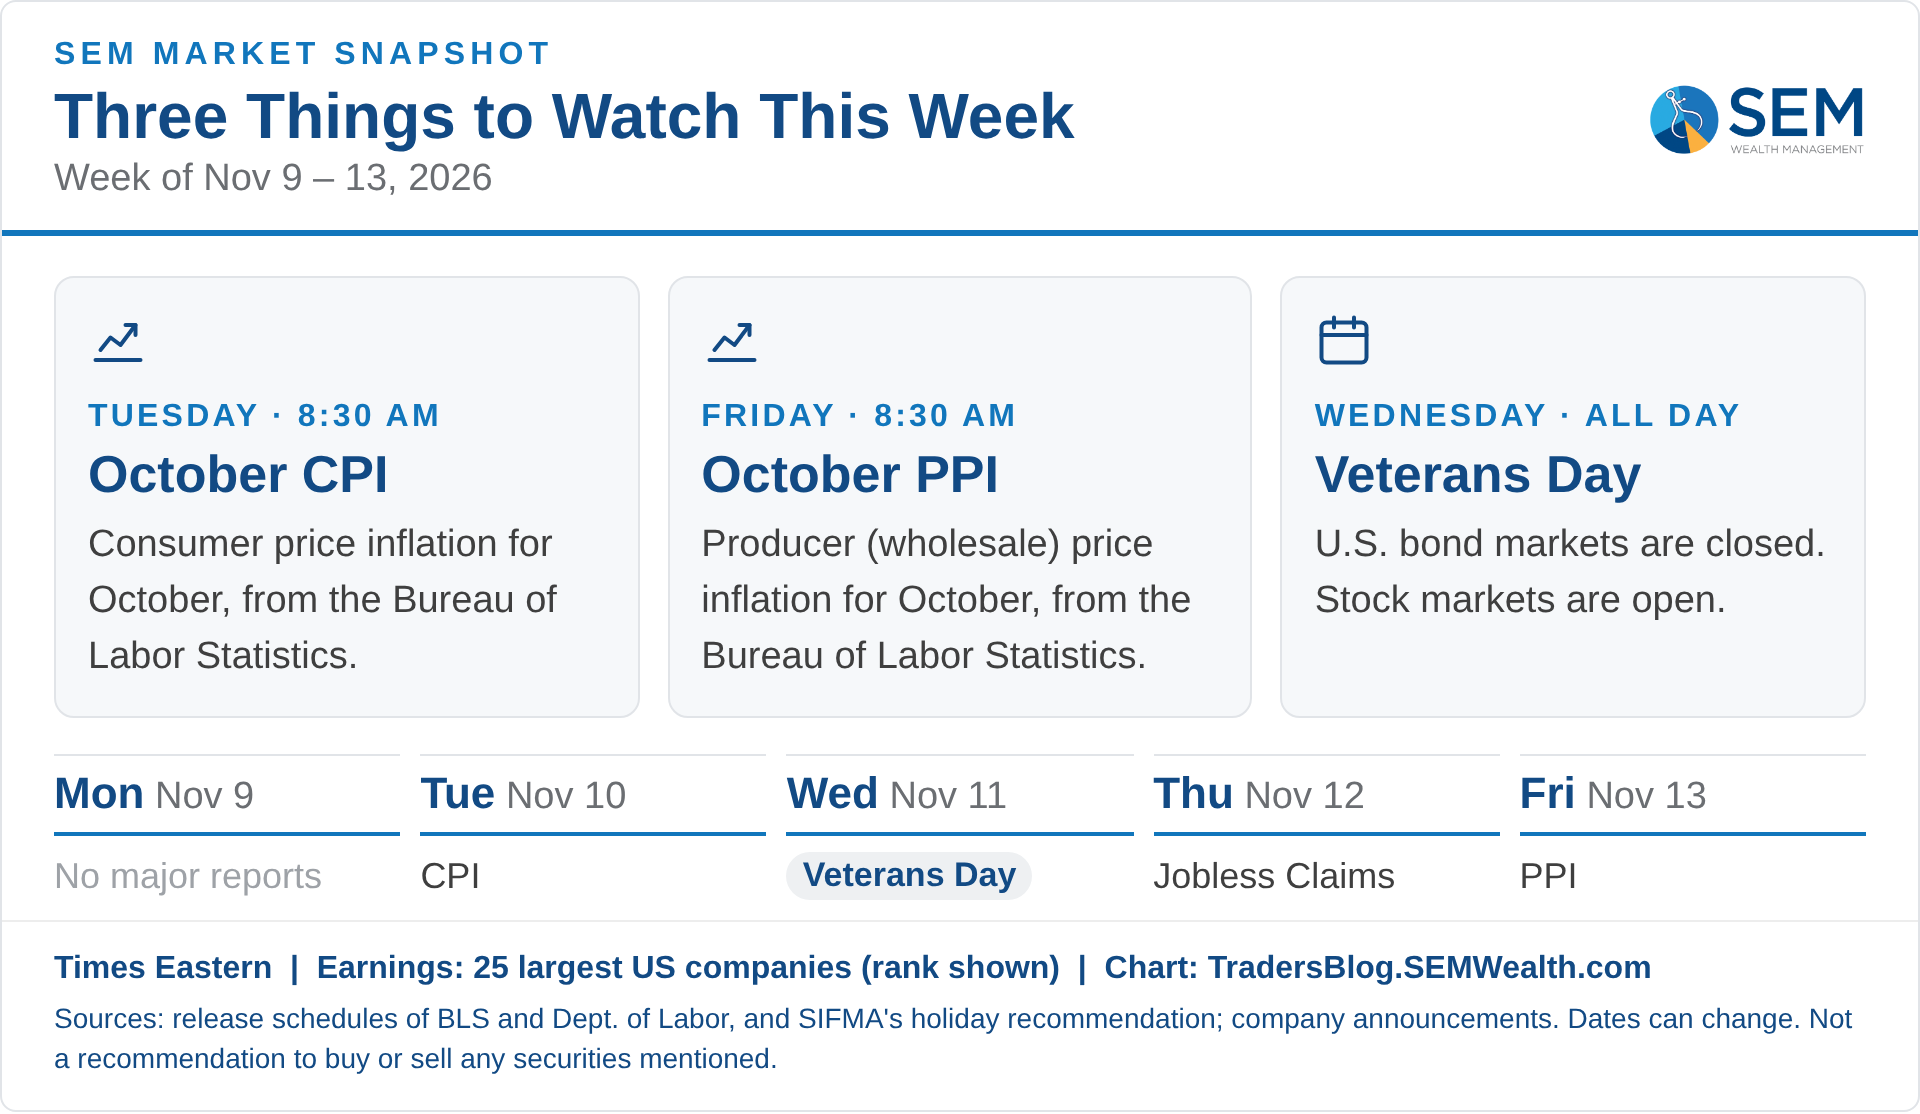
What We're Watching
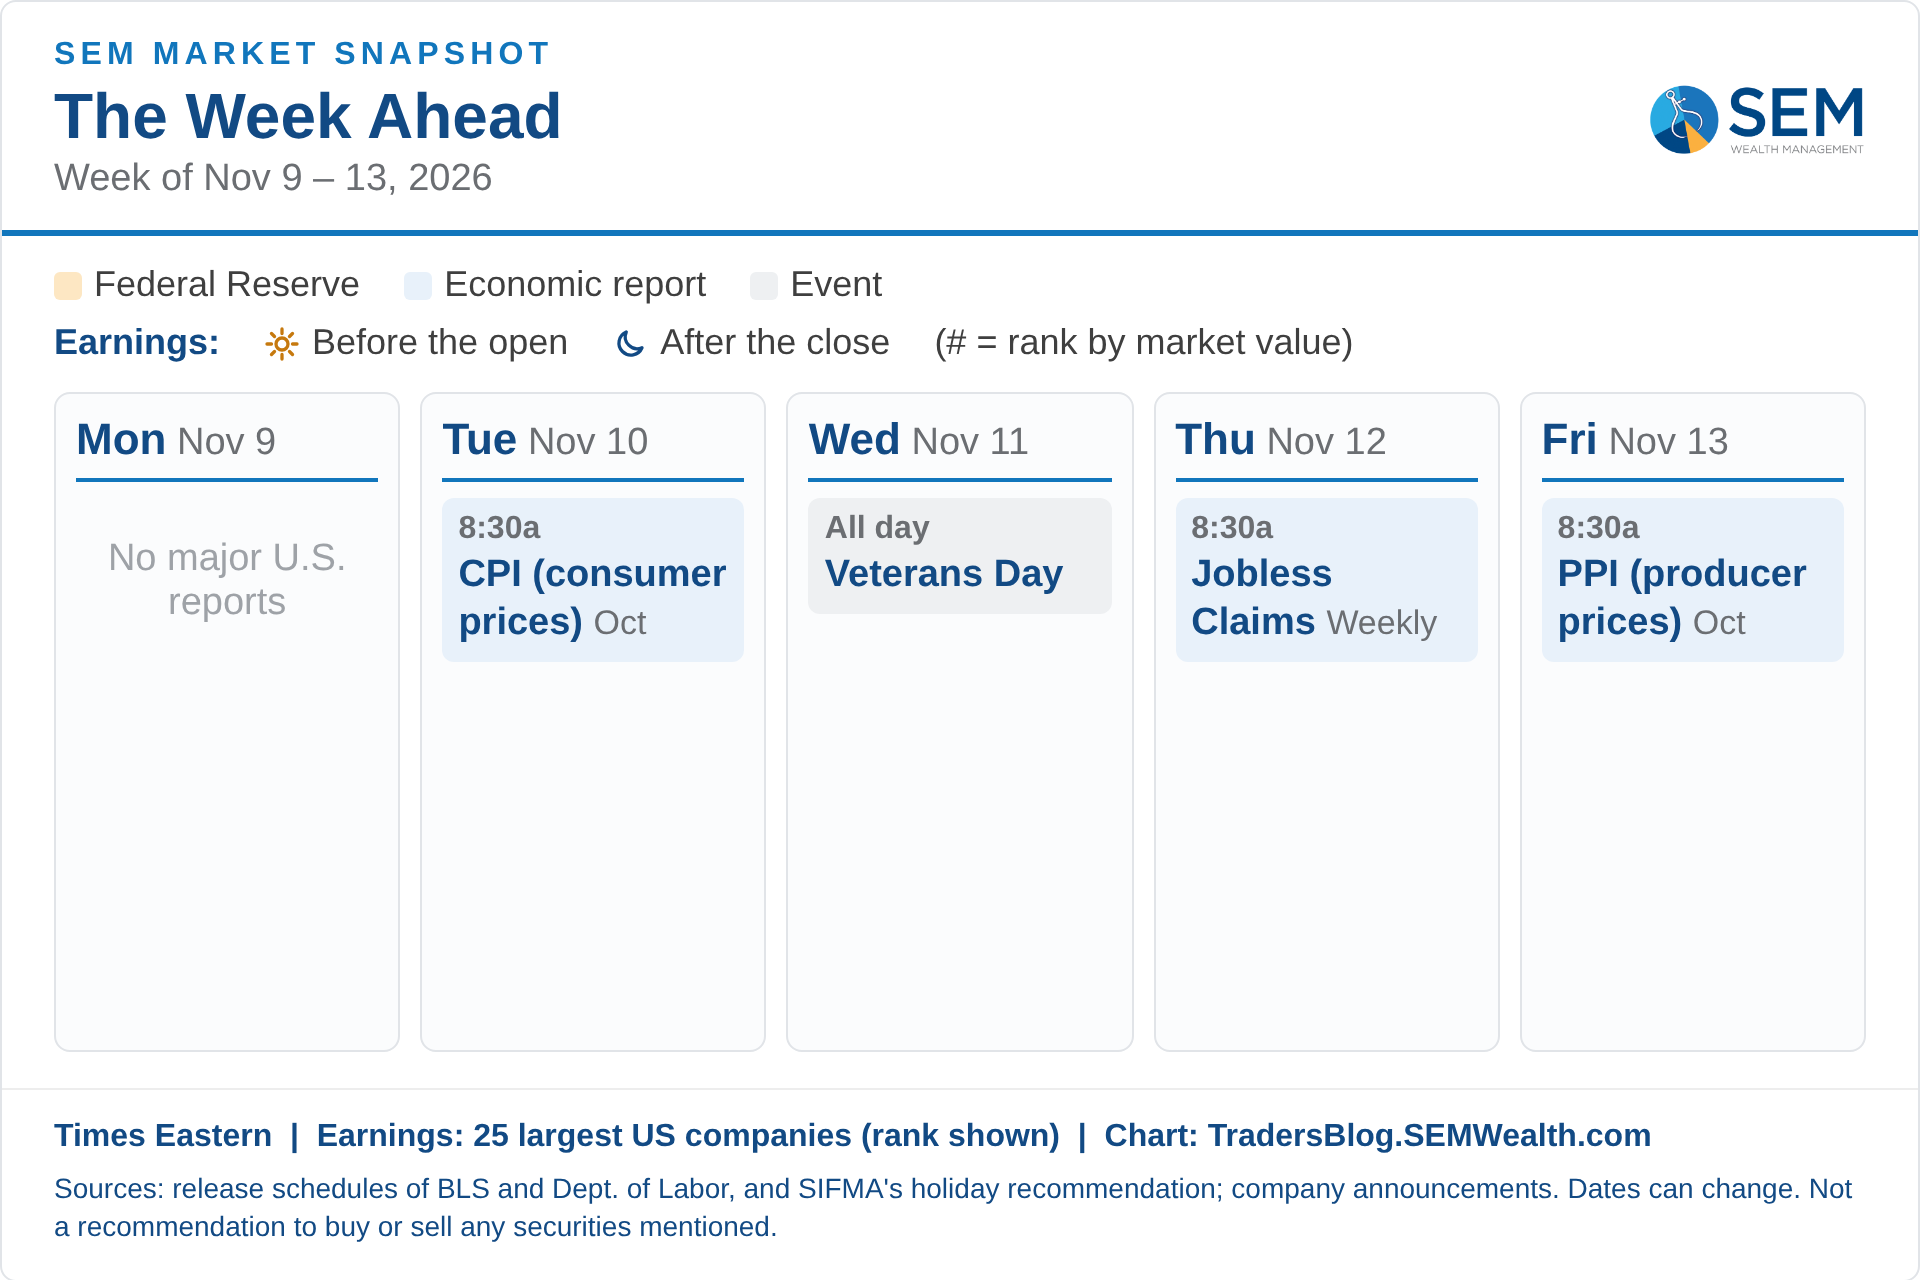
The calendar looks somewhat quiet next week. In addition to the items on the list, we'll be watching for a confirmed date and any updated pricing information on the Anthropic IPO.
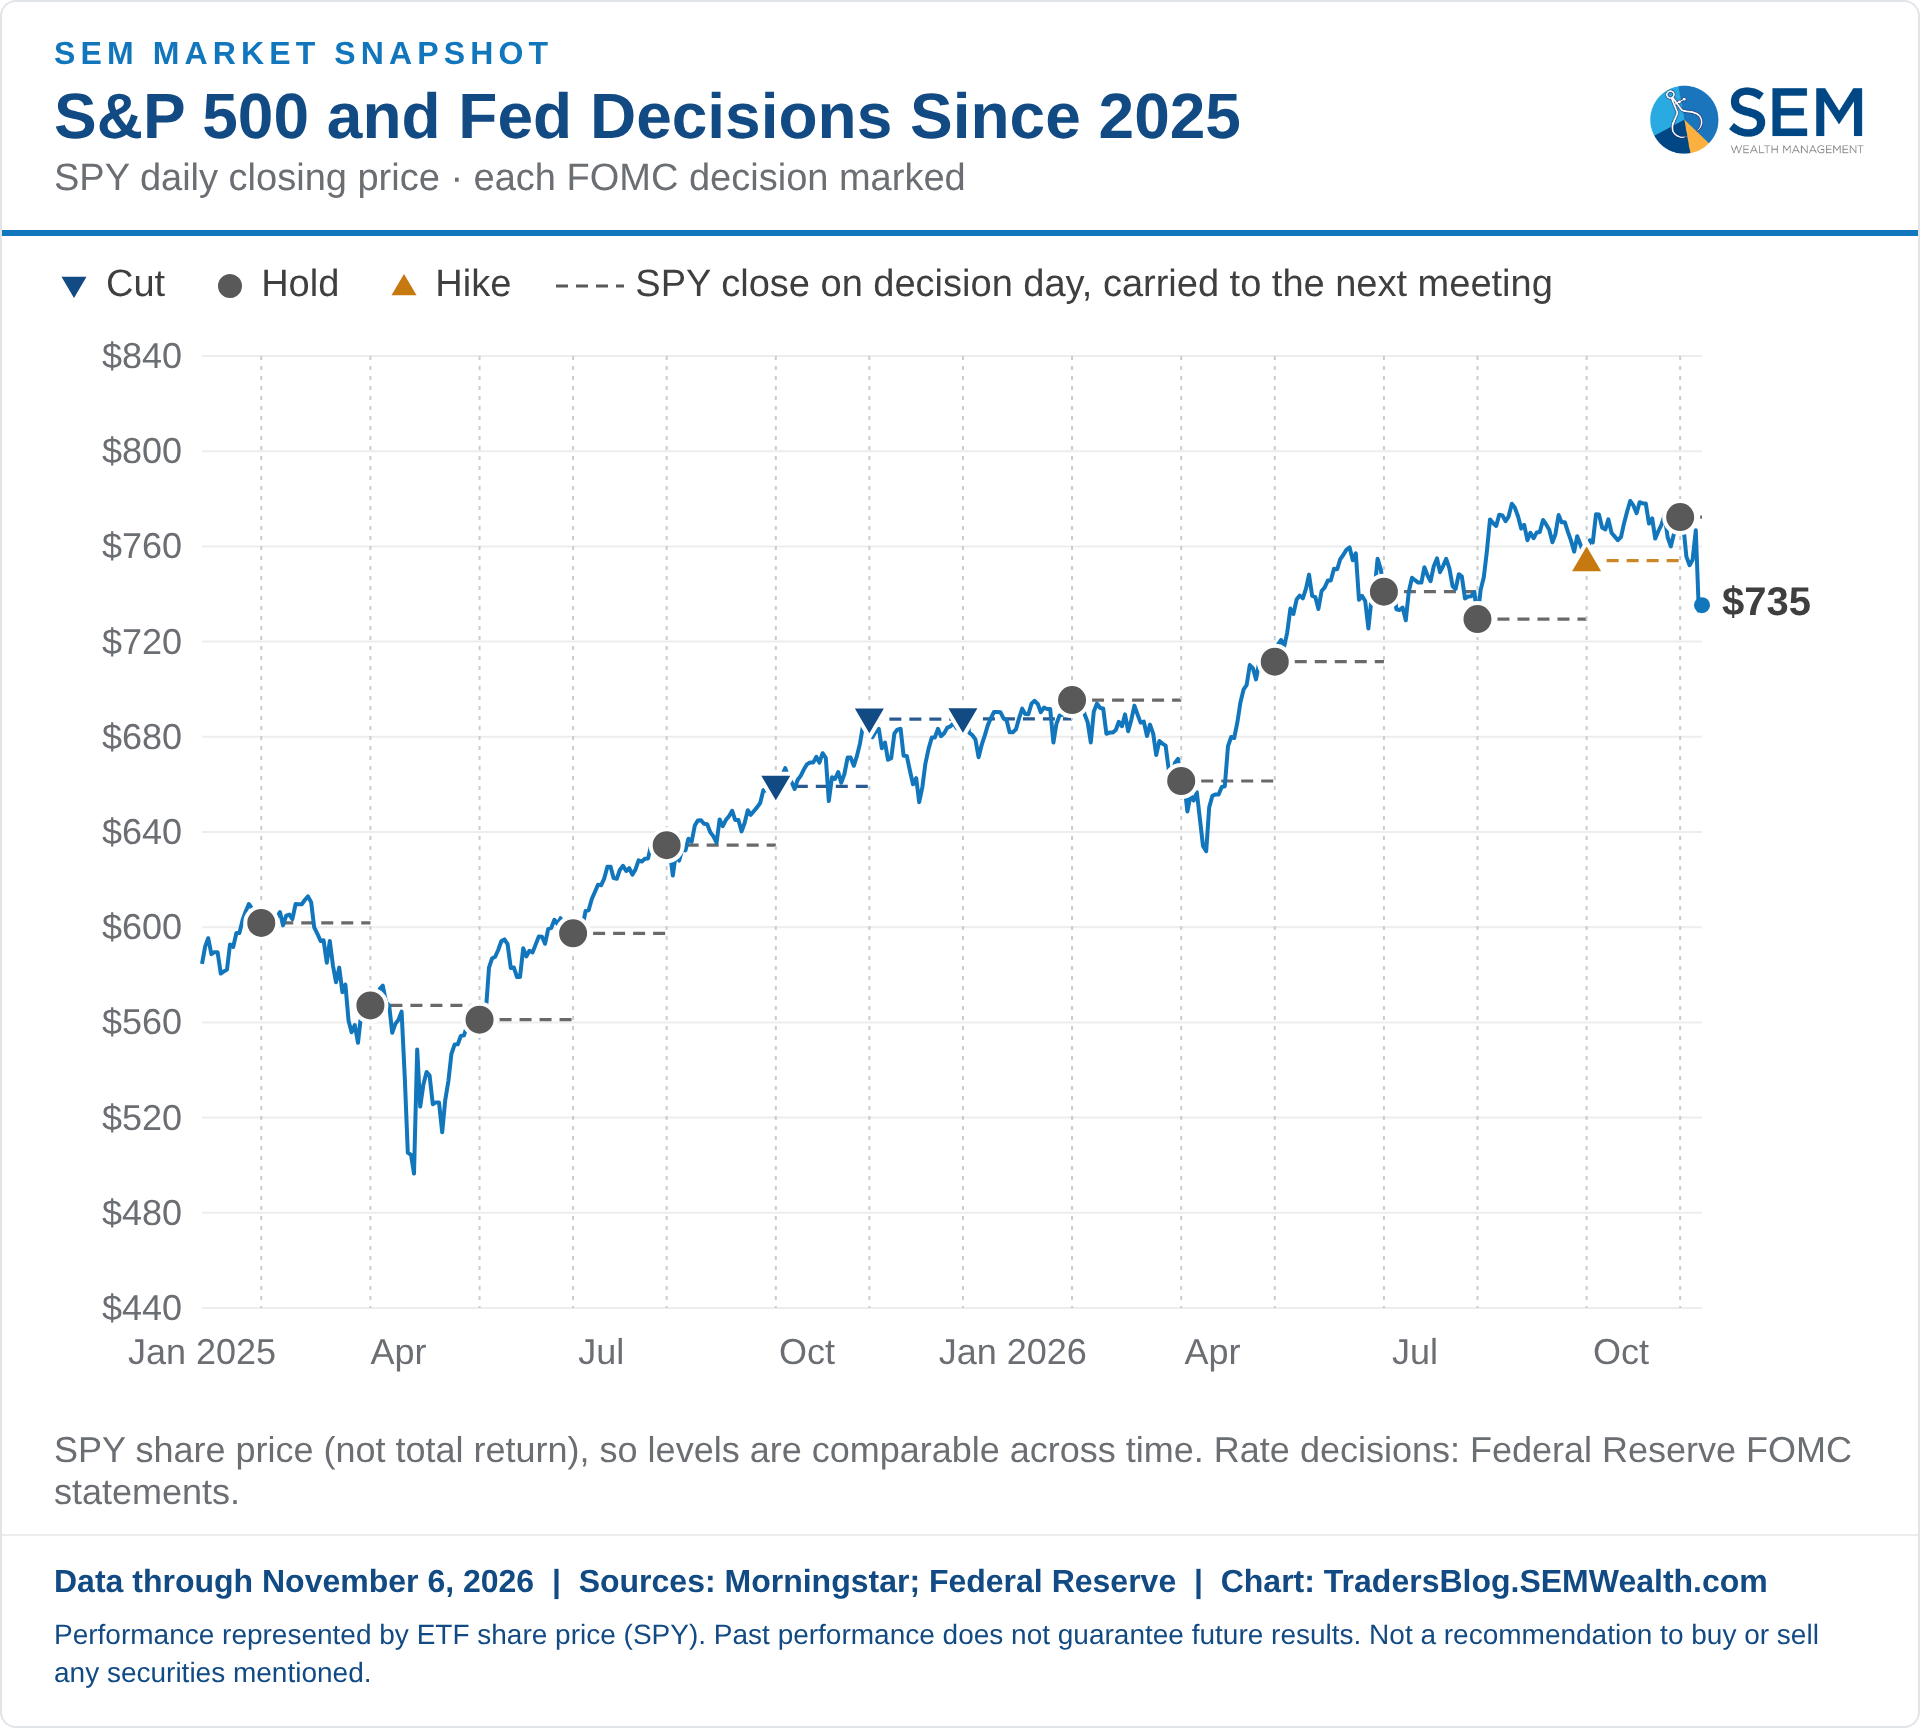
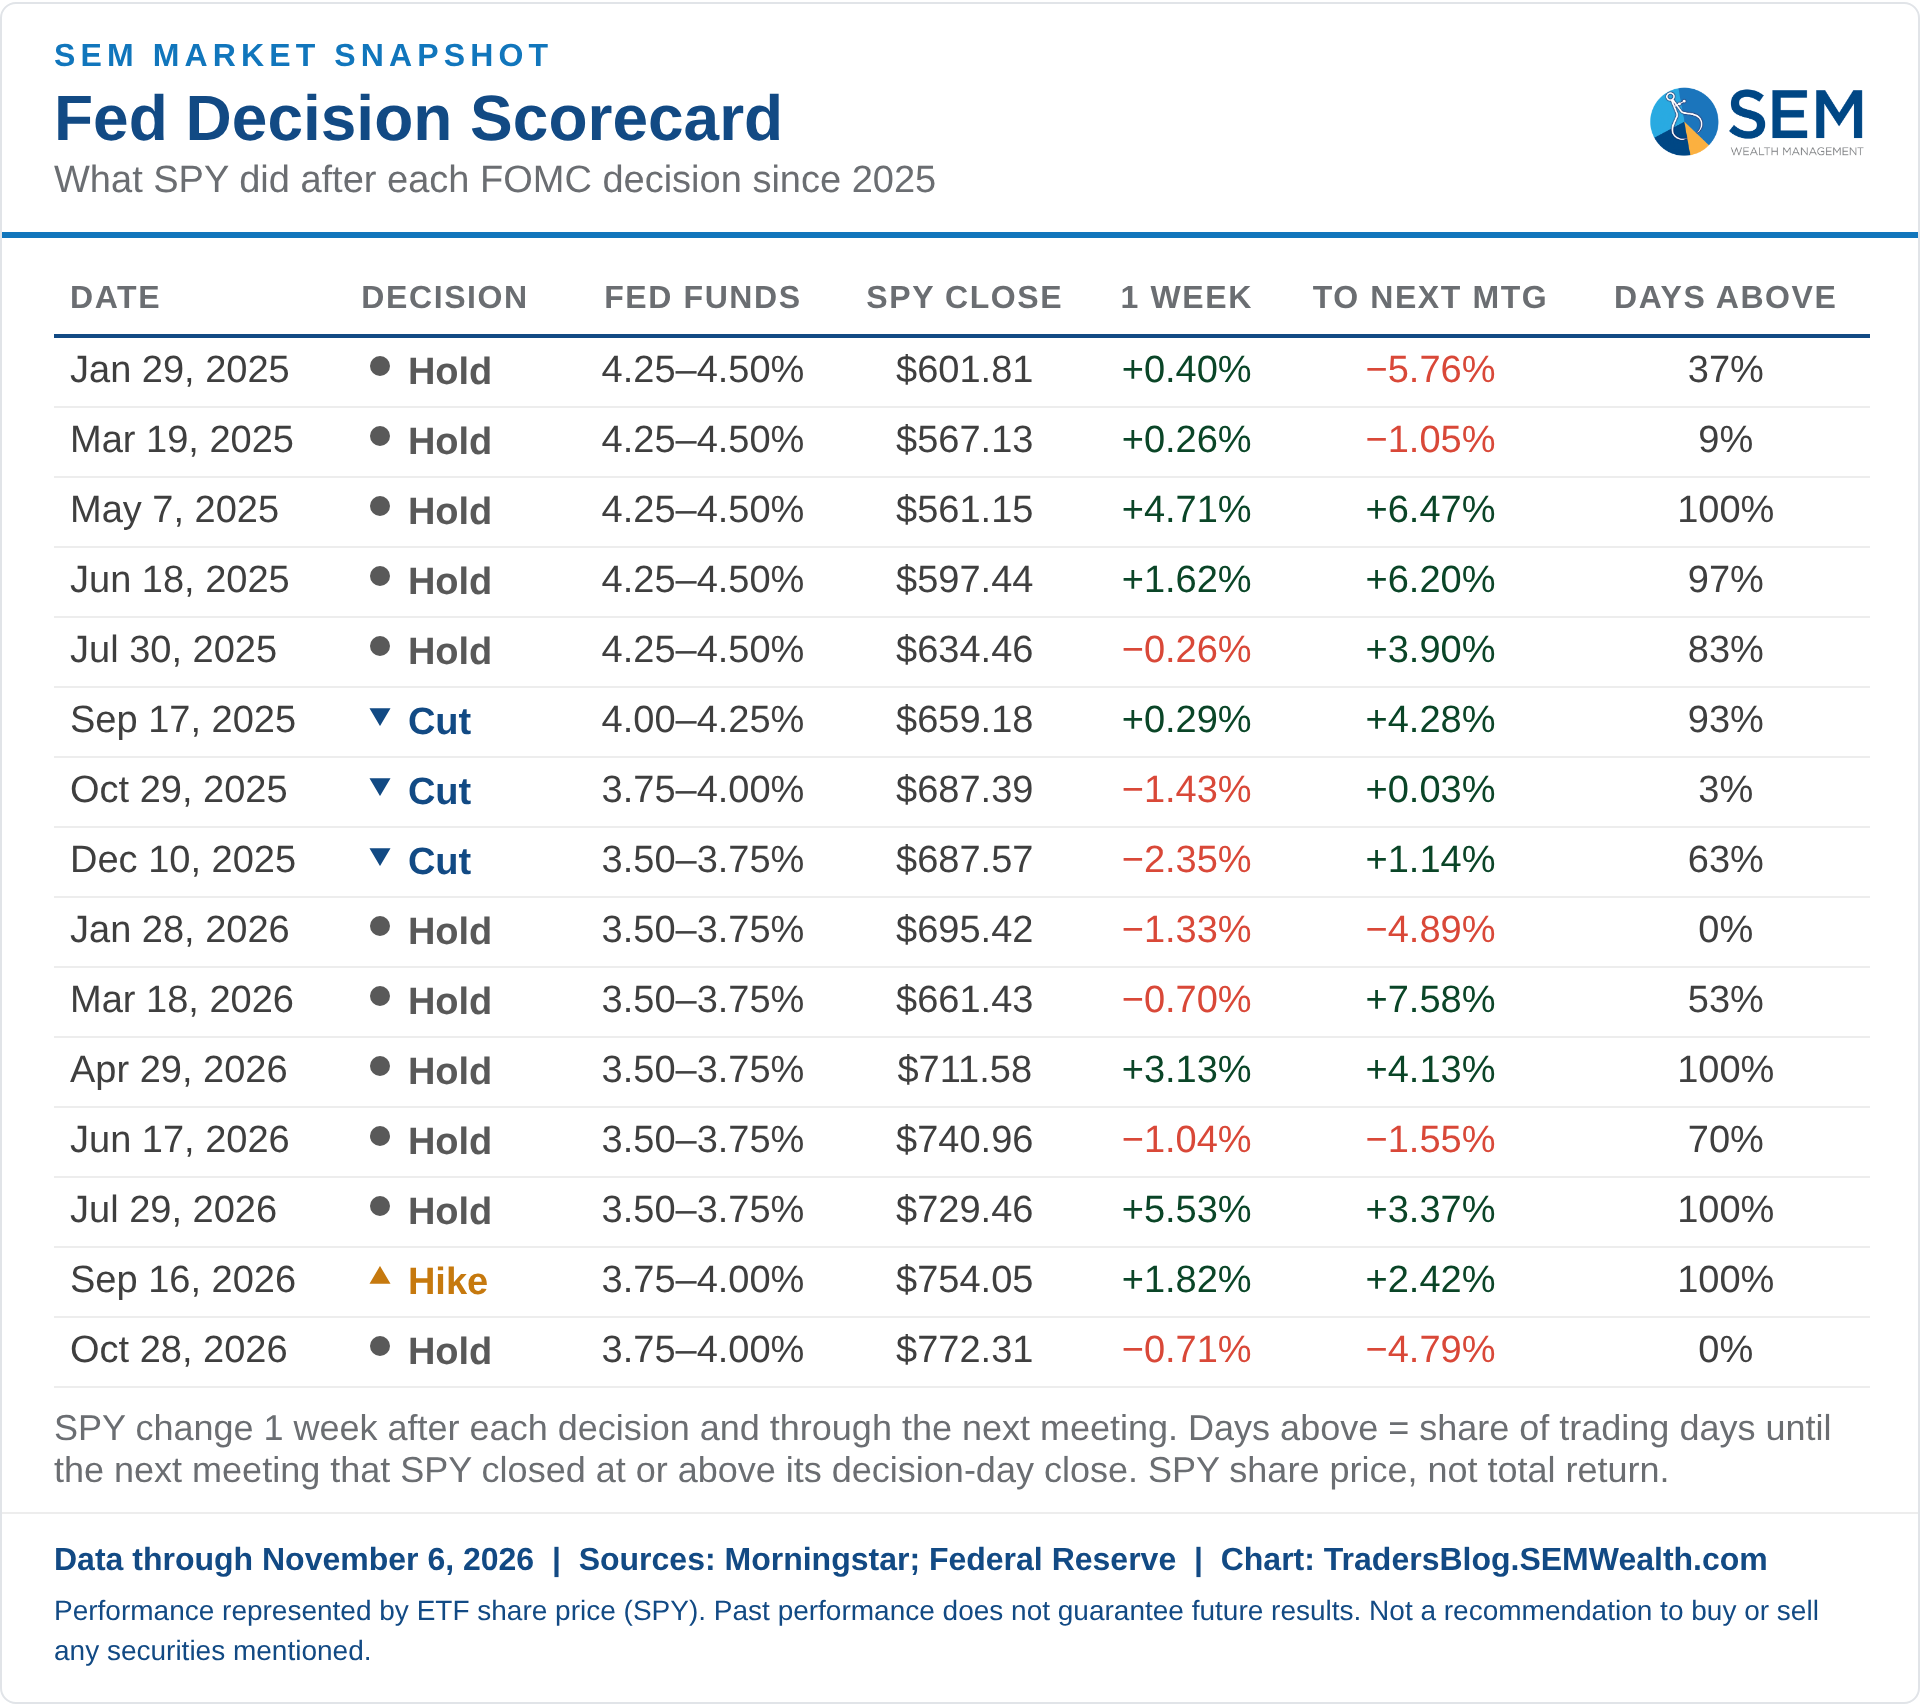
Nothing triggered last week in any of our models, despite the volatility. Our high yield bond trend was moving closer to a buy signal before the sell-off, but it hasn't triggered, so our Tactical models remain on their September 24th sell signal. As mentioned in #6, our Cycle Position could lead to an adjustment as early as December. As always, we are here watching and adjusting so you don't have to.

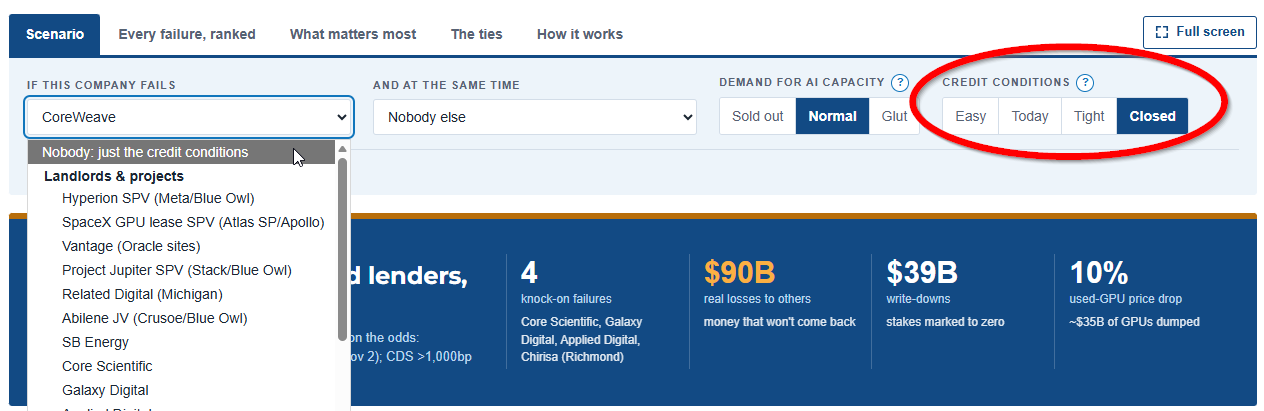
AI’s Next Bottleneck: Politics vs. Data Center Boom
Courtesy of Cleanview Intelligence and Michael Thomas' Substack, let's take a deeper dive from the recent election results and the impact on the data center buildout throughout the U.S.
With most post-election coverage focused on the "Blue Wave" in Congress, I wanted to look at a data-center buildout through a different lens (shocking, I know) that will probably, or eventually will, have some impact on your hometown or investment portfolio.
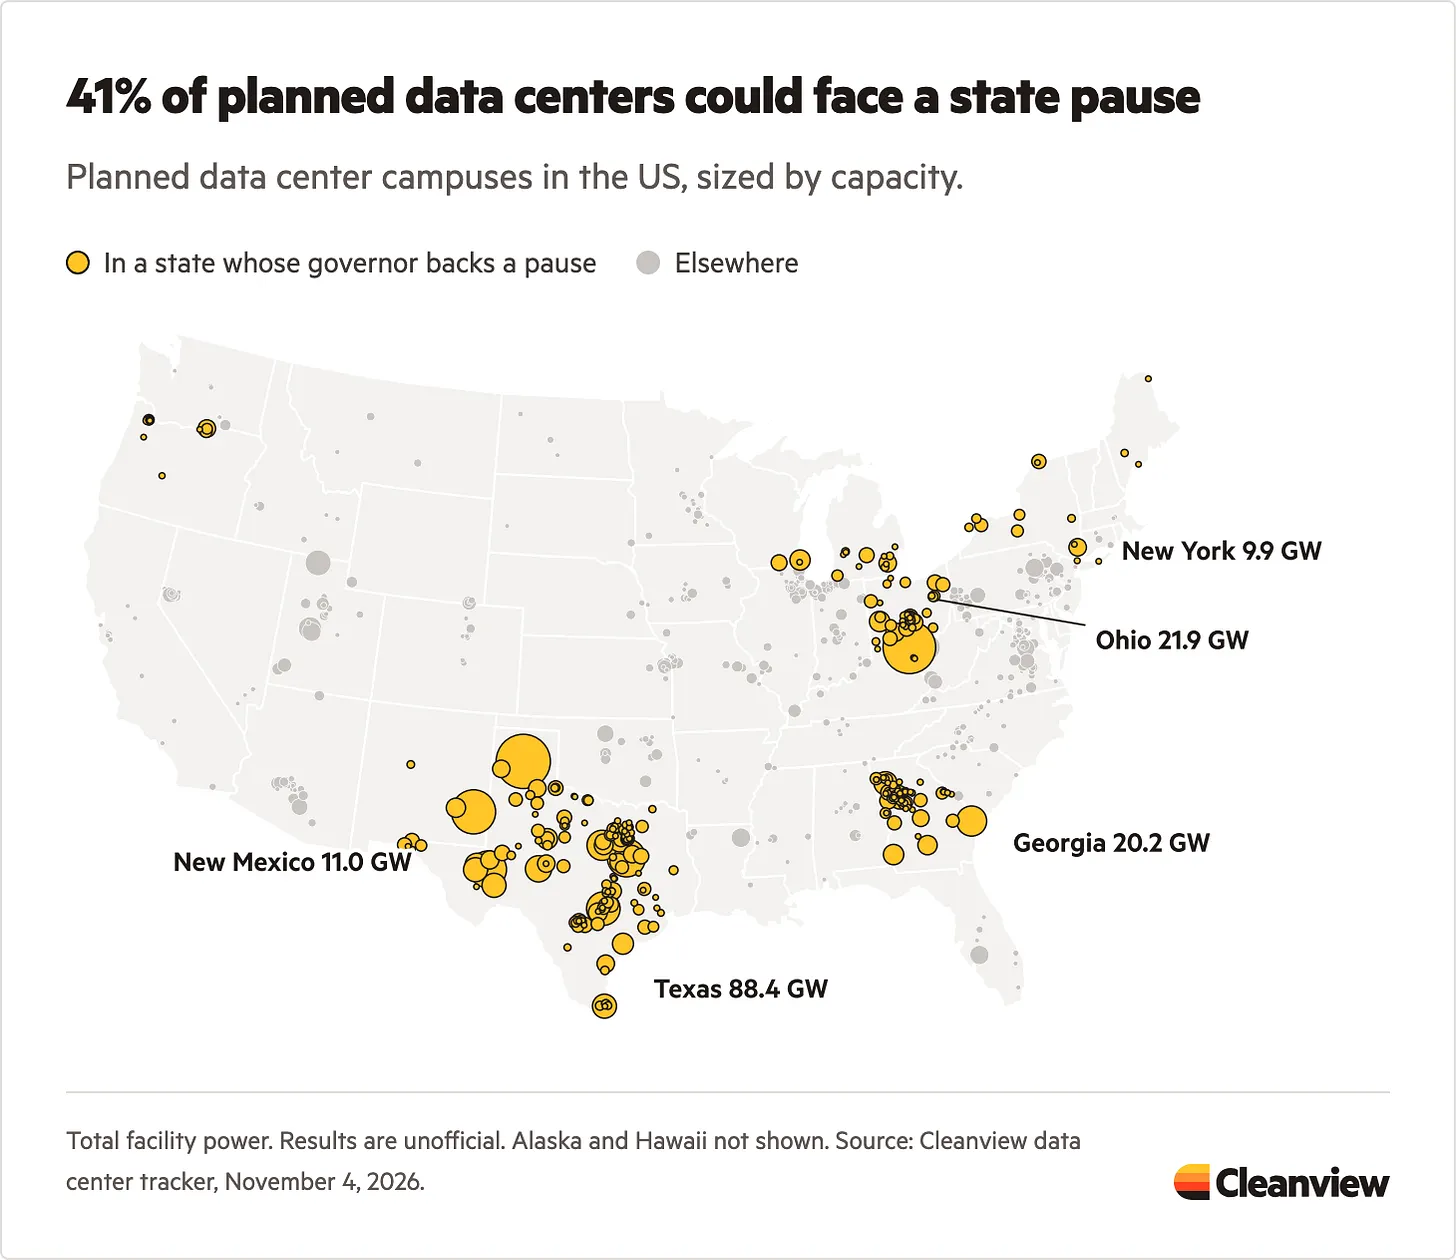
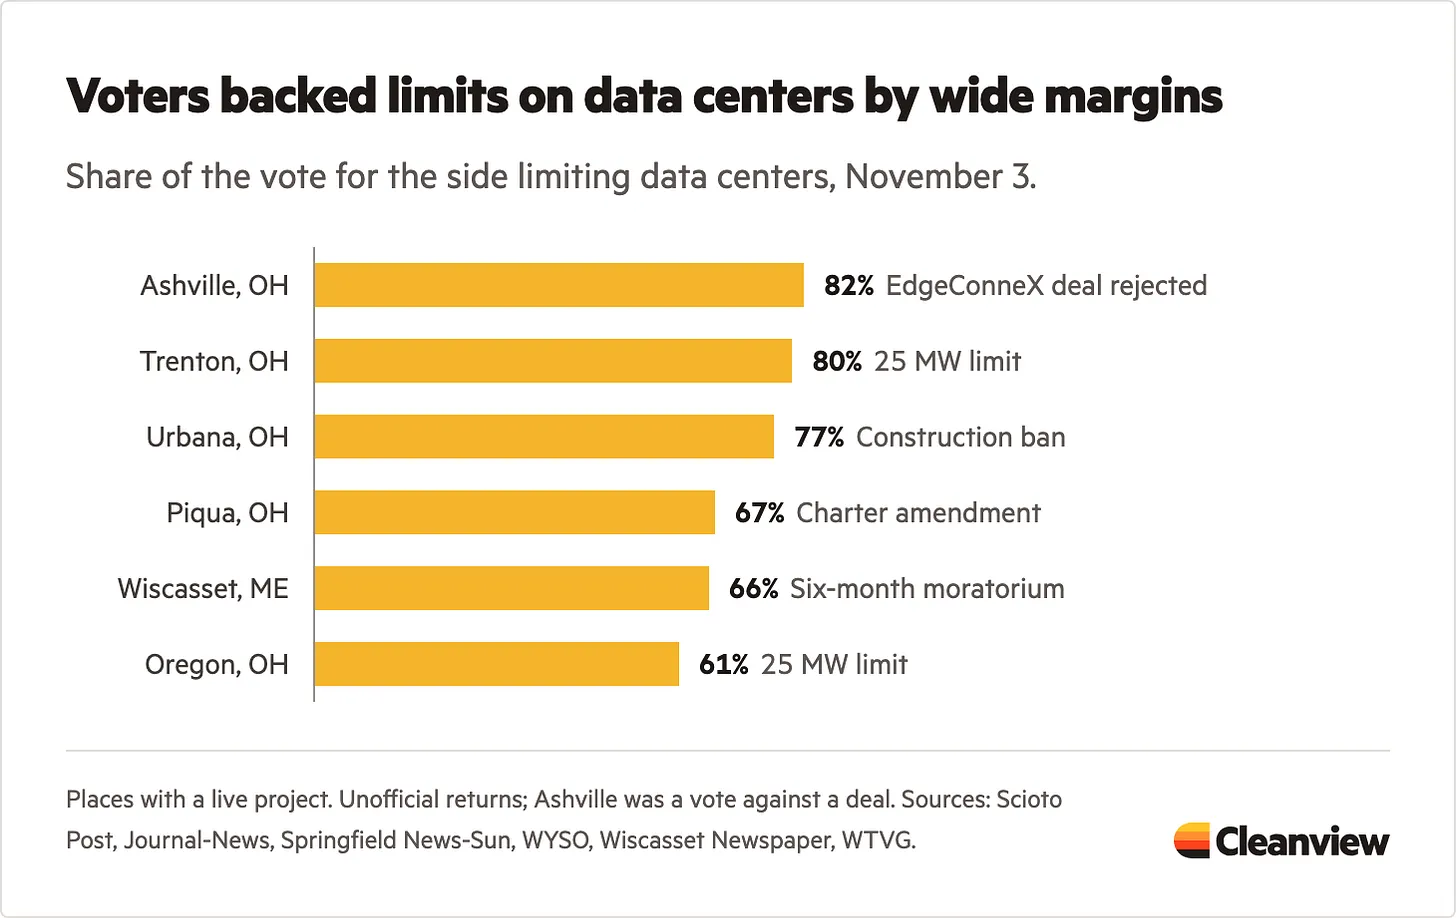
As you may have seen on the local ballot, there may have been decision requesting a vote to proceed or halt a data center in your locality. In fact, according to Ballotpedia, data centers were directly on the ballot in 41 elections across the country, varying from an outright ban or a temporary pause.
Per Cleanview's analysis, over 40% of planned data centers could face a state pause, with nine states represented by a governor or governor-elect who has promised or already imposed a pause on data centers.
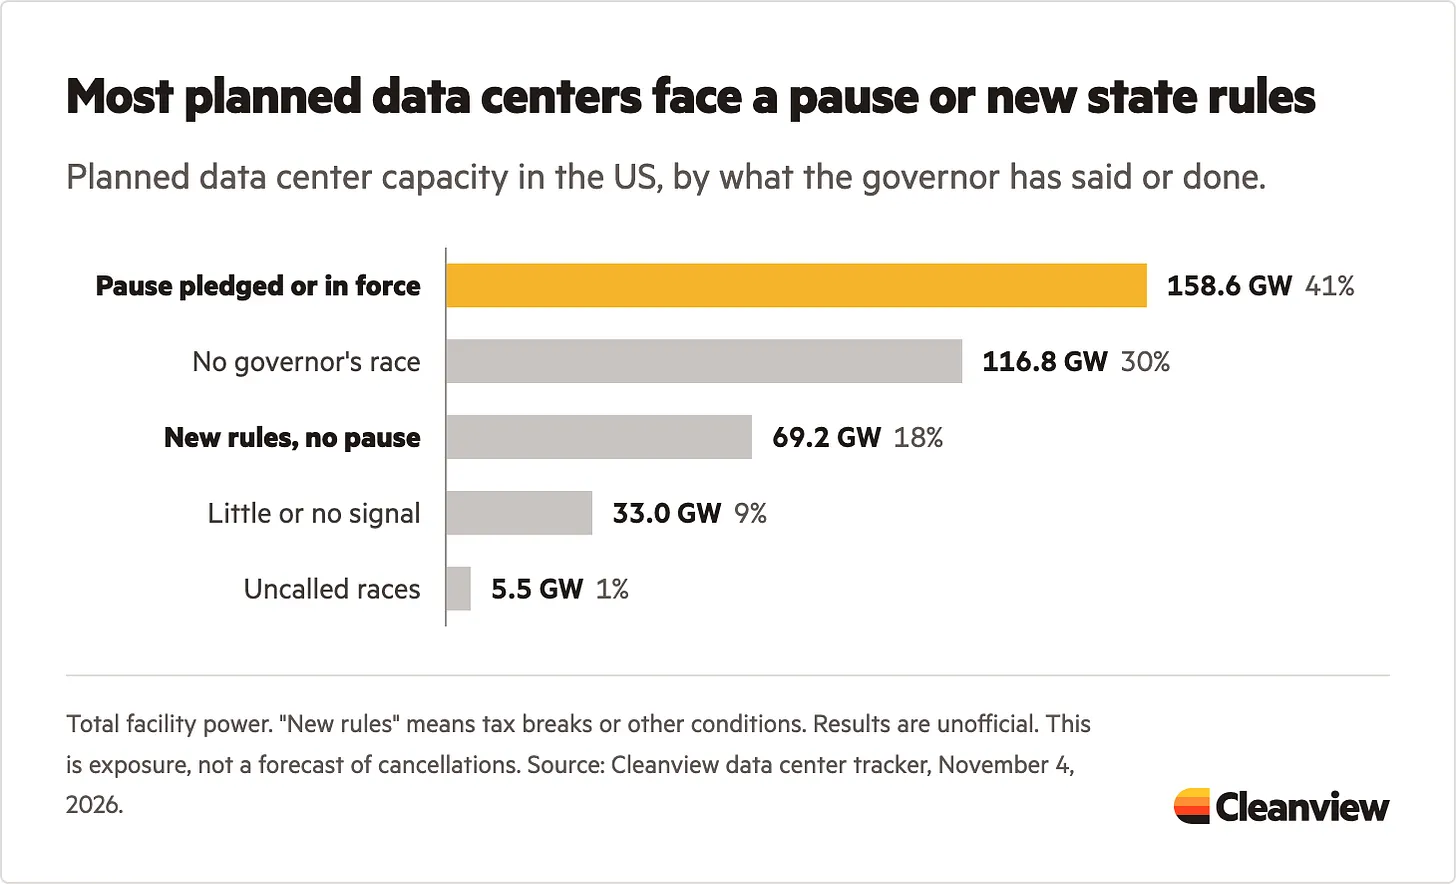
To reiterate the point, there is a difference between a ban versus a pause.
The officials we vote for, such as governors and state legislatures, have significant authority to decide how data centers are built out within their local jurisdiction.
This can mean blocking it entirely or slowing it down with additional regulation. Additionally, those elected officials can pass moratoriums, strip tax breaks, appoint new utility regulators, or introduce additional environmental and labor standards.
However, newly elected officials promised pauses, not bans, on data centers. Most campaign trails included proposals or statements that lacked specific details, forcing both sides of the political aisle to negotiate new rules that will determine whether a pause lasts months or years.
For any new rules to be written, we won't know until next year when state legislatures meet.
So, as a form of disclosure, this is with the assumption that the politicians stay true to their word on their plan.
Which companies are most at risk, and how should I think about my investment portfolio, you ask?
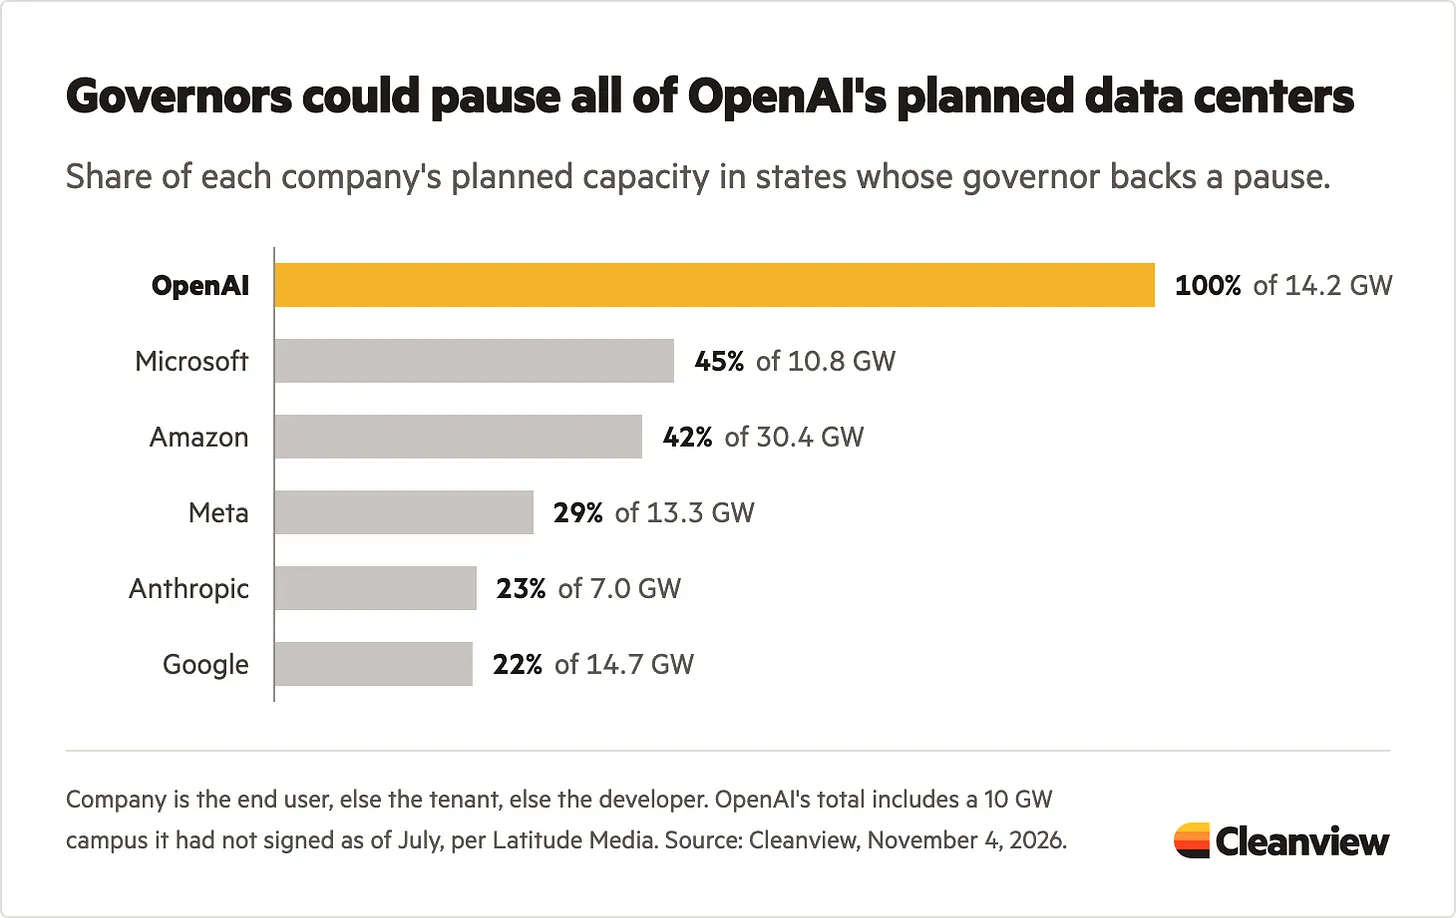
Yes, you're reading that correctly. 100% of OpenAI's planned pipeline is located in states with a new governor who backed a pause on the campaign trail.
To a lesser extent, the darlings of the MAG7 could also be impacted by their own planned pipeline, forcing executives to look elsewhere, whether that be migrating to Republican-led states (like Utah and West Virginia), internationally*, or even leaving Earth**.
So, as we all know, this will be an ongoing development for everyone across the country for quite some time.
Still, whether it is with your neighbor, co-worker, friends, or family, we can assure you that, as you've seen recently in previous iterations of our blog, your SEM advisor will ensure that the latest developments that matter most to you and your investment goals, and any recent viewpoints from the expertise of the SEM team, are shared promptly.
*Google recently announced a $15 billion investment in Malaysia.
**Elon Musk has expressed interest in SpaceX to develop data centers in space.
If you would like to dive this sort of analysis, filled with interactive charts and maps further on your own time, please check out Cleanview's website.
Market Data
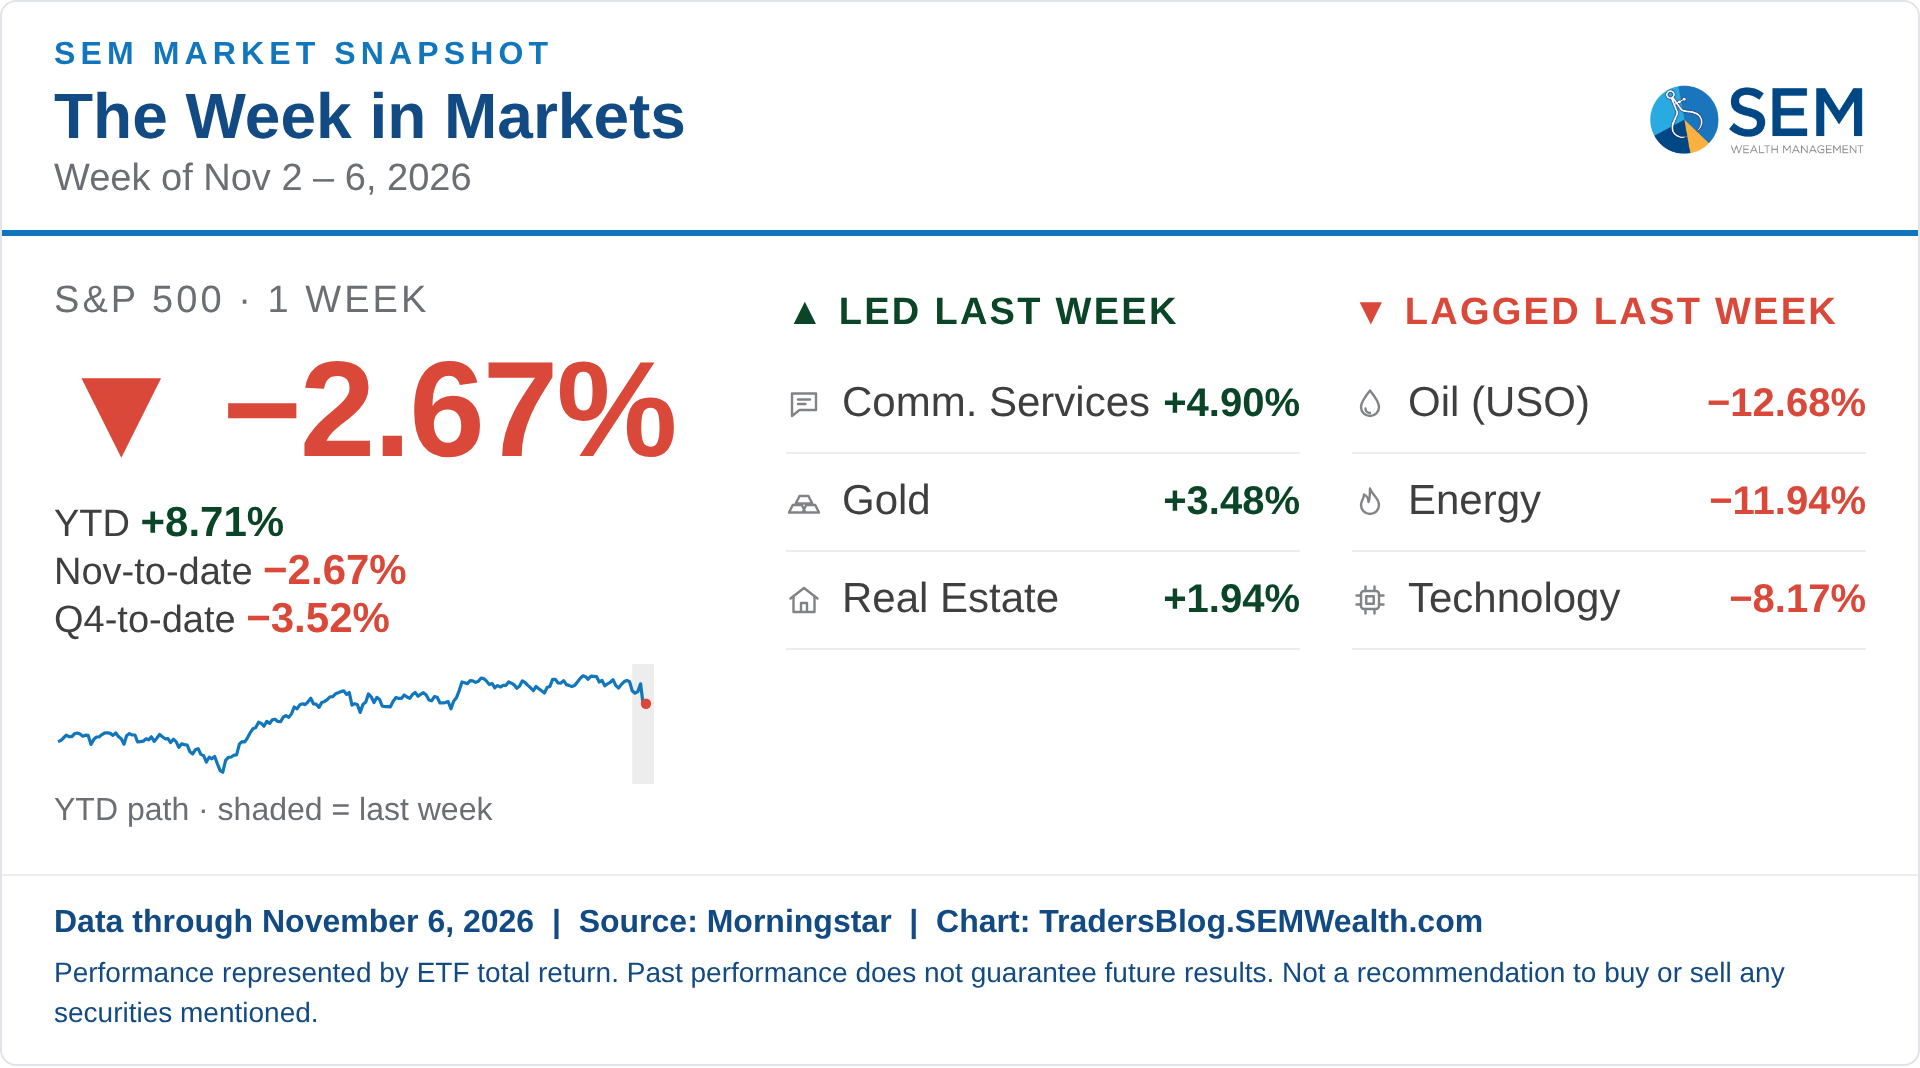
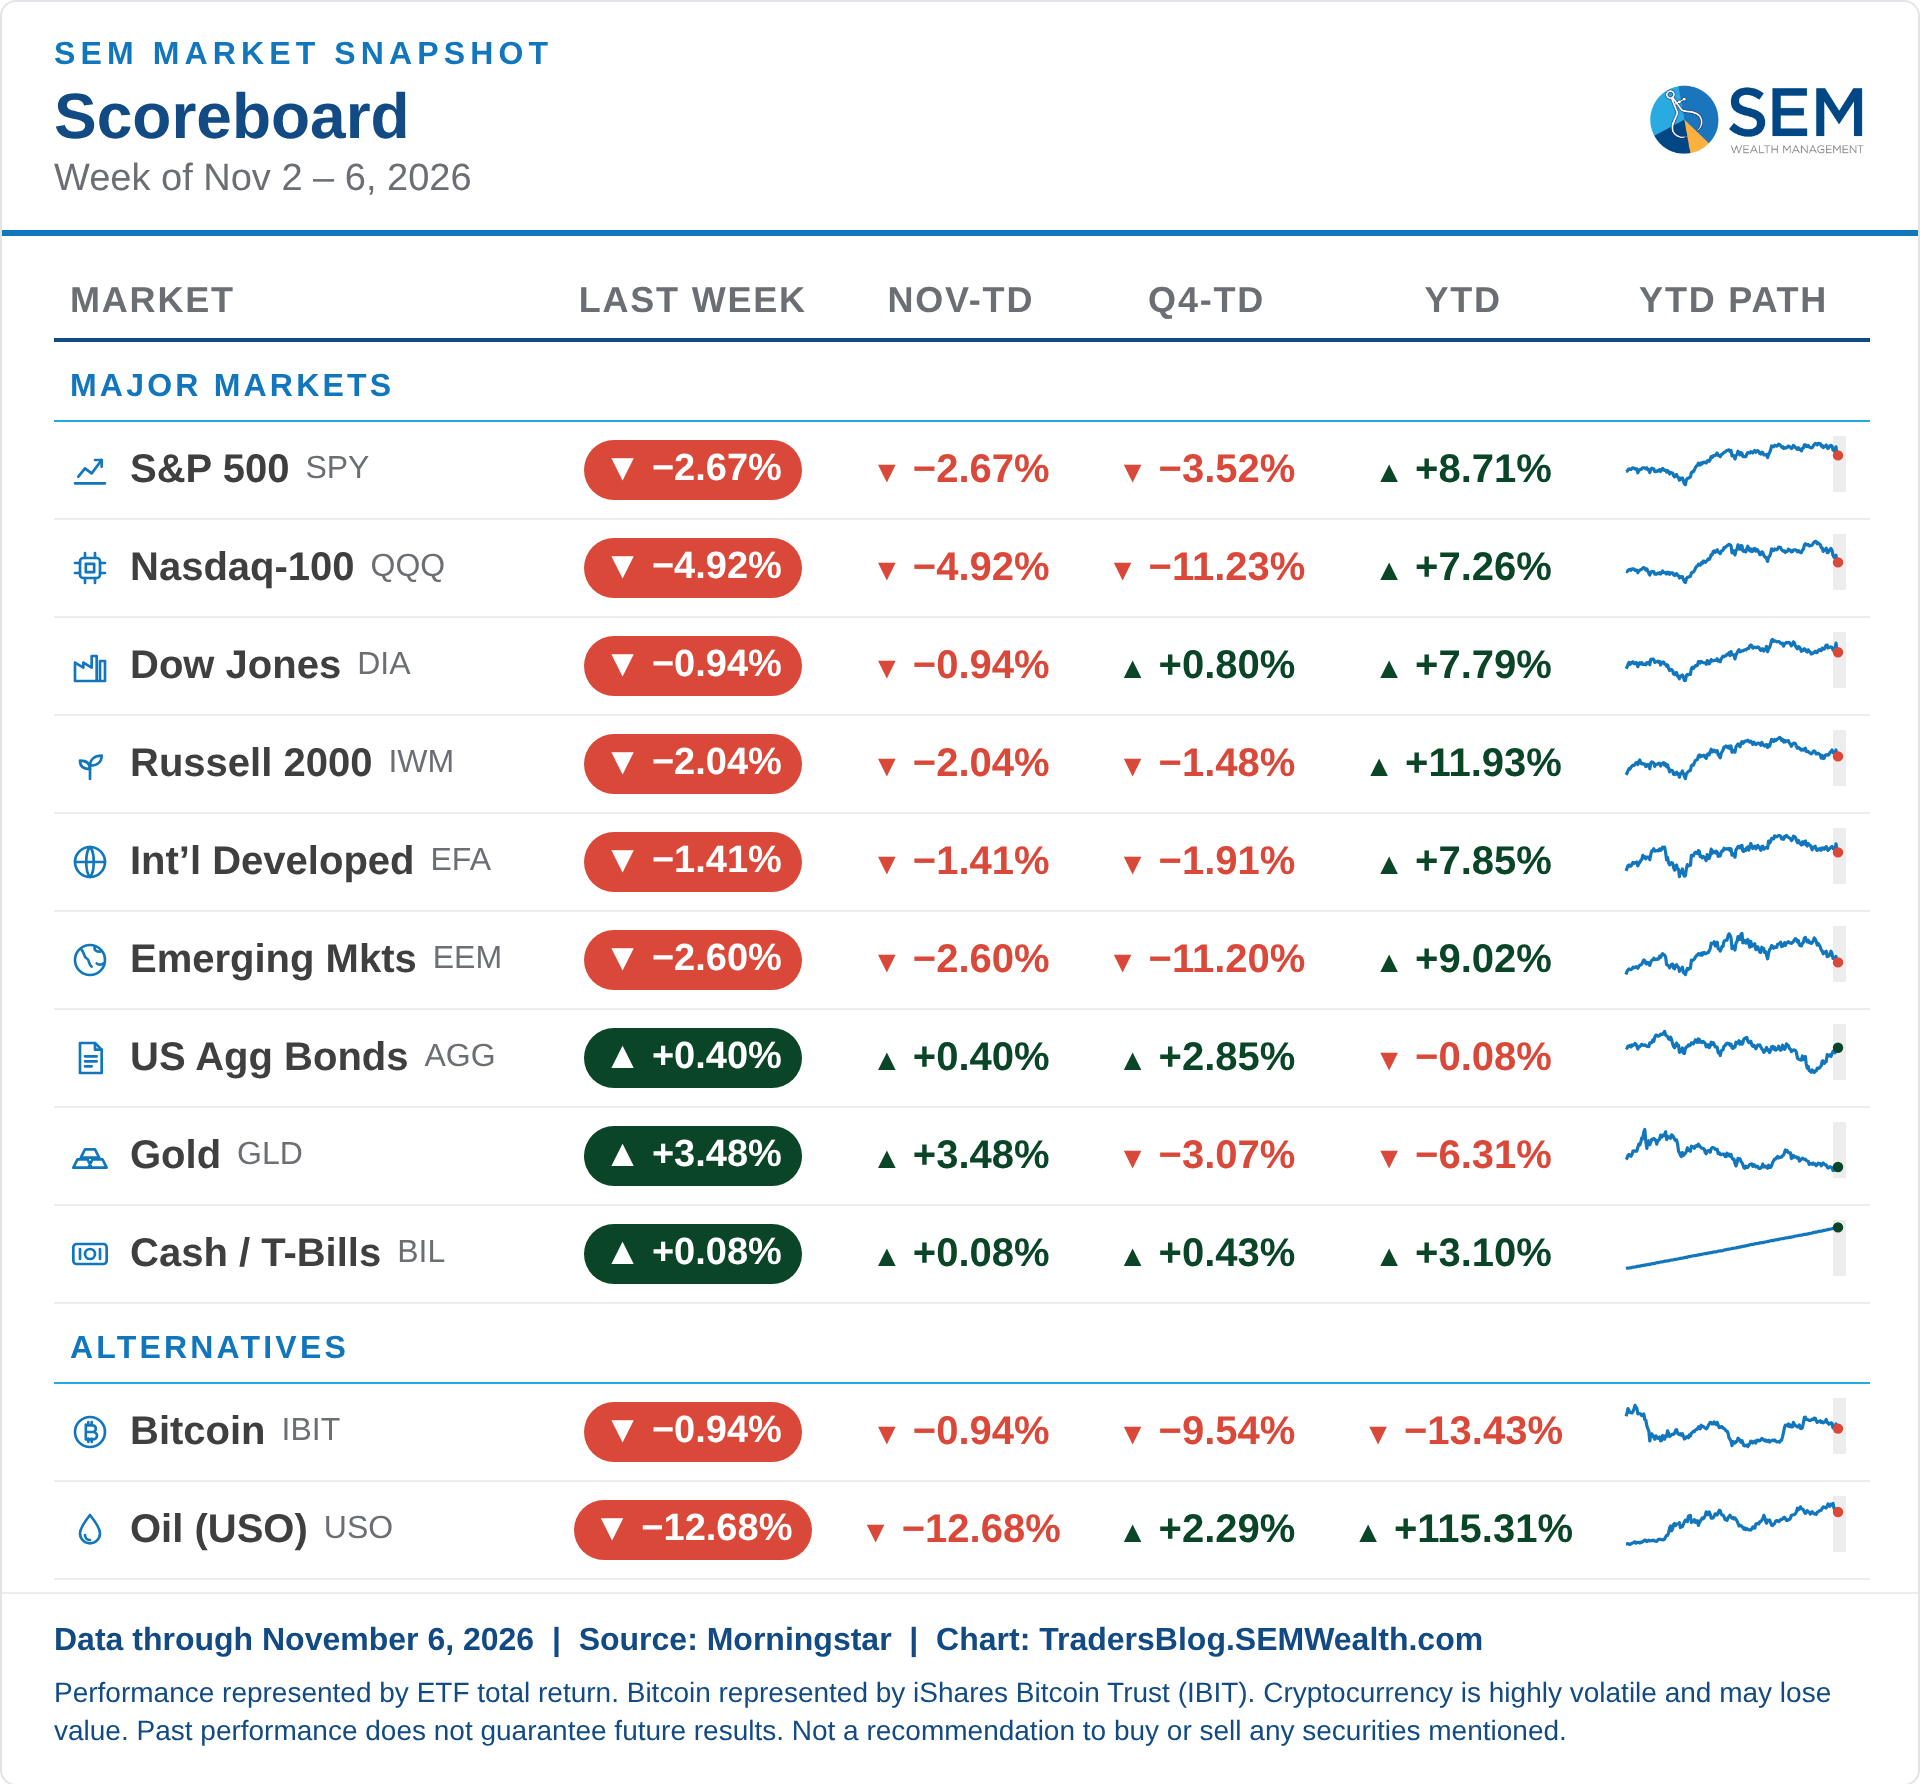
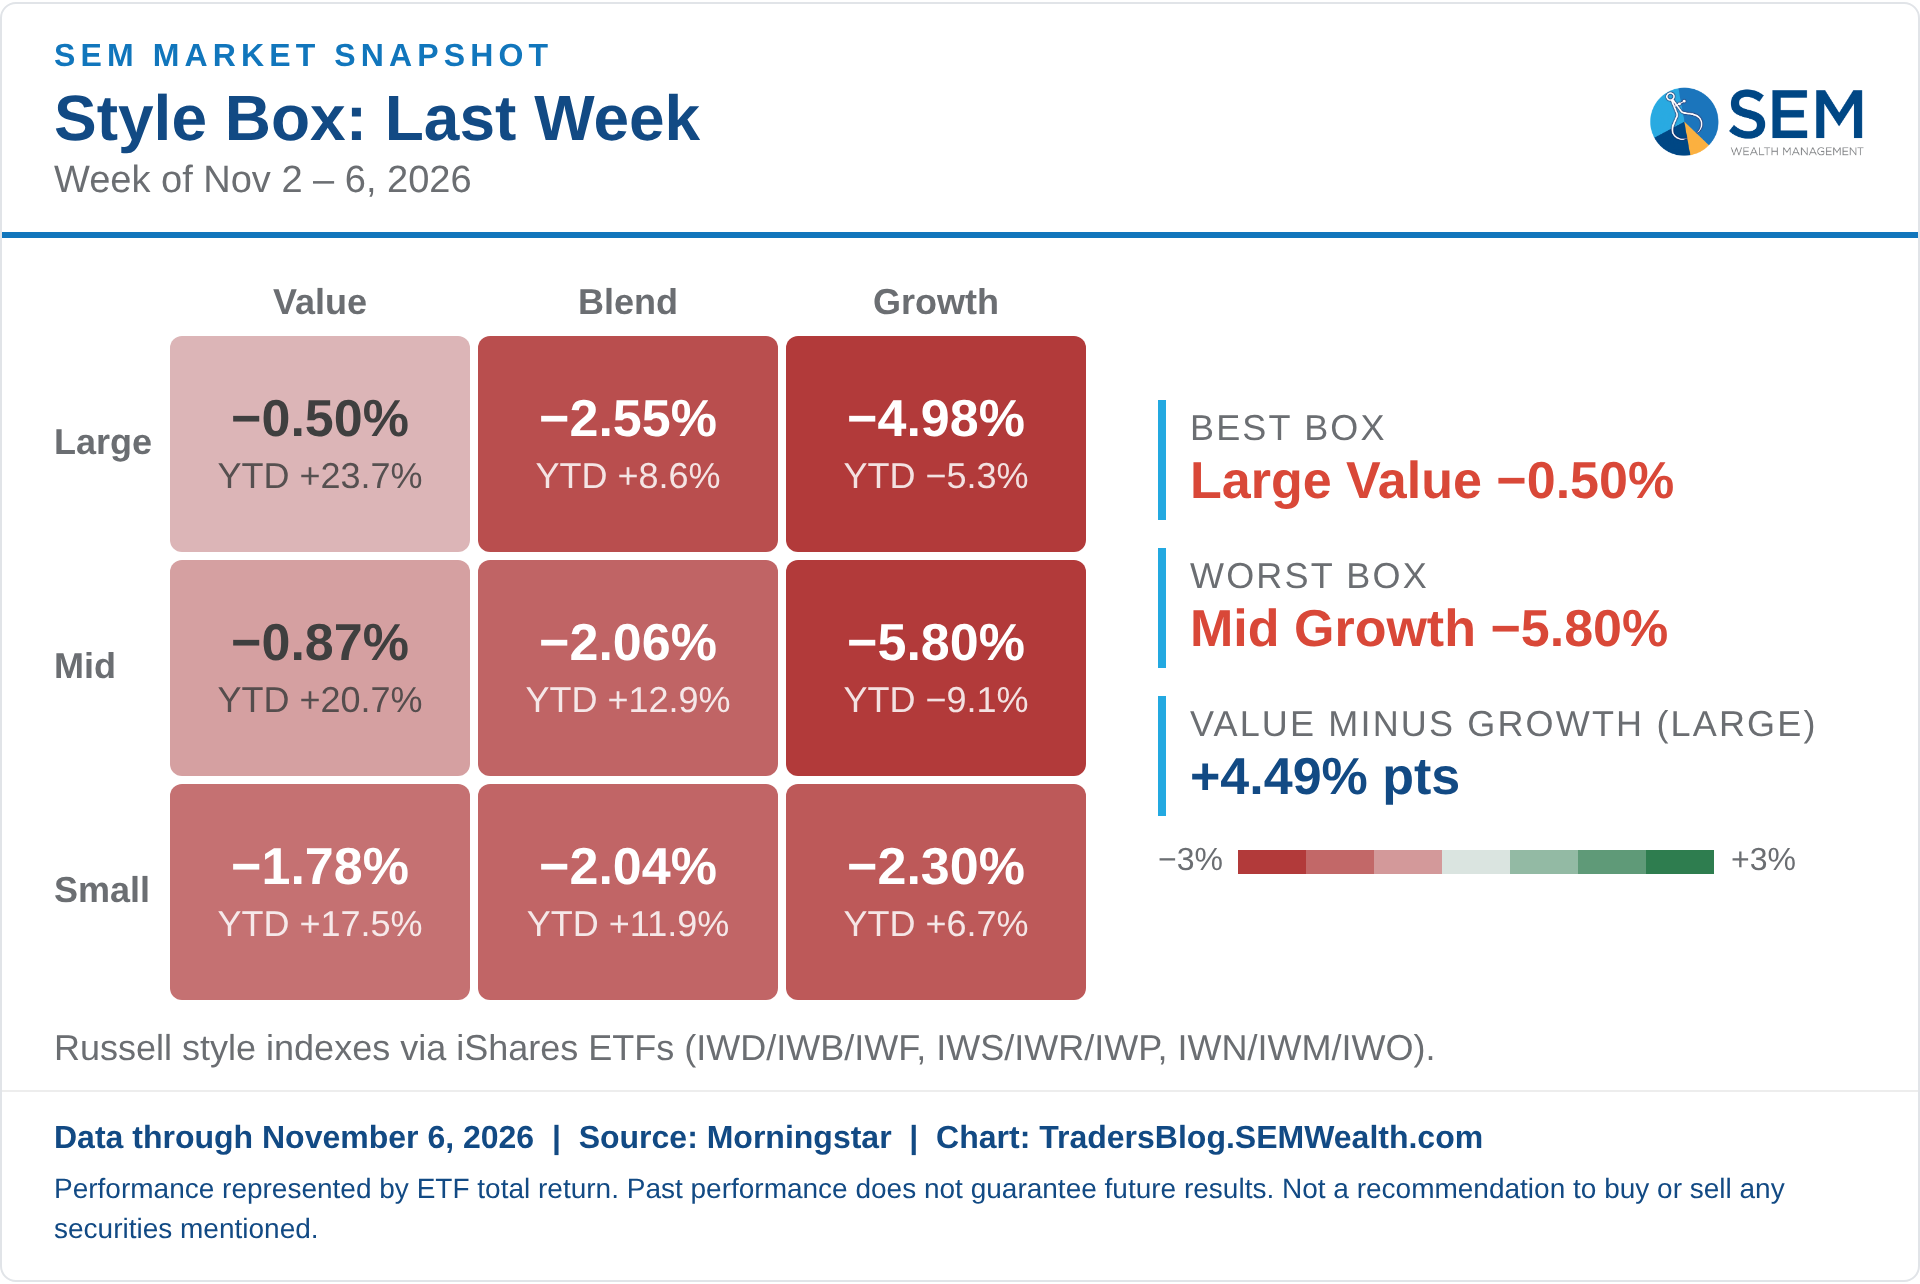
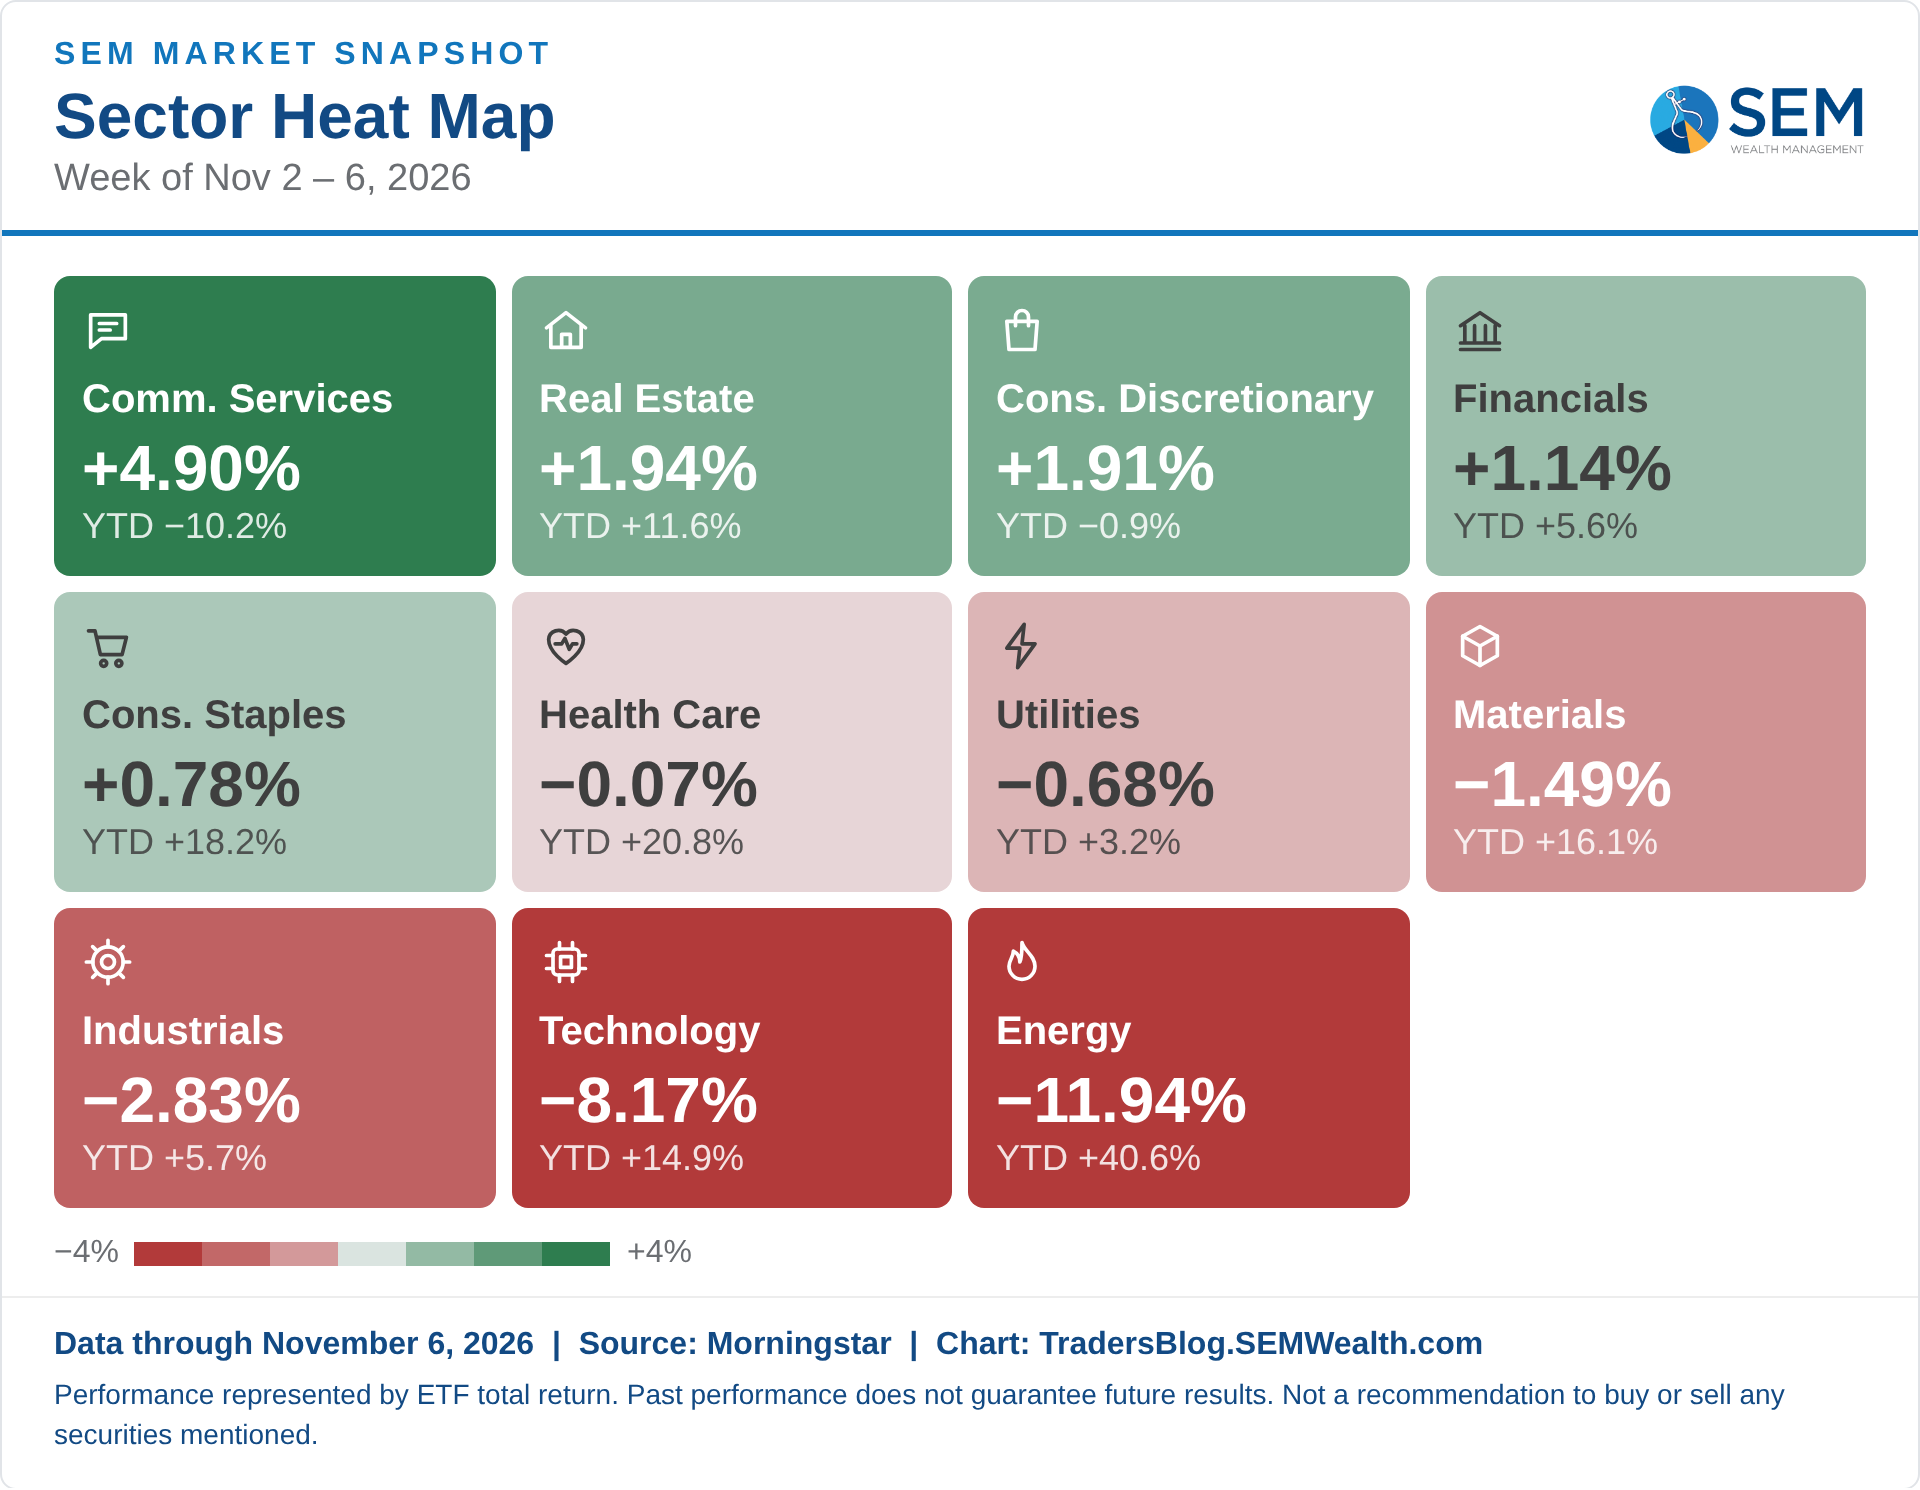
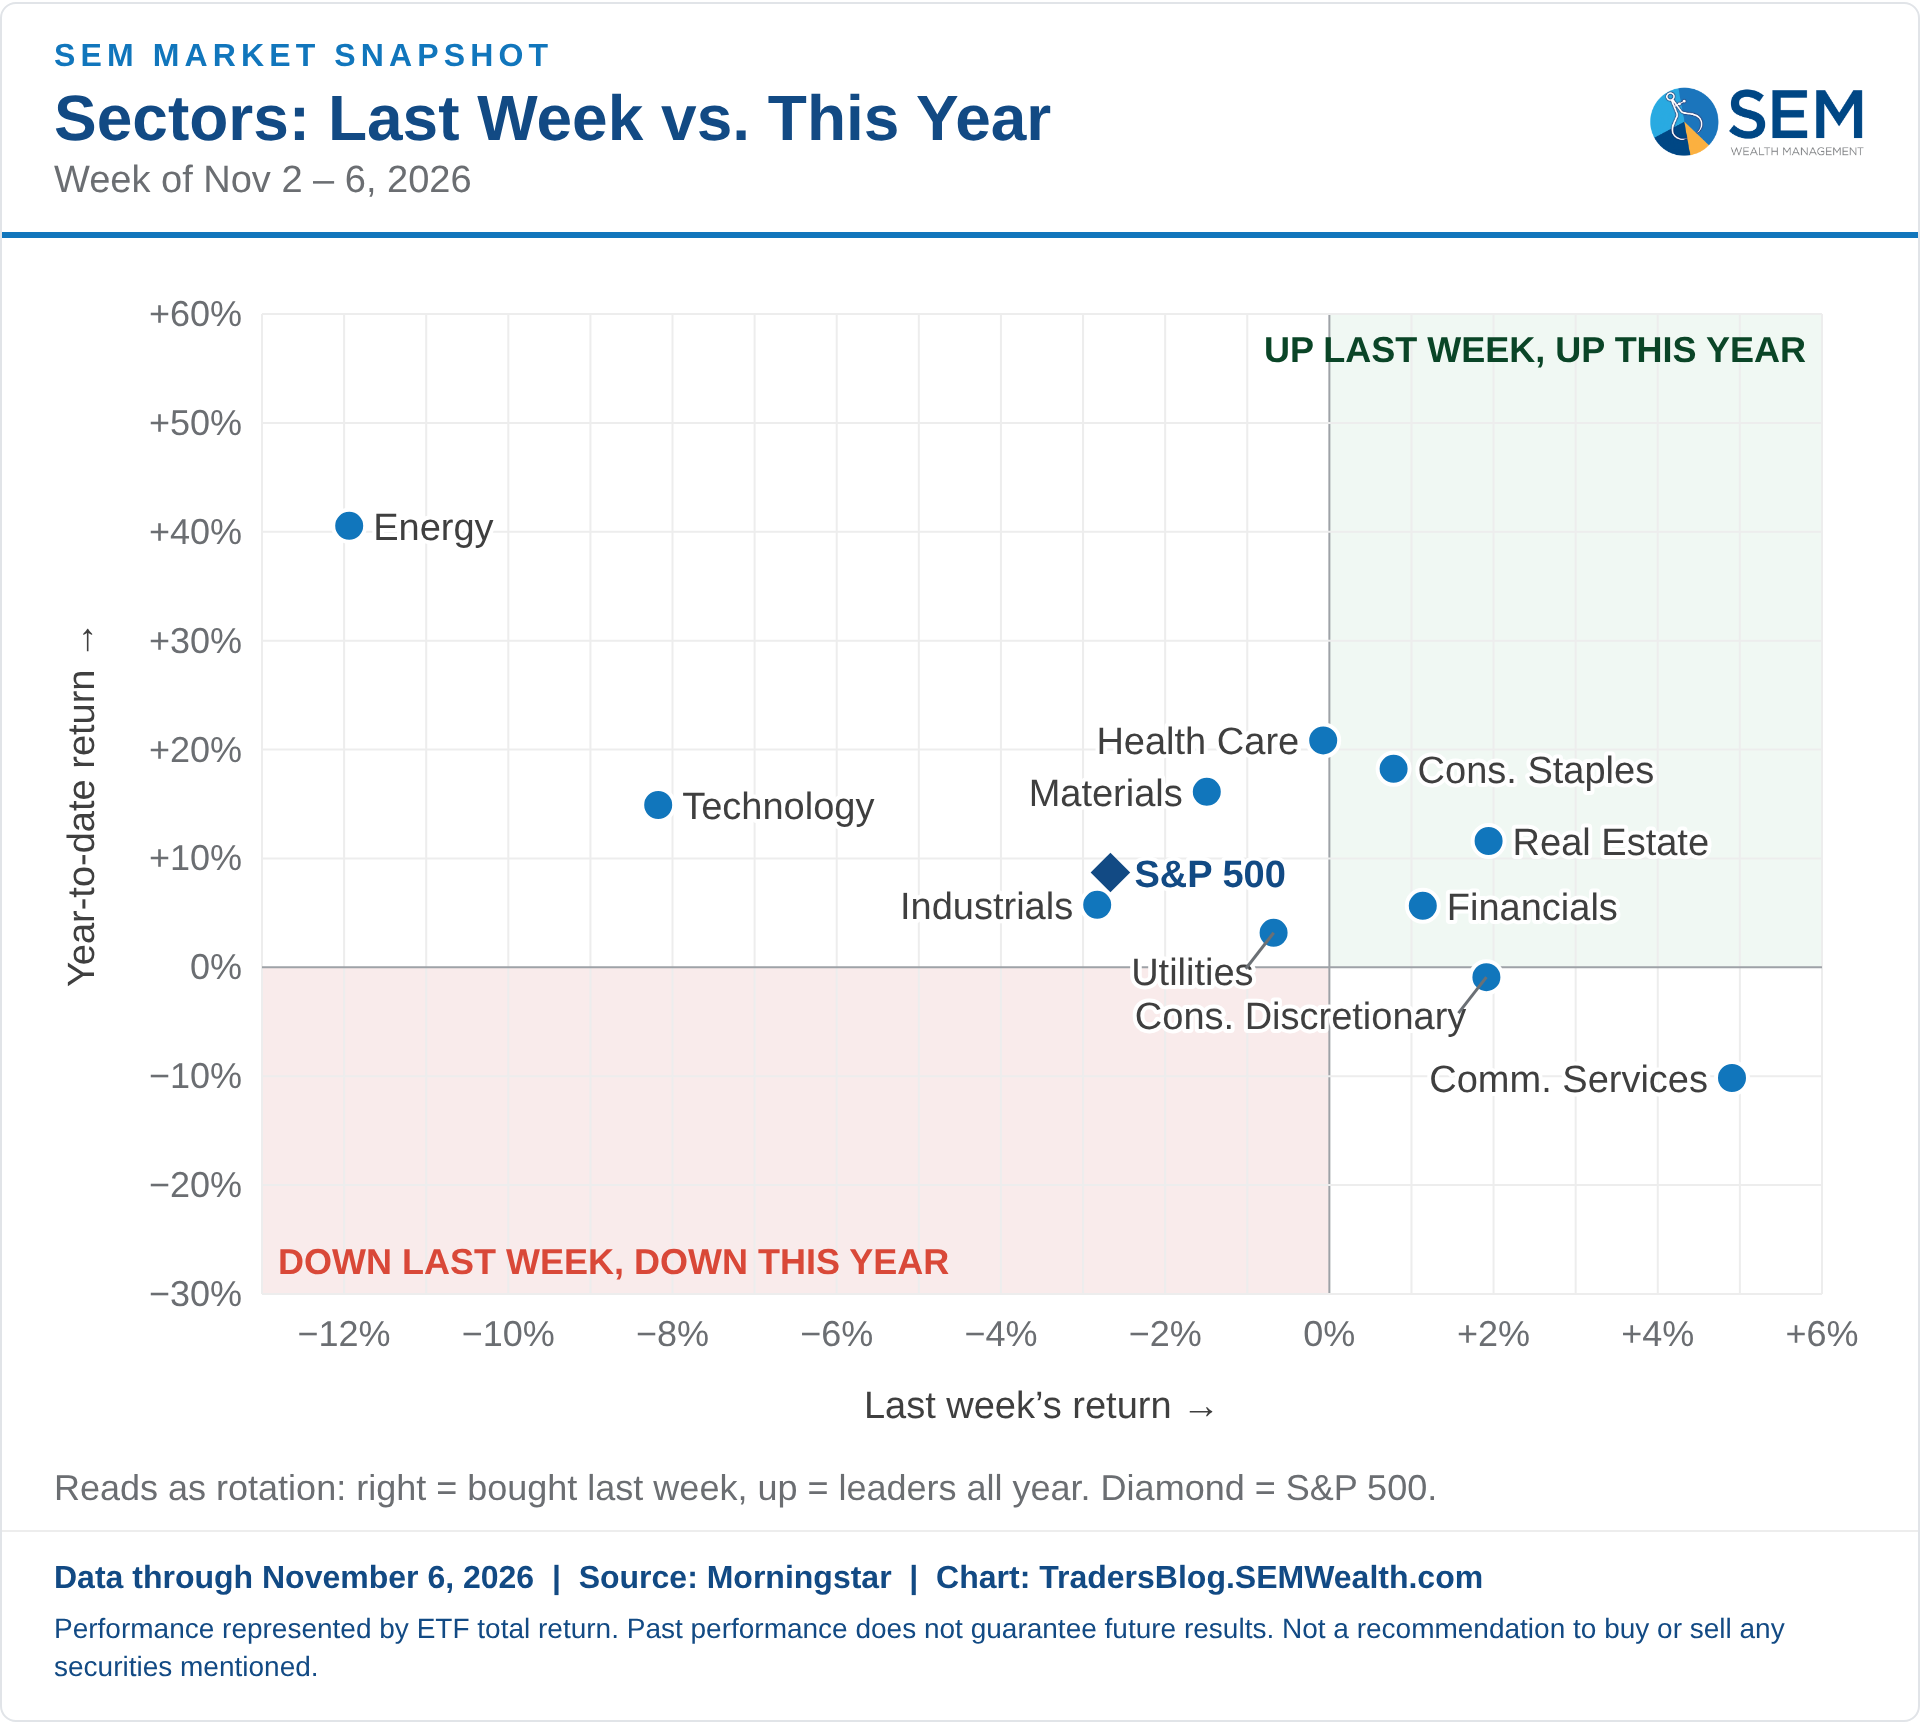
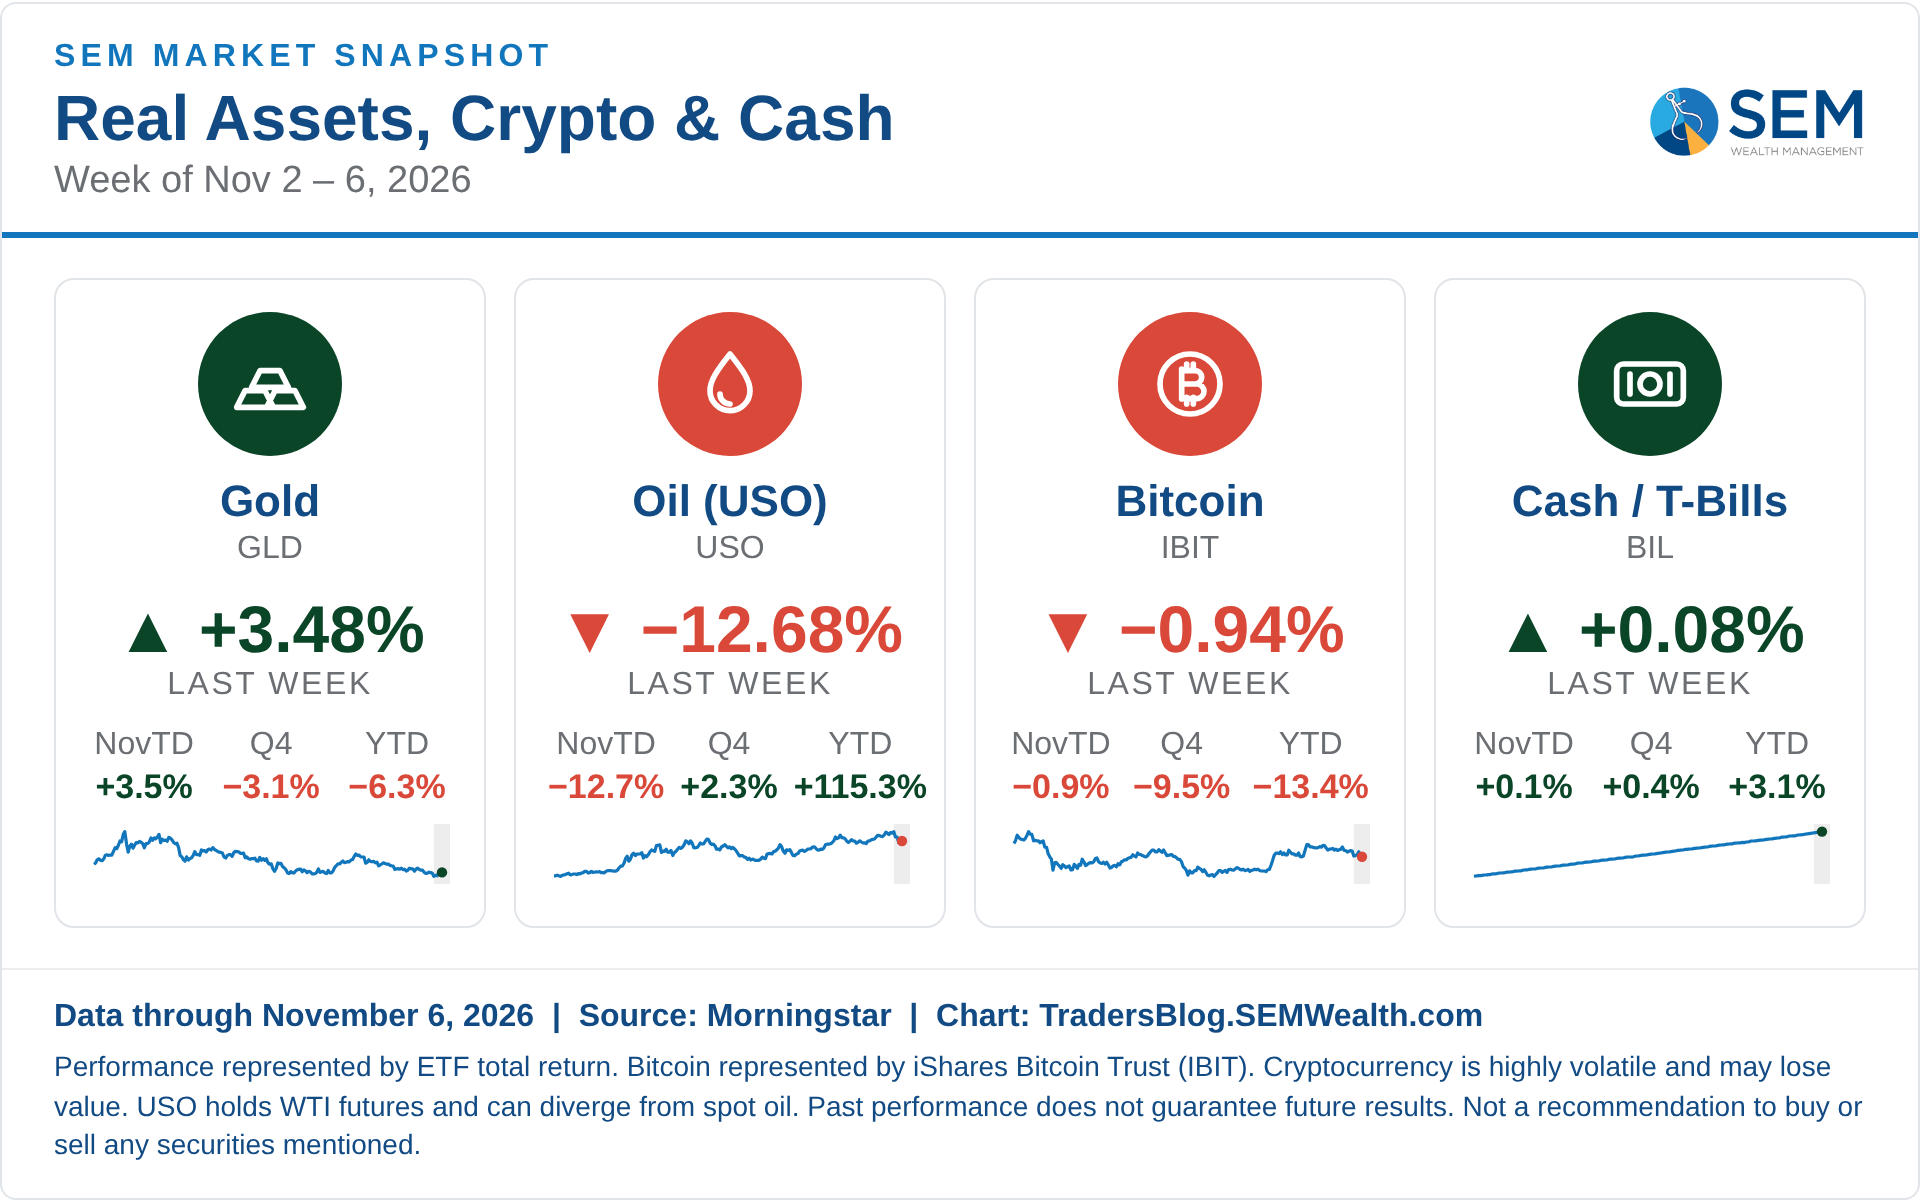
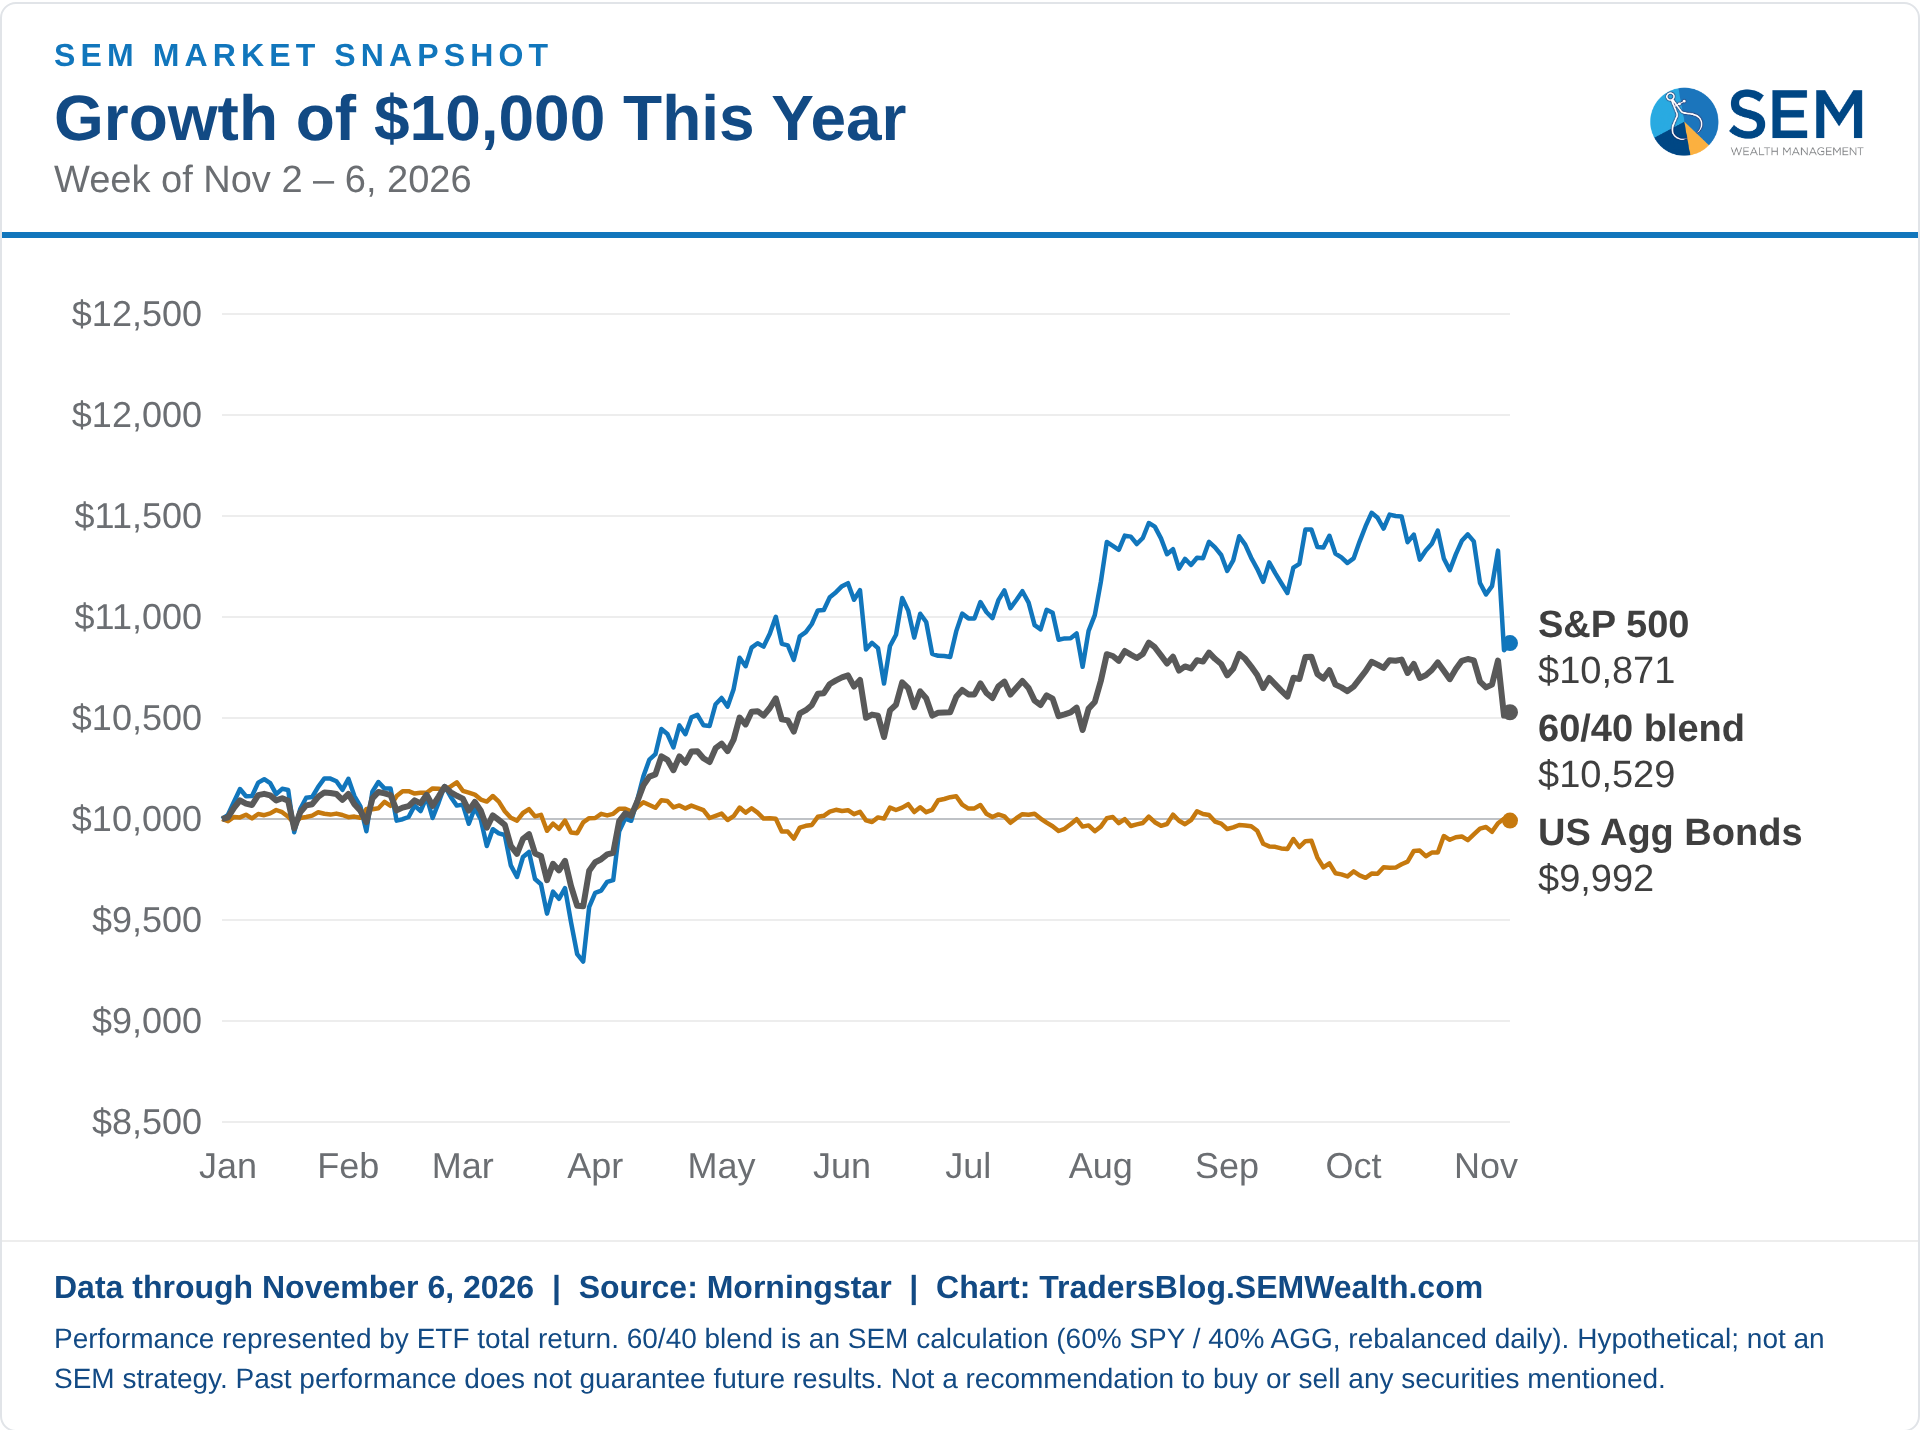
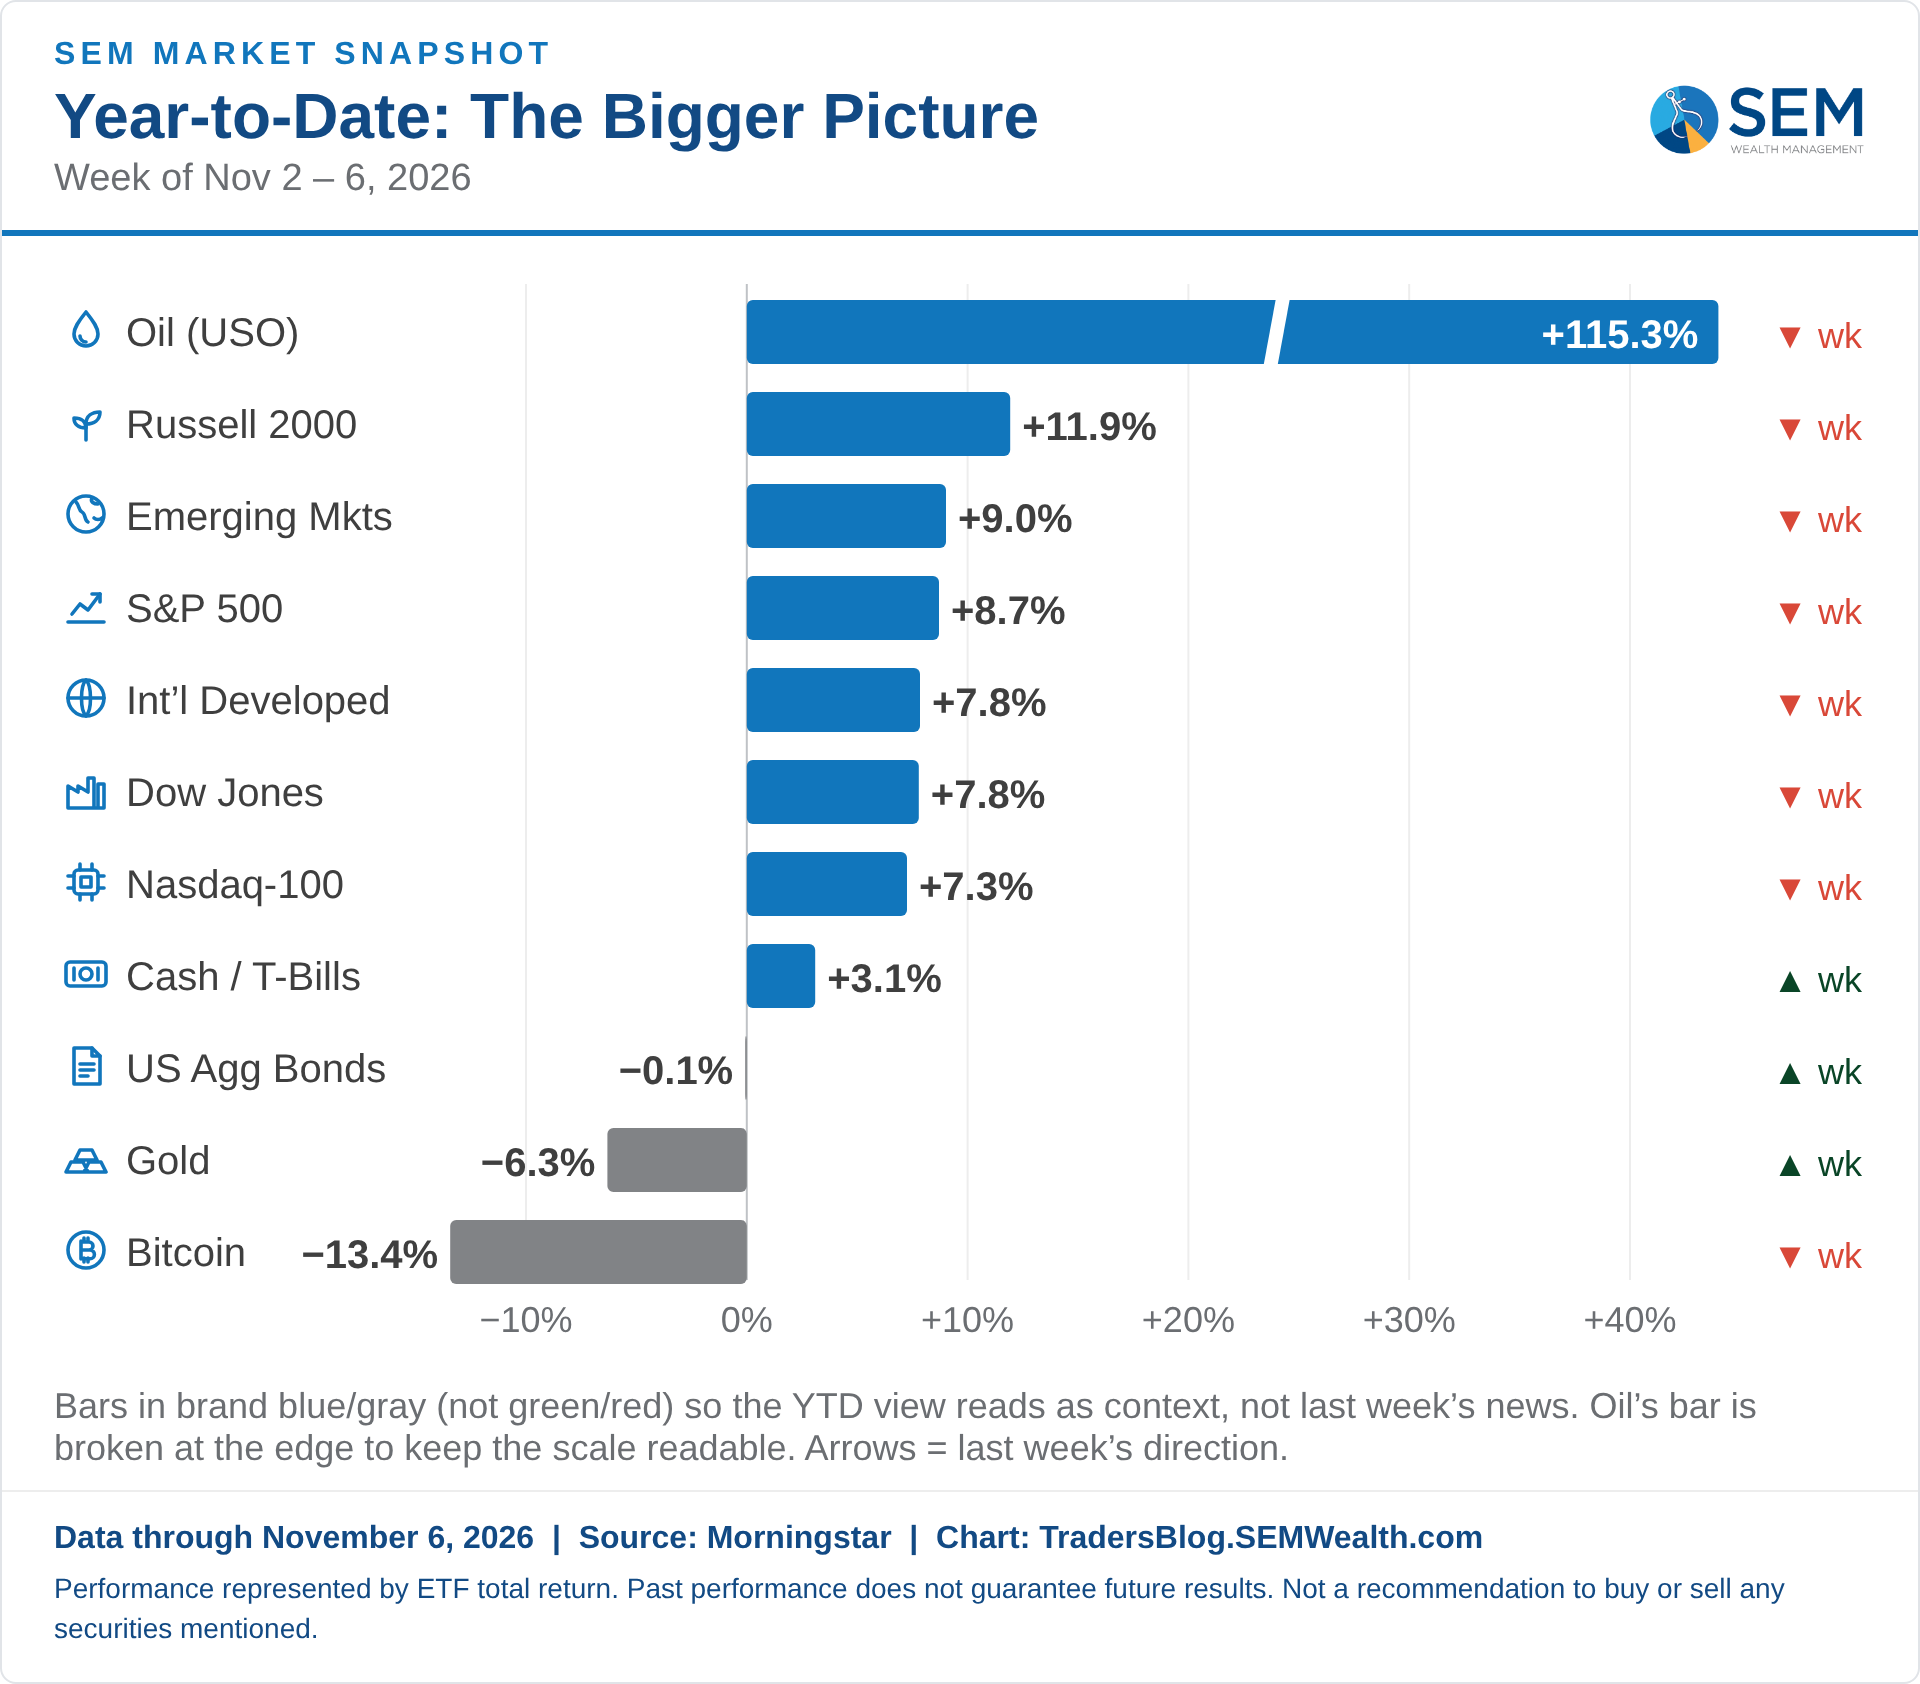
U.S. stocks were lower last week: the S&P 500 fell 2.7%, the Nasdaq-100 dropped 4.9%, the Dow fell 0.9% and small caps (Russell 2000) fell 2.0%. Value beat growth and small caps outpaced large caps, with large value holding up best in the style box (−0.5%) and mid growth worst (−5.8%); comm. services led the sectors (+4.9%) and energy lagged (−11.9%). Elsewhere, bonds edged up 0.4%, gold jumped 3.5%, oil dropped 12.7% and bitcoin fell 0.9%; the S&P 500 is up 8.7% so far this year.
SEM Market Positioning
SEM deploys 3 distinct approaches – Tactical, Dynamic, and Strategic. These systems have been described as 'daily, monthly, quarterly' given how often they may make adjustments. Here is where they each stand.
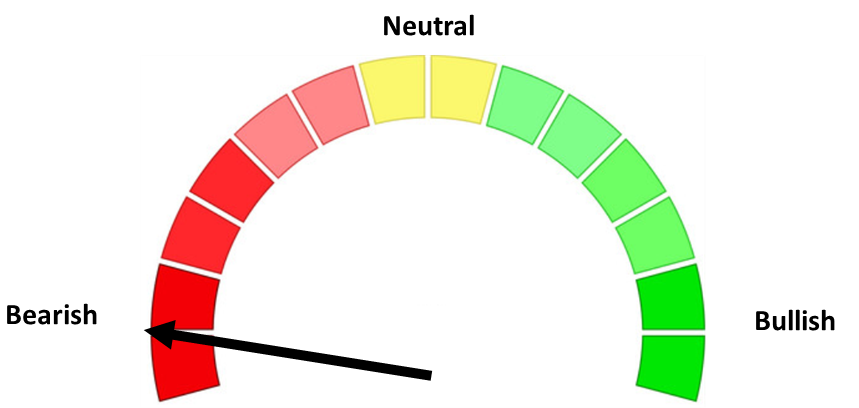
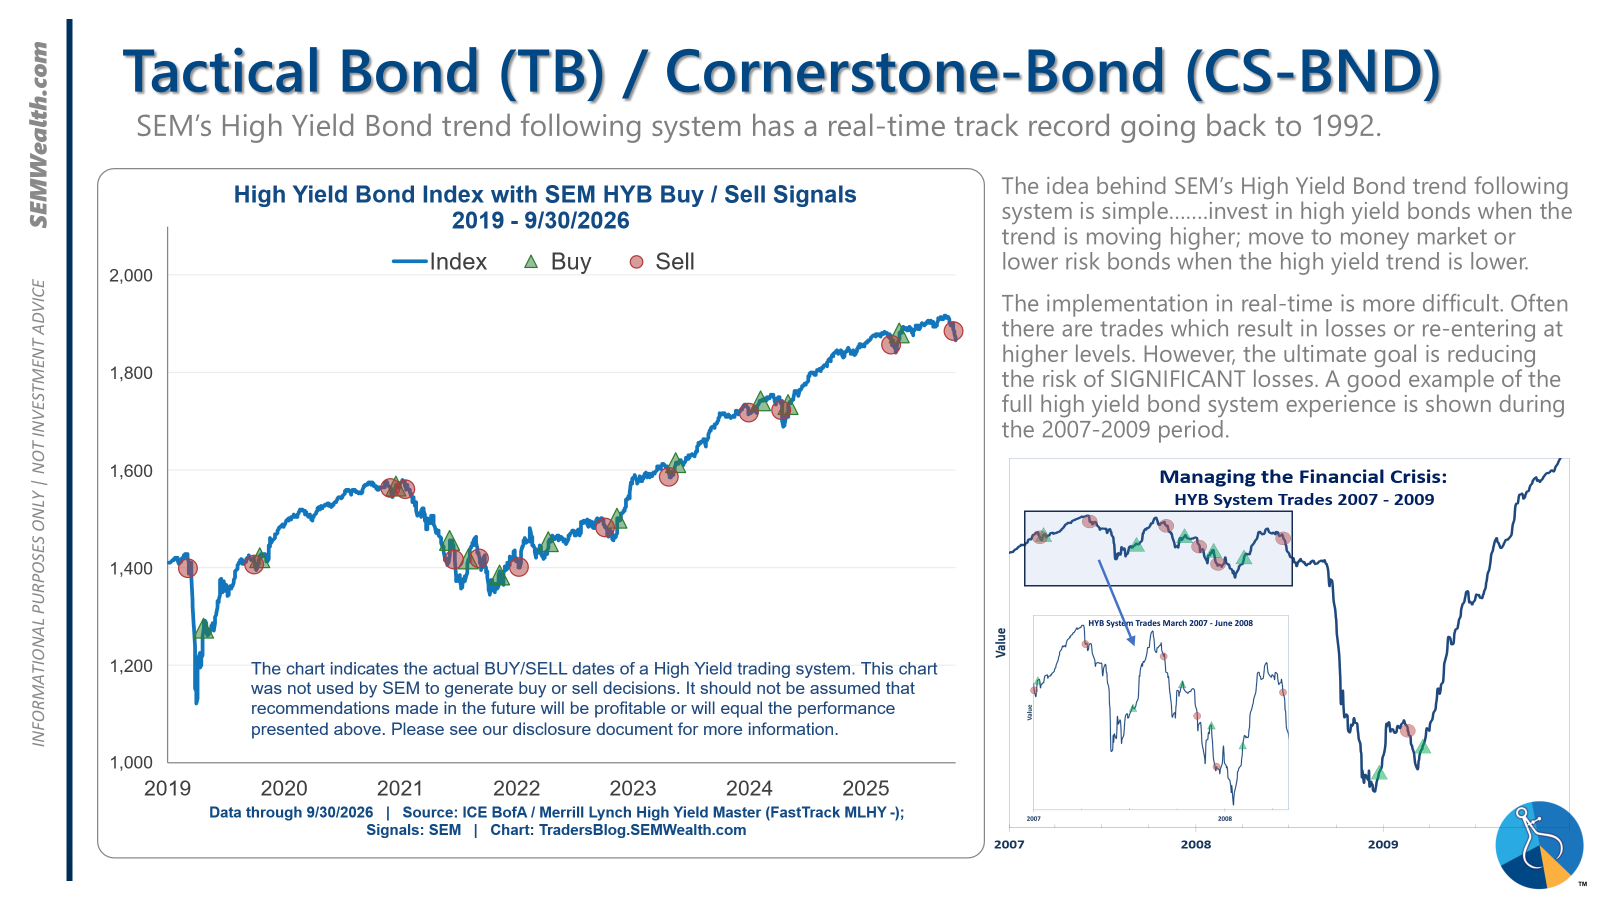
- Tactical = BEARISH (9/24/26) | 100% Money Market / Short Term Bonds (9/24/26) | High-yield trends reversed lower with spreads near historic lows.
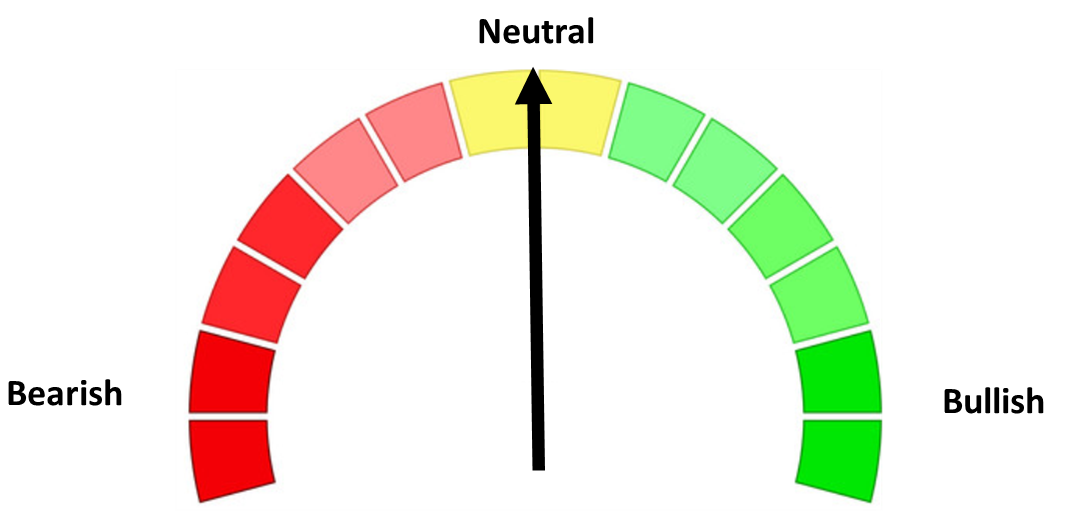
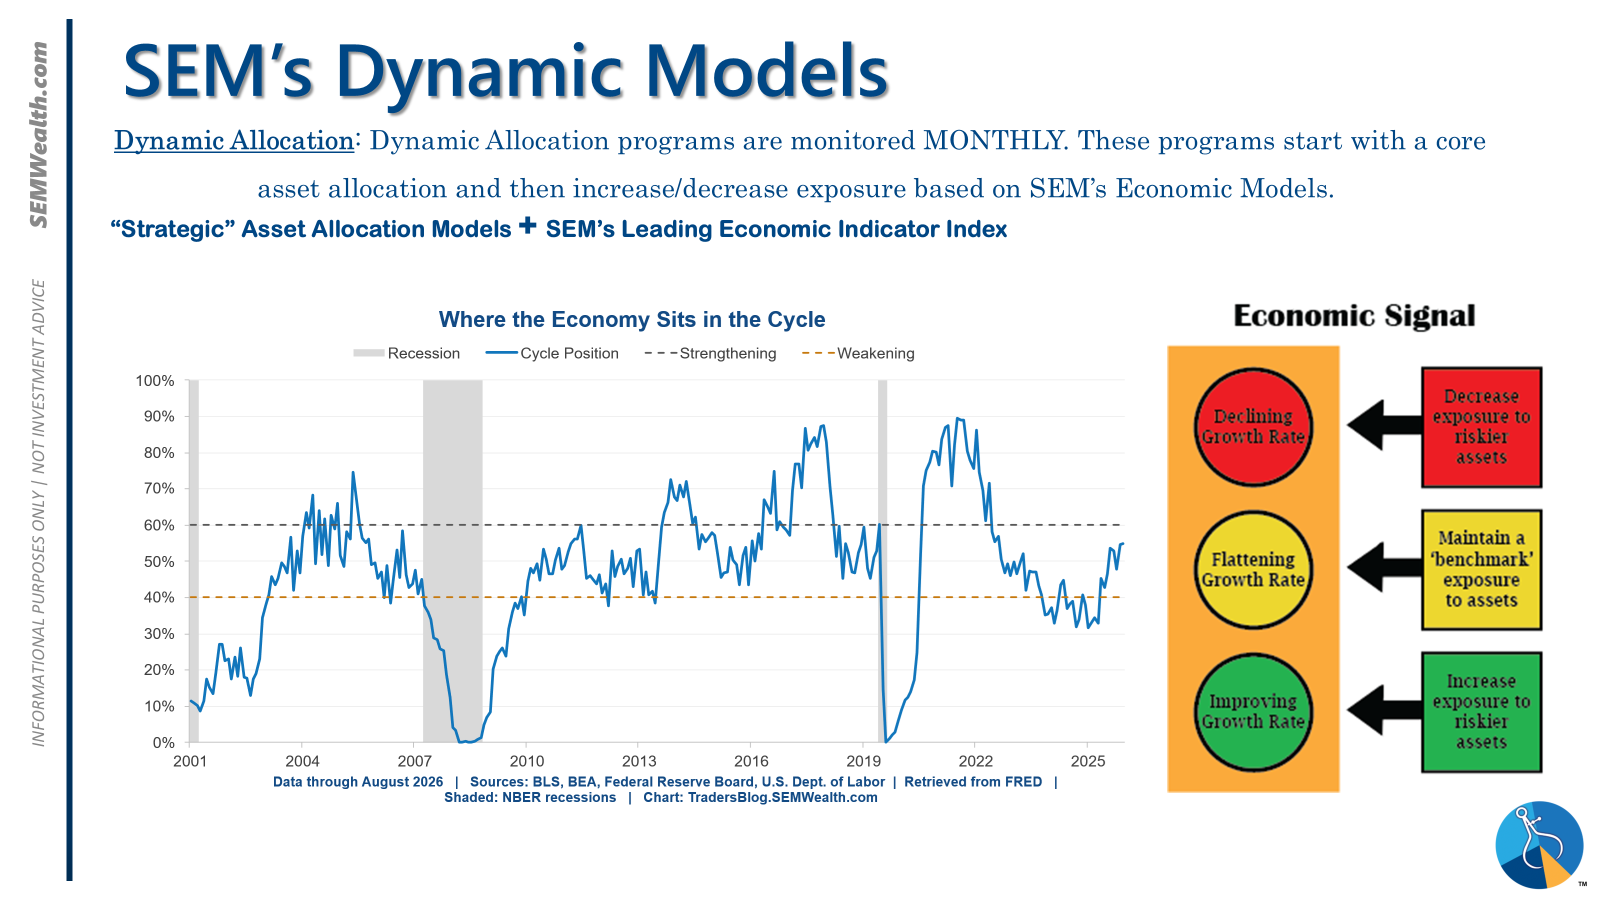
- Dynamic = NEUTRAL (2/15/2026) | "Benchmark" Allocation | Economic model inconclusive
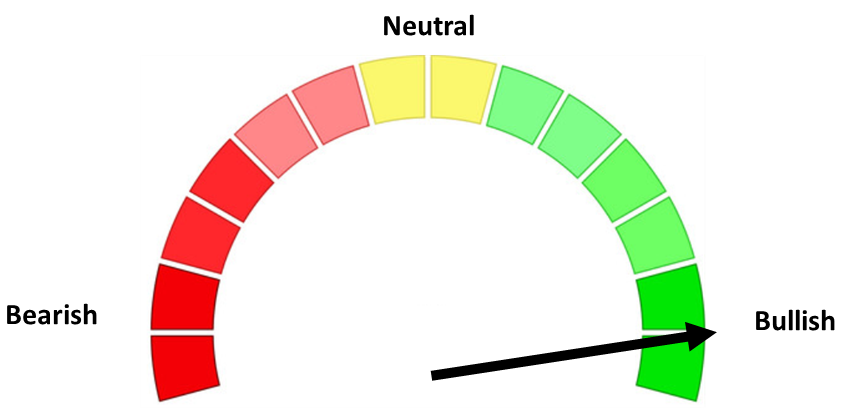
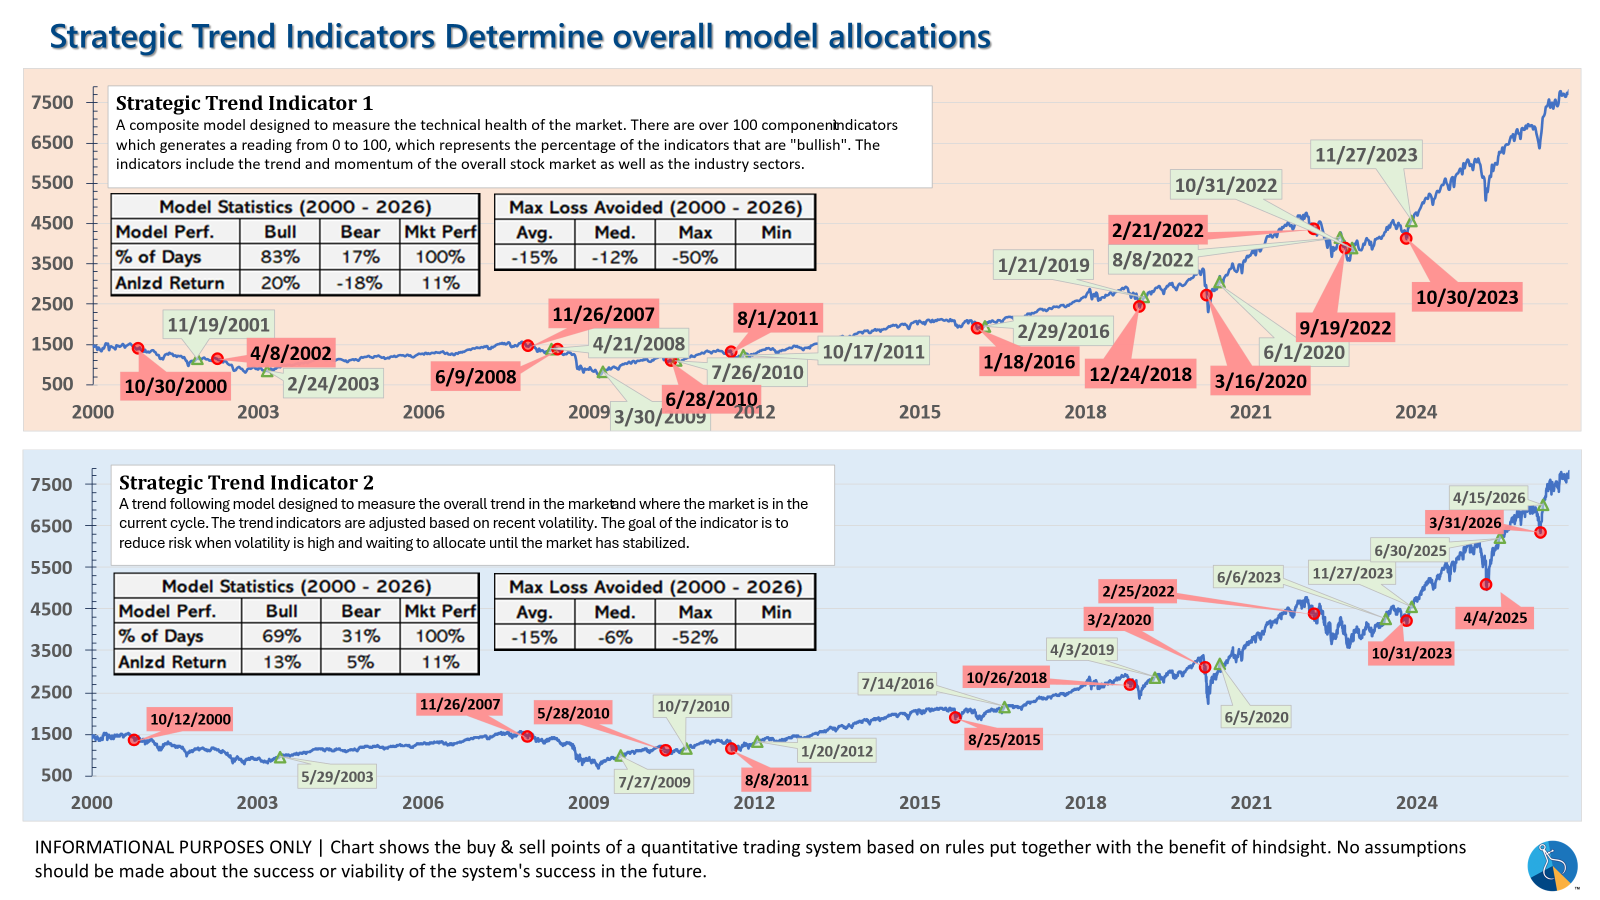
- Strategic = BULLISH (4/15/2026) | V-Bottom projecting "end" of Iran War
Tactical (daily):
- Monitored DAILY
- Models: Tactical Bond, Cornerstone Bond, Income Allocator, Tax Advantaged Bond
- Designed to follow the trends for use in our lower risk models
- SELL Signal issued September 24, 2026 (exiting the buy from April 8, 2026)
Dynamic (monthly):
- Monitored MONTHLY
- Models: All "Dynamic" Models (Income, Balanced, Aggressive Growth, and Asset Allocator)
- Uses SEM's Quantitative Economic Model
- Designed to overweight riskier assets if economic trend is higher & underweight those assets if economic trend is lower.
- NEUTRAL signal issued February 15, 2026 (following BEARISH signal from July 2025)
Strategic (quarterly)*:
- Monitored QUARTERLY
- Models: AmeriGuard (Balanced, Moderate, & Growth) and Cornerstone (Balanced & Growth)
- Core Component: Quantitative Filter using 4 different time horizons across universe of asset classes
- Trend Indicator: Two different Quantitative Systems monitoring the intermediate-term trend, health of the market, and volatility
- CORE eliminated small cap in AmeriGuard and reduced it in Cornerstone in October 2026; overweight international since October 2025.
- Both TREND INDICATORS are BULLISH following 10% drop and "V-Bottom" reversal in early April
- AmeriGuard & Cornerstone Max DO NOT use the Trend indicator and are always 100% invested in stocks using our CORE rotation model.
The core rotation is adjusted quarterly. To start the 4th quarter we saw all of our small cap position in AmeriGuard eliminated and the Cornerstone small cap position cut in half. We remain overweight international (at least for these models where the benchmark is 0% international).
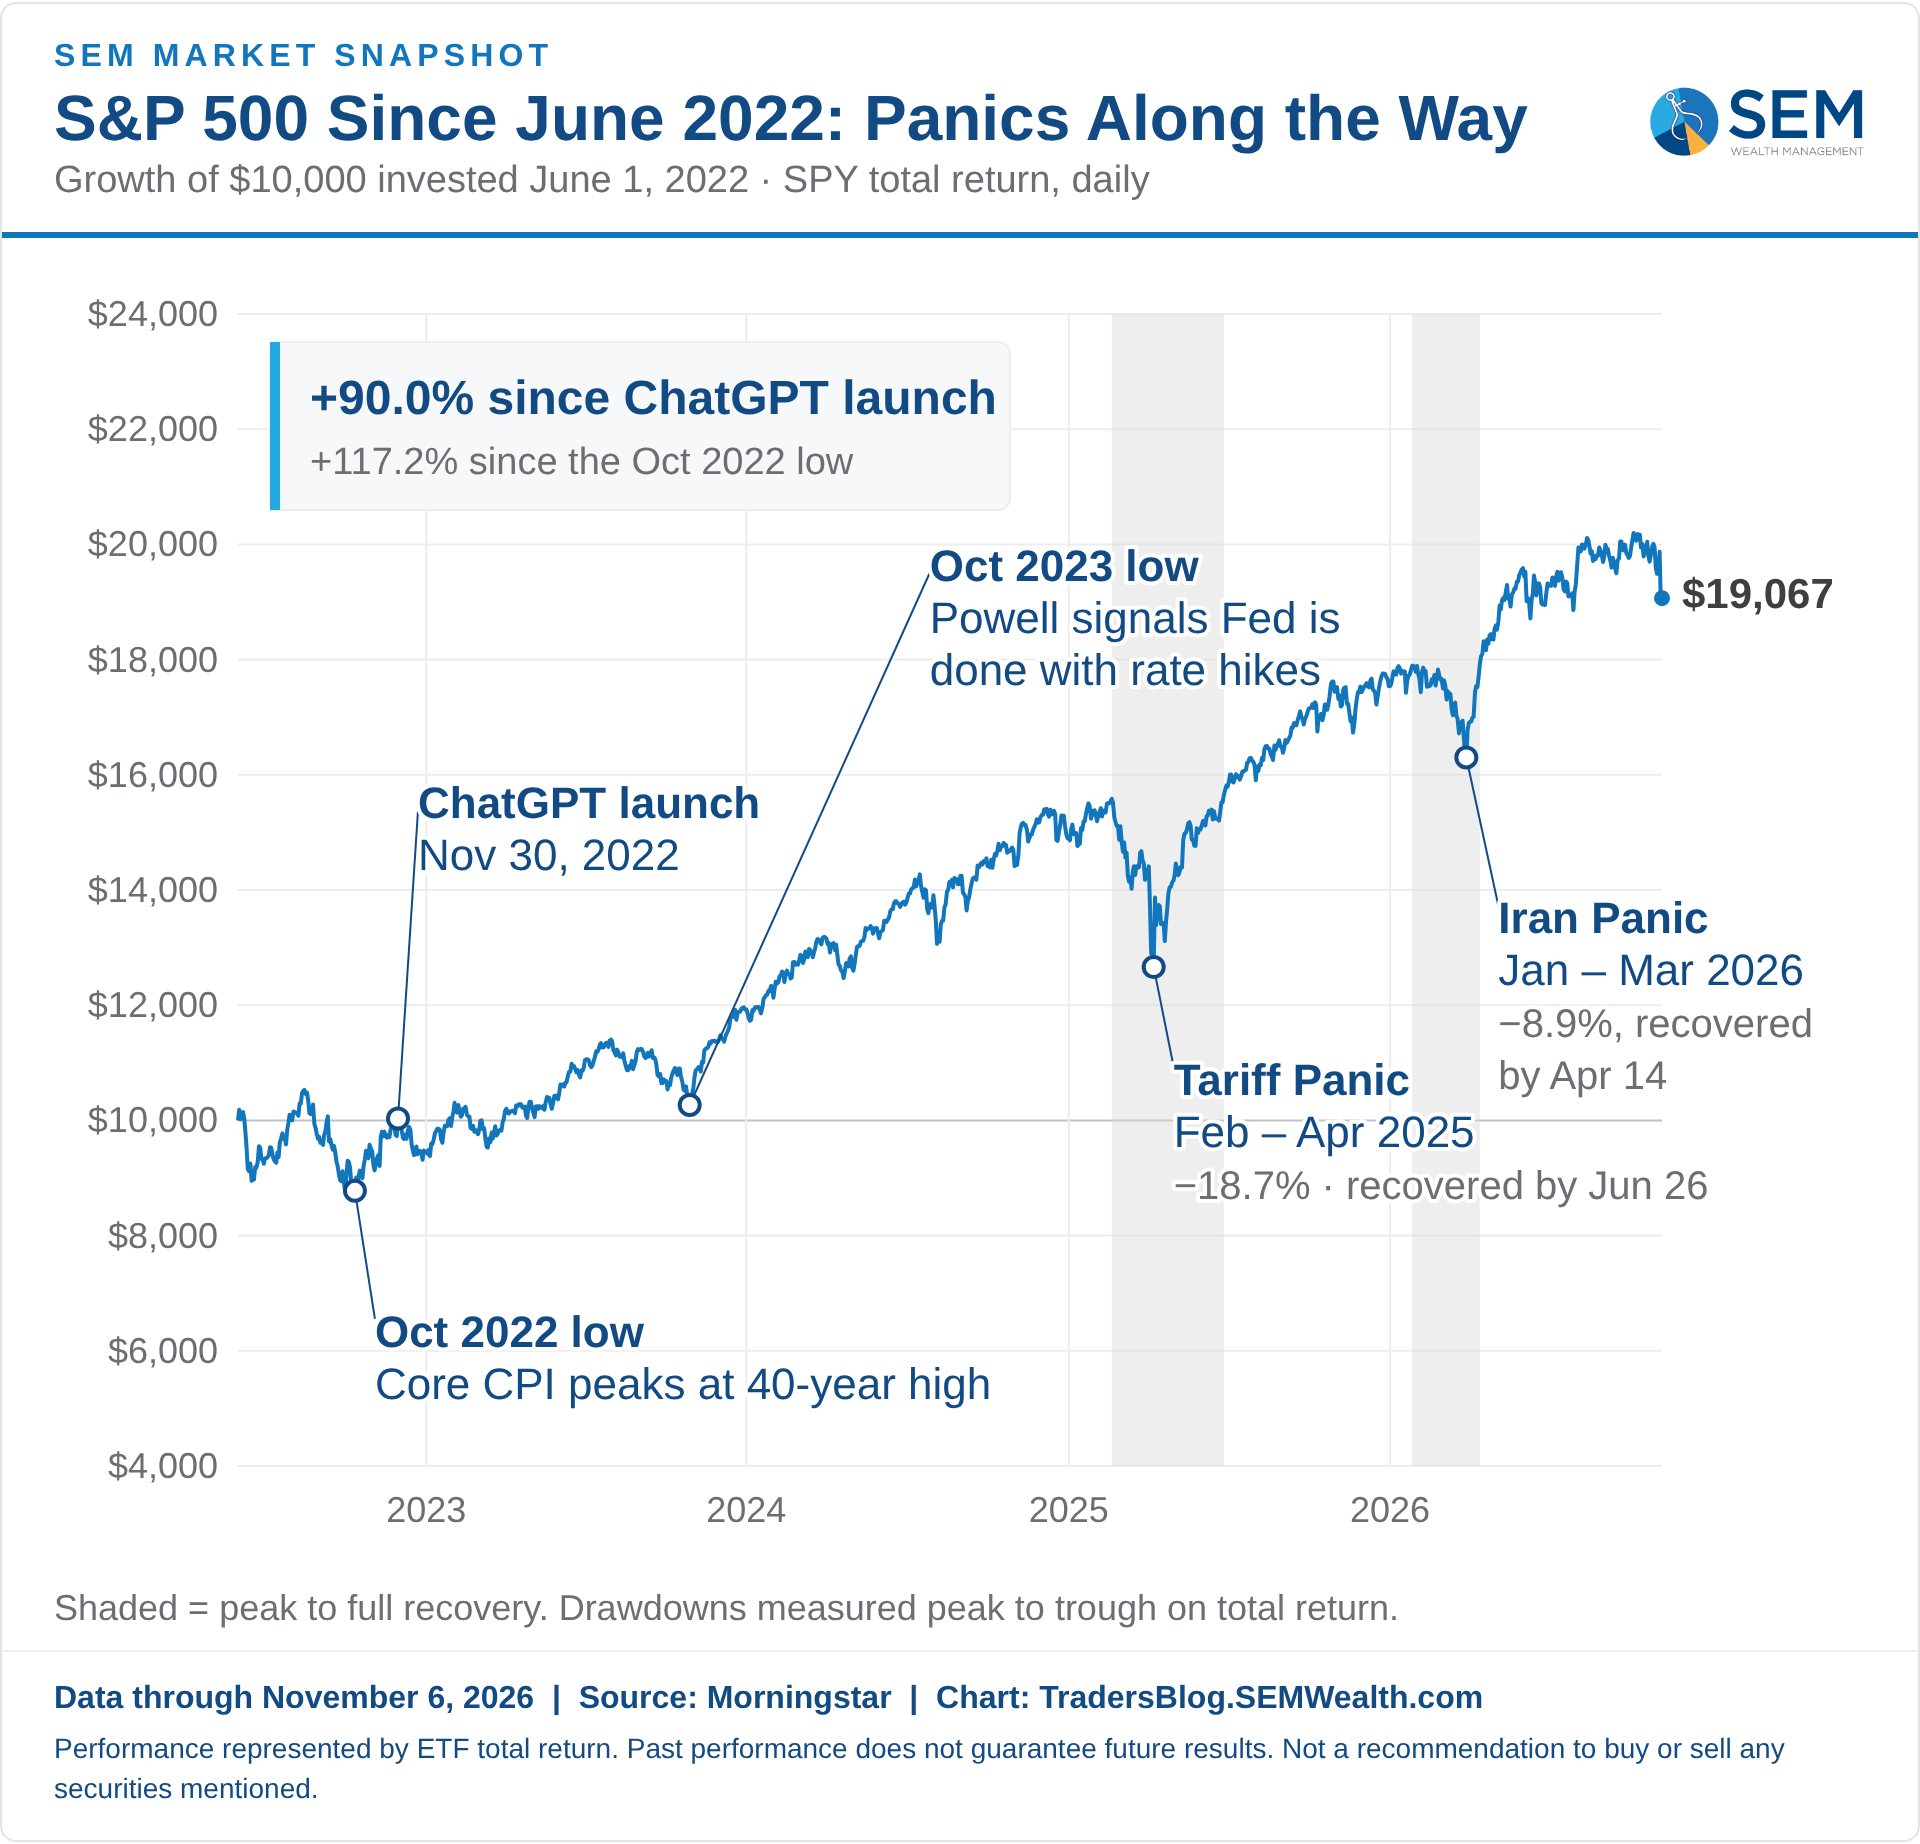
The * in quarterly is for the trend models. These models are watched daily but they trade infrequently based on readings of where each believes we are in the cycle. The trend systems can be susceptible to "whipsaws" as we saw with the sell and buy signals in the spring of 2025 and 2026. The goal of the systems is to miss major downturns in the market. Risks are high when the market has been stampeding higher as it has done since 2023. This means sometimes selling too soon. If "wrong", the systems can quickly reverse.
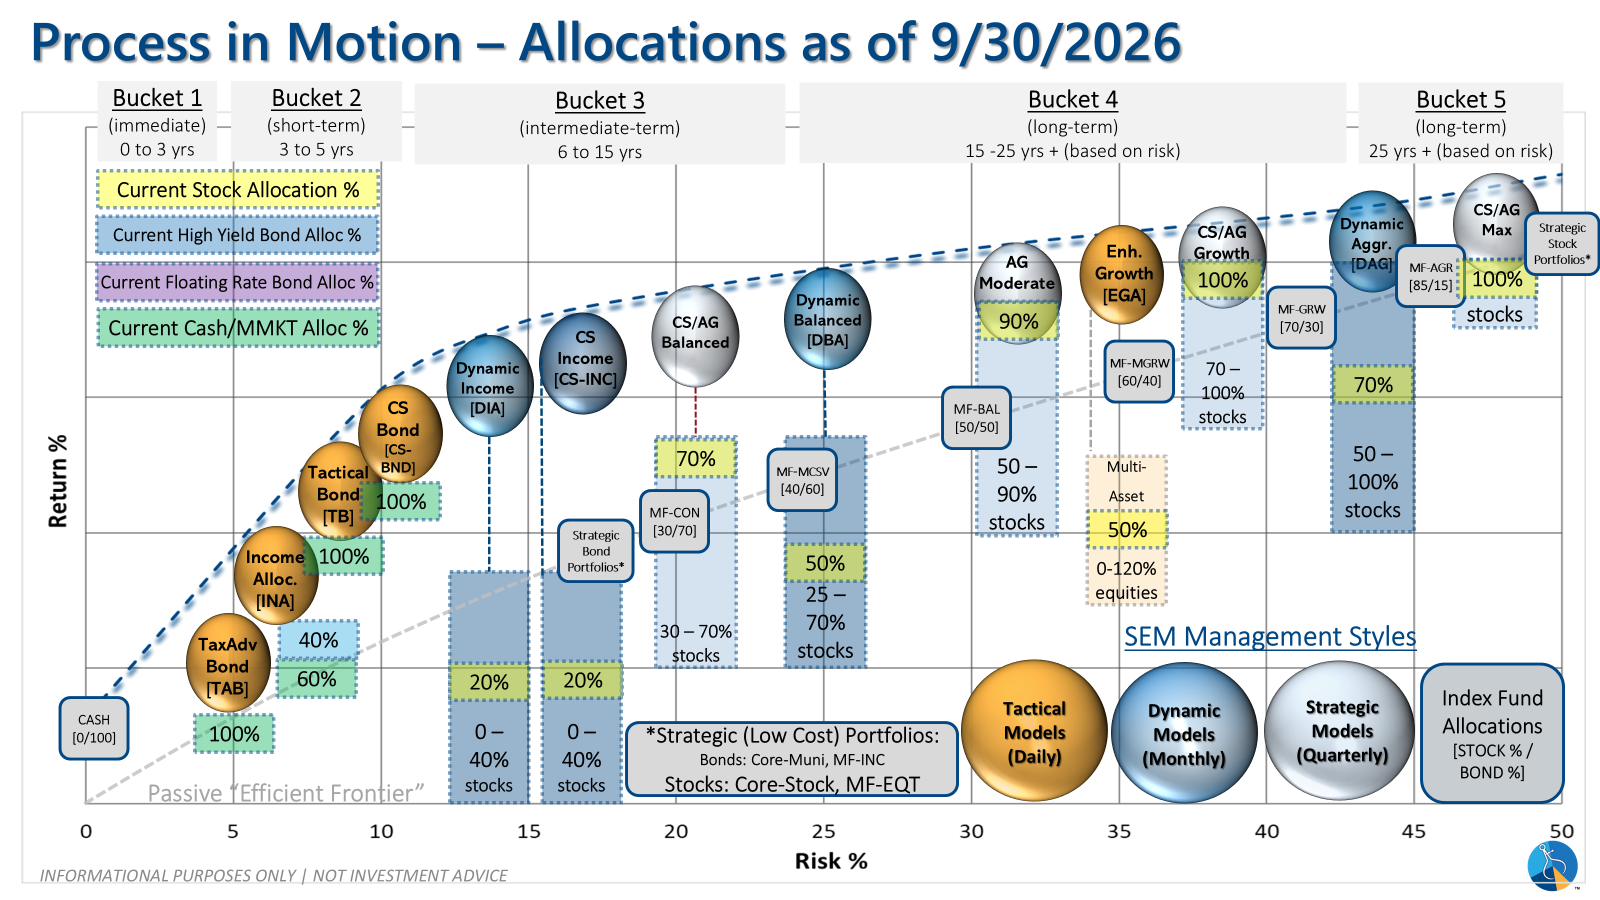
Overall, this is how our various models stack up based on the last allocation change:
Curious if your current investment allocation aligns with your overall objectives and risk tolerance?