
The bulls seem to be emboldened once again. They seemed to have a meeting to push out the most misleading chart for investors — the consequences of missing the best days in the stock market. Many are doing this in the name of “behavioral finance”, believing if you tell people what they should do and show them the data of what happens if they didn’t they will do what they are told. If this were true we wouldn’t need seat belt laws, drunk driving laws, or have an obesity epidemic in our country.
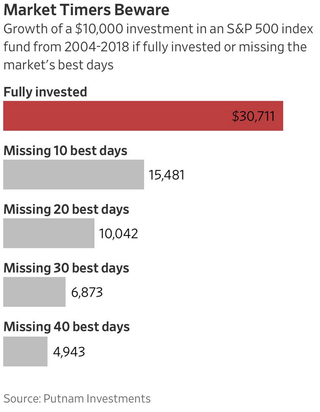
I’ve seen quite a few of these charts floating around the past month. Here The chart to the right is one from Putnam.
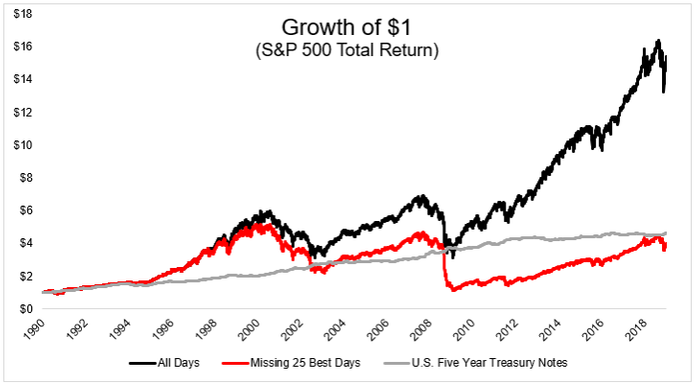
The folks at the Irrelevant Investor put the data into a line chart.
Informational purposes only — see disclaimer at bottom of page
Those numbers are impressive! We SHOULD stay invested ALWAYS. We should also stop eating so much candy, drinking soda, eating all the food on our plate (platter or hub cap) at a restaurant, or stopping at any fast food place. We all do what’s best for us right?
What’s interesting as you dig into the data is you find 47 of the best 50 days going back to 1997 occurred when the S&P 500 was below the 200 day moving average. While not an indicator we use at SEM, it is a decent way for somebody to determine whether or not we are in a bull or bear market. What this means is something we’ve warned our clients and advisors about all along:
The most furious rallies tend to occur in the midst of a bear market.
Guess what? The biggest down days also tend to occur in the midst of a bear market. What this means is if you missed the biggest up days you also most likely missed the biggest down days.
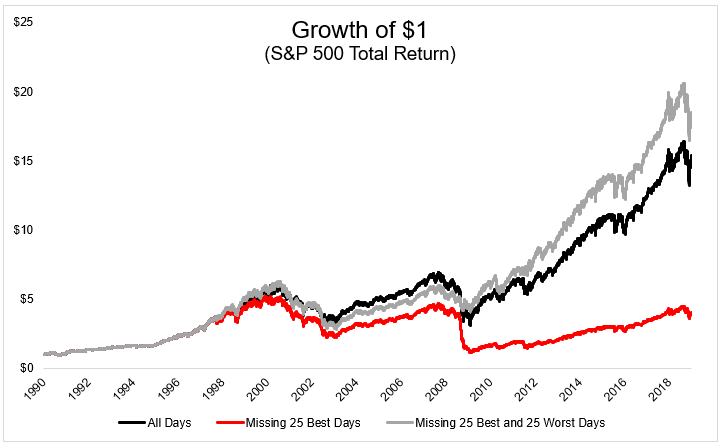
Here is what happens if you missed both the biggest up days and the biggest down days.
Informational purposes only — see disclaimer at bottom of page
So not only do you have higher returns than a buy & hold strategy, but most importantly you avoided the emotional pain of being fully invested during a recessionary bear market. Whether you’re an individual investor or a financial advisor, you have one thing in common — we’re all human and humans are emotional and do not always do what they SHOULD do.
Since our founding in 1992, SEM has realized the best way for investors to hit their long-term goals and enjoy the benefits of the stock market is to manage around their human behavior. We fully realize we will not be all the way invested during bull markets, but at the same time it is highly likely we will have minimum exposure to stocks in the depths of a bear market.
We also know indicators like the 200 day moving average or any of the trading systems SEM utilizes will not always work, which is why we advocate a diversified approach — multiple investment management styles (tactical, dynamic, & strategic), multiple investment models, with multiple trading systems inside each model.
This chart shows the general philosophy behind our portfolio allocations. As you can see, the design is to miss some of the upside while attempting to miss most of the downside. In other words, we will most likely miss the best days as well as most of the down days.
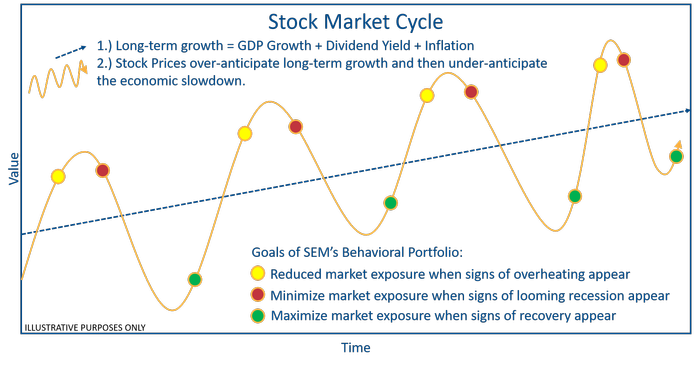
The next time you hear somebody use the statistic about missing the best days, ask them what happens if you also miss the worst days.


