
The stock market continues to trade around record highs. We saw strong GDP growth, some impressive corporate earnings, a big spike in travel, and some large areas announcing full re-openings in the coming months. The news and data last week should have led to some stronger stock market returns. The fact we didn't see those moves tells us one thing — all of this was expected.
The market has moved significantly higher in the past 12 months on all of these expectations. This means going forward investors need to be asking, "will it get better than this?" We've discussed this in detail the past few months. The key thing to watch will be the 4 pillars of this rally. Any cracks and we could see big drops in stock prices.
Here's a quick rundown of those pillars:
1.) Federal Reserve Support
The Fed ended their latest meeting on Wednesday with no announced changes and pretty much said they don't plan on putting on the breaks until late 2022 or even into 2023. To use a word common in our household, "A metric crap ton" of money has been created to fight the pandemic.
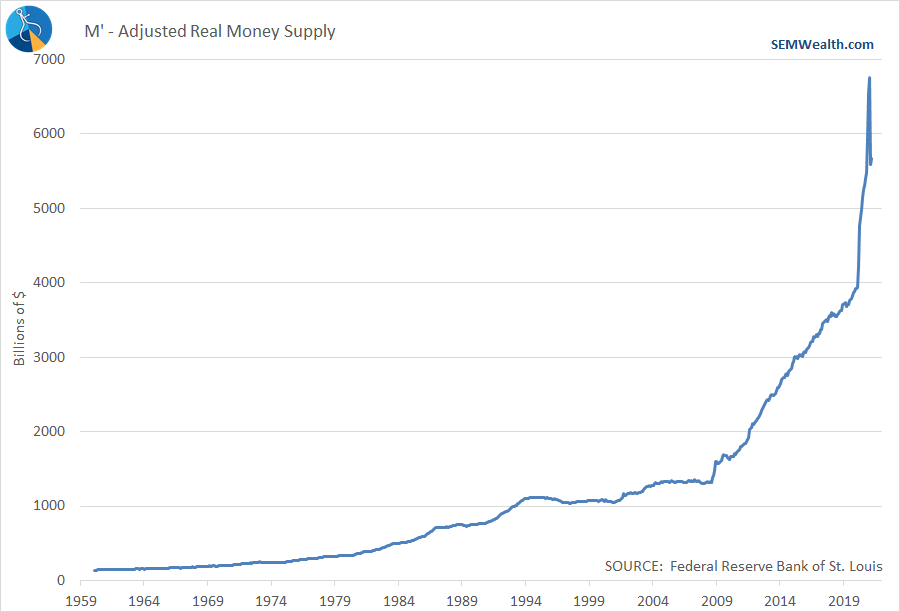
They've let the money supply pull back just a bit, but it barely registers on the chart. A lot of the discussion after the Fed meeting was towards inflation. I've gone on record saying the Fed is "tone deaf" because they do not understand the underlying inflation in the economy and how much it is hurting the fringes. This is partially due to the way inflation is measured and partially due to the fact the Fed has failed miserably to spark any sort of inflation the past 10 years. They simply do not understand the problem.
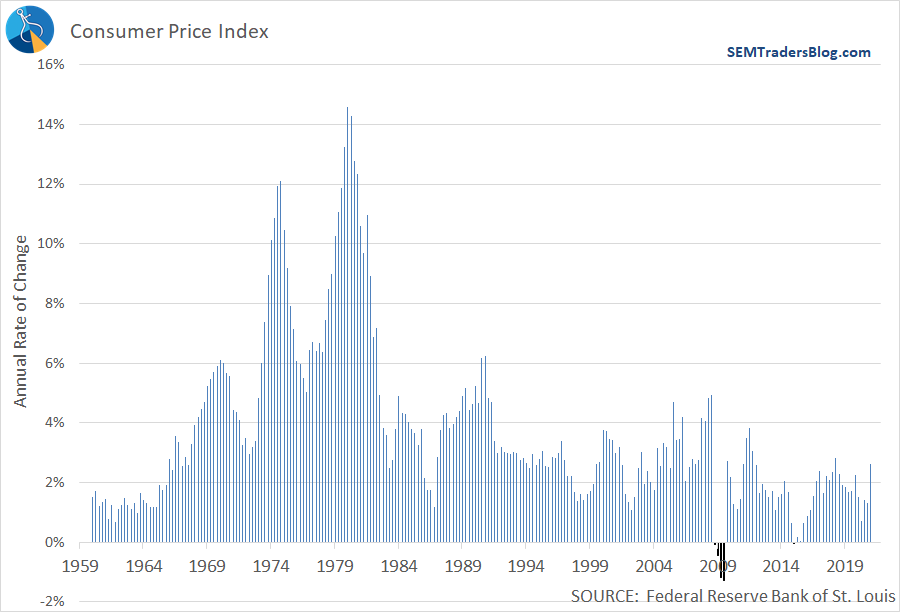
Chair Powell acknowledged inflation numbers will go up, but only because the prior year numbers were artificially low. Remember when you look at this chart the Fed's inflation target used to be 2-3%. They are likely going to keep pushing things until we get closer to 3% for several consecutive months. That could be a ways down the road.
2.) Congressional Spending
Last week President Biden announced his "American Families Recovery Act". I won't go into the details since like the infrastructure plan is only a roadmap. Congress in their various committees will work on the rest. As we know, nobody knows what kind of jumbled bill we will see. I expect at least 500 pages for each bill, if not thousands.
What we do know is the tax revenue will not be enough to cover the cost. The President seems to be sticking to his promise to not raise taxes on anybody making more than $400K per year. The problem is, the Democrats are learning there simply isn't enough tax revenue to cover their spending. This means they are going to add even more to the deficit.
What is being missed is the increasing drag all of the deficit spending the past few decades is having on growth. Remember, debt unless used to invest in order to create FUTURE GROWTH is simply future spending pulled forward. Let's look at the GDP Growth rates over some key periods:
- 1950-Present: 3.25%
- 1990-2000: 2.99%
- 2003-2007: 2.93%
- 2009-2019: 2.32%
Notice the trend? Each recovery we've spent more and more money to "stimulate" the economy yet we're getting less and less growth. The biggest problem is all budget projections (including those for Medicare and Social Security) assume AVERAGE growth of 3%. I'm not sure when we'll get back to 3%, but the more debt we use during an economic recovery the less likely that will happen.
3.) Improving Economy
Over the short-term the economy is certainly improving. The trillions of dollars in stimulus has sparked massive jumps in income and consumer spending.
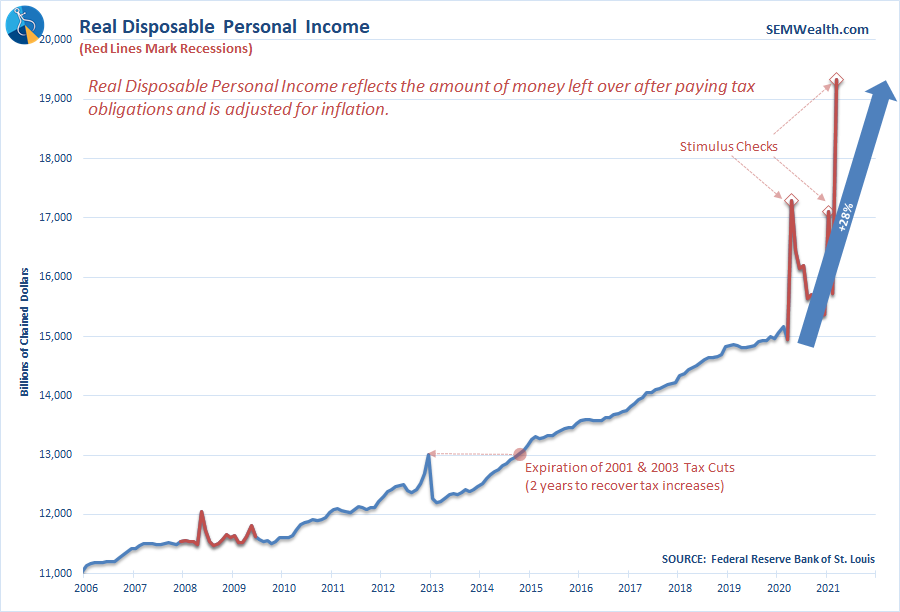
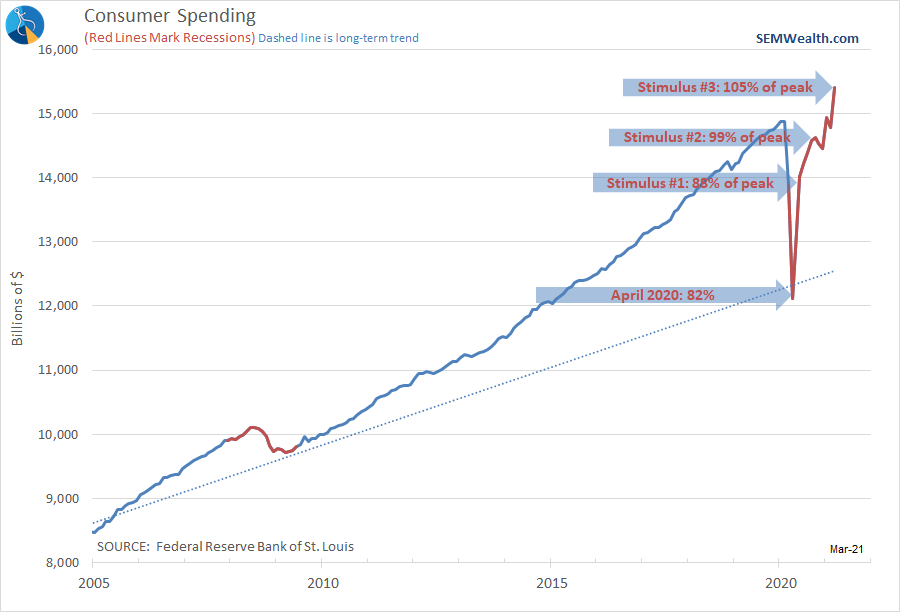
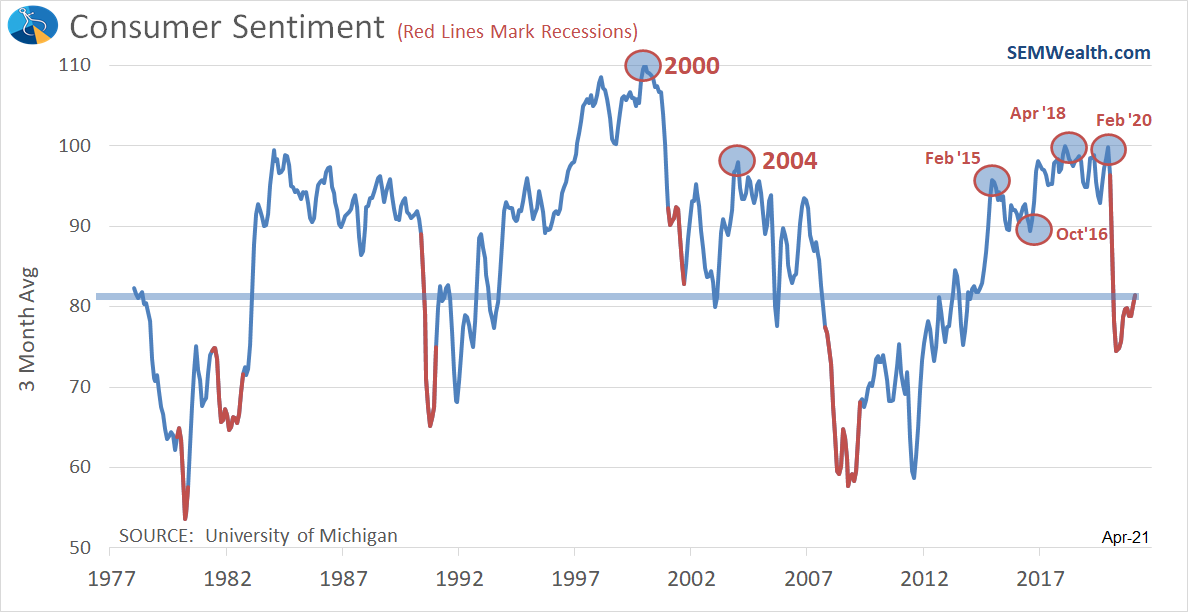
What is interesting about this is while consumers are spending money we haven't seen a significant jump in consumer sentiment. Without big improvements here, the boost from the stimulus will be very short lived.
As I have to do often, remember the way they measure GDP is different than any other financial metric. They essentially take the last 3 months and compound it for the next 3 quarters (after factoring in "seasonal" adjustments). This is highly misleading. This chart shows the official GDP number (orange bars) with the 1-year change (blue line).
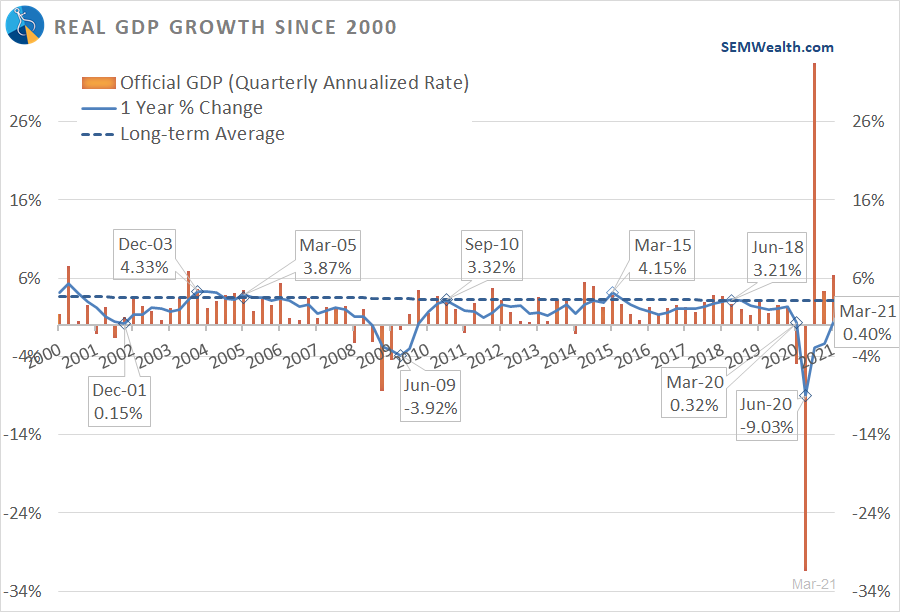
The dashed blue line is the long-term average. Note how the economy has struggled to hit the average over the past 20 years. What will be important going forward is to see whether the solid blue line can bust through the dashed line for a sustained period of time. My bet is it won't and we'll be looking at a recession in late 2022 or early 2023 when all the stimulus wears off.
4.) Vaccine Distribution / COVID Cases
In the US even the hot spots seem to have cooled down. The large vaccine distribution sites are now shutting down in areas where demand is no longer there. The question in the fall/winter will be whether or not enough people were vaccinated and/or already were immune to hold off any more spikes.
The concern is any spikes will lead to lower than expected economic growth.
Odds are Not in Your Favor
Regardless of your opinion above, if you are a buy and hold investor you should be concerned. Your chances of making even average returns from today through the next 10 years are quite low. Your chances of going through a very large drop as prices adjust to economic reality are quite high. Buy low/sell high, not buy high/sell higher.
We're hearing a lot as we start the week from Warren Buffet following the annual Berkshire Hathaway shareholders meeting. There were a lot of good tidbits out. I hope to watch the replay sometime this week. I'd be remiss if I didn't share the updated Buffet Indicator data following the first quarter GDP. For those of you unfamiliar, in 2000, Mr. Buffet was asked what his favorite valuation indicator was. It all came down to simple economics – take the market capitalization divided by the economic output. Over the long-term your markets cannot outperform the economy. Investors will demand a better return on their investment and move their capital elsewhere.
The Buffet Indicator is by far the most accurate I've studied in predicting 10 year forward returns. Here's how you read this chart – find the starting Buffet Indicator and slide to the left to find your expected 10-year returns. The Buffet Indicator is now at a whopping 1.99 — way off the chart. The expected annualized return over 10 years is -11%.
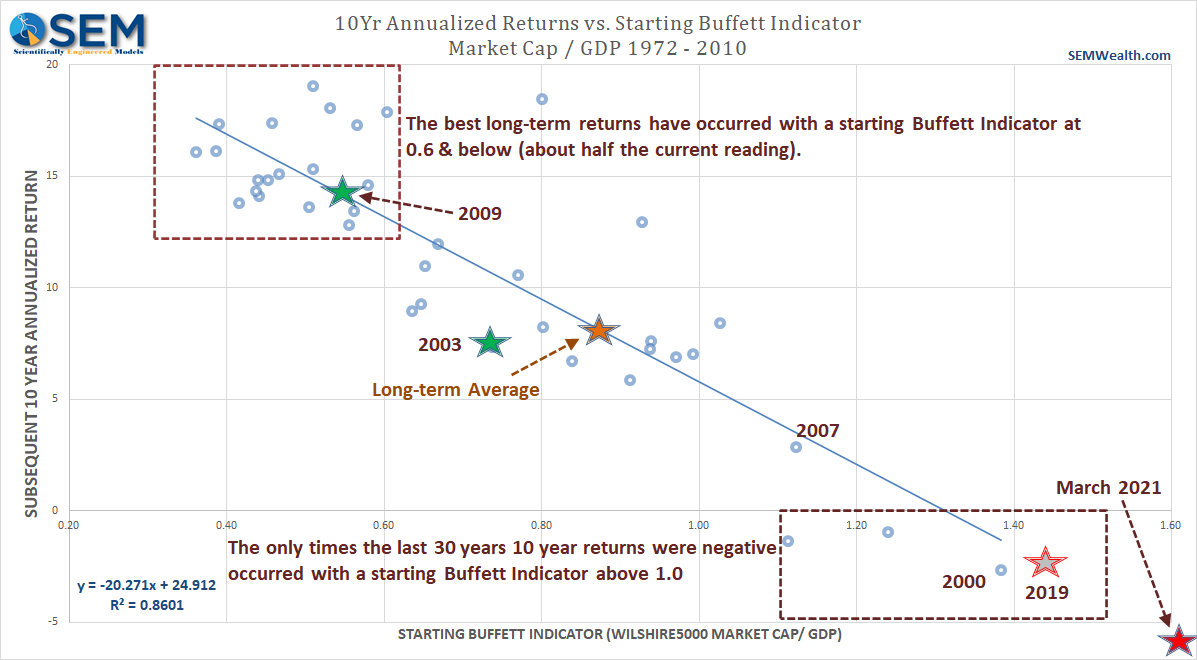
In 2000, Buffet was "washed up" because he wasn't chasing stocks. Look at where the Buffet Indicator was in 2000 — not a great time to buy and hold. He's been a net seller of stocks over the past few months again. One can see why when you look at the chart.
There will be better chances to get in at attractive prices. We will continue doing what we always do – letting our three distinct management styles give us diversification in signals, asset classes, and timing. No opinions, no guessing. Just data and math.


