
Our brains are fascinating mechanisms. The way we process information is far more complex than any computer can model. One of the biggest areas we focus on at SEM is understanding how we process data. A key thing everyone needs to understand is it isn't the absolute number, but rather how that number compares to what we expected.
This is particularly important when it comes to investment performance. We spend a great deal of time preparing our clients on what to expect on the downside. This is due to the fact the emotions generated by losses are twice the level generated by gains. We want to make sure not only clients expect to lose a certain percentage, but that it also lines up with the financial plan and overall personality of the client. Some people are much more sensitive to losses than others and we want to allocate the investments accordingly. More importantly if the losses in the portfolio negatively impact the overall financial plan, the emotional toll can be quite high.
The market moves in cycles and there are times during the cycle where we also have to properly set expectations on what types of gains to expect from an investment portfolio. I discussed this late last week in our latest Market Musings video.
Whether it is an SEM portfolio, your employer plan, or any other outside investments, the returns over the last year have been so far above normal I've found myself double checking the numbers. I'm seeing numbers that are 3 to 7 times above the long-term average. These aren't portfolios with cryptocurrency or the latest craze stock, but well diversified portfolios. Even the 2020 numbers, which included the big losses in the first quarter ended up being 2-3 times the long-term average.
I think this chart illustrating the diverse list of SEM investment models is important. We typically recommend at least 2 or 3 different SEM models in each portfolio to fill different roles in the overall financial picture. What is key to understand is the models on the left are not designed to generate high returns, but to lower the overall risk in the account. As you move right you should expect higher returns, but also be ready for much higher risk.
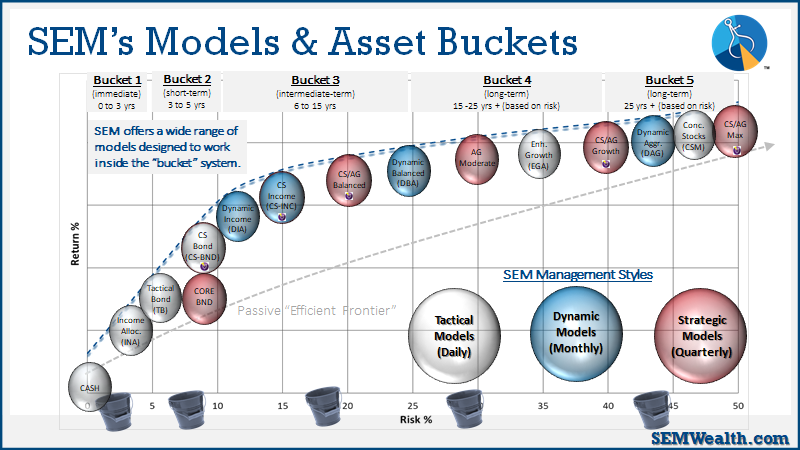
Our risk questionnaire is available for anybody wanting a second look at their current investment allocation.
The theme of 2021 is "return to normal". We're still seeing almost idiotic returns in certain investments, which is drawing far too many people into those extremely high risk investments. I get it. It would be great to be in something that doubles in value in a month or two, but when there is literally no fundamental economic basis to mathematically support those gains, it is gambling not investing. Market history tells us far more people will end up losing most of their investment than will end up getting rich quickly. We've enjoyed far above normal returns and should expect returns to settle back to a more normal level.
For stocks that's around 9% per year. Look closely at the cycle we've seen over the past 30 years. We've had periods of above normal returns followed by sharp corrections to bring the average back to "normal".
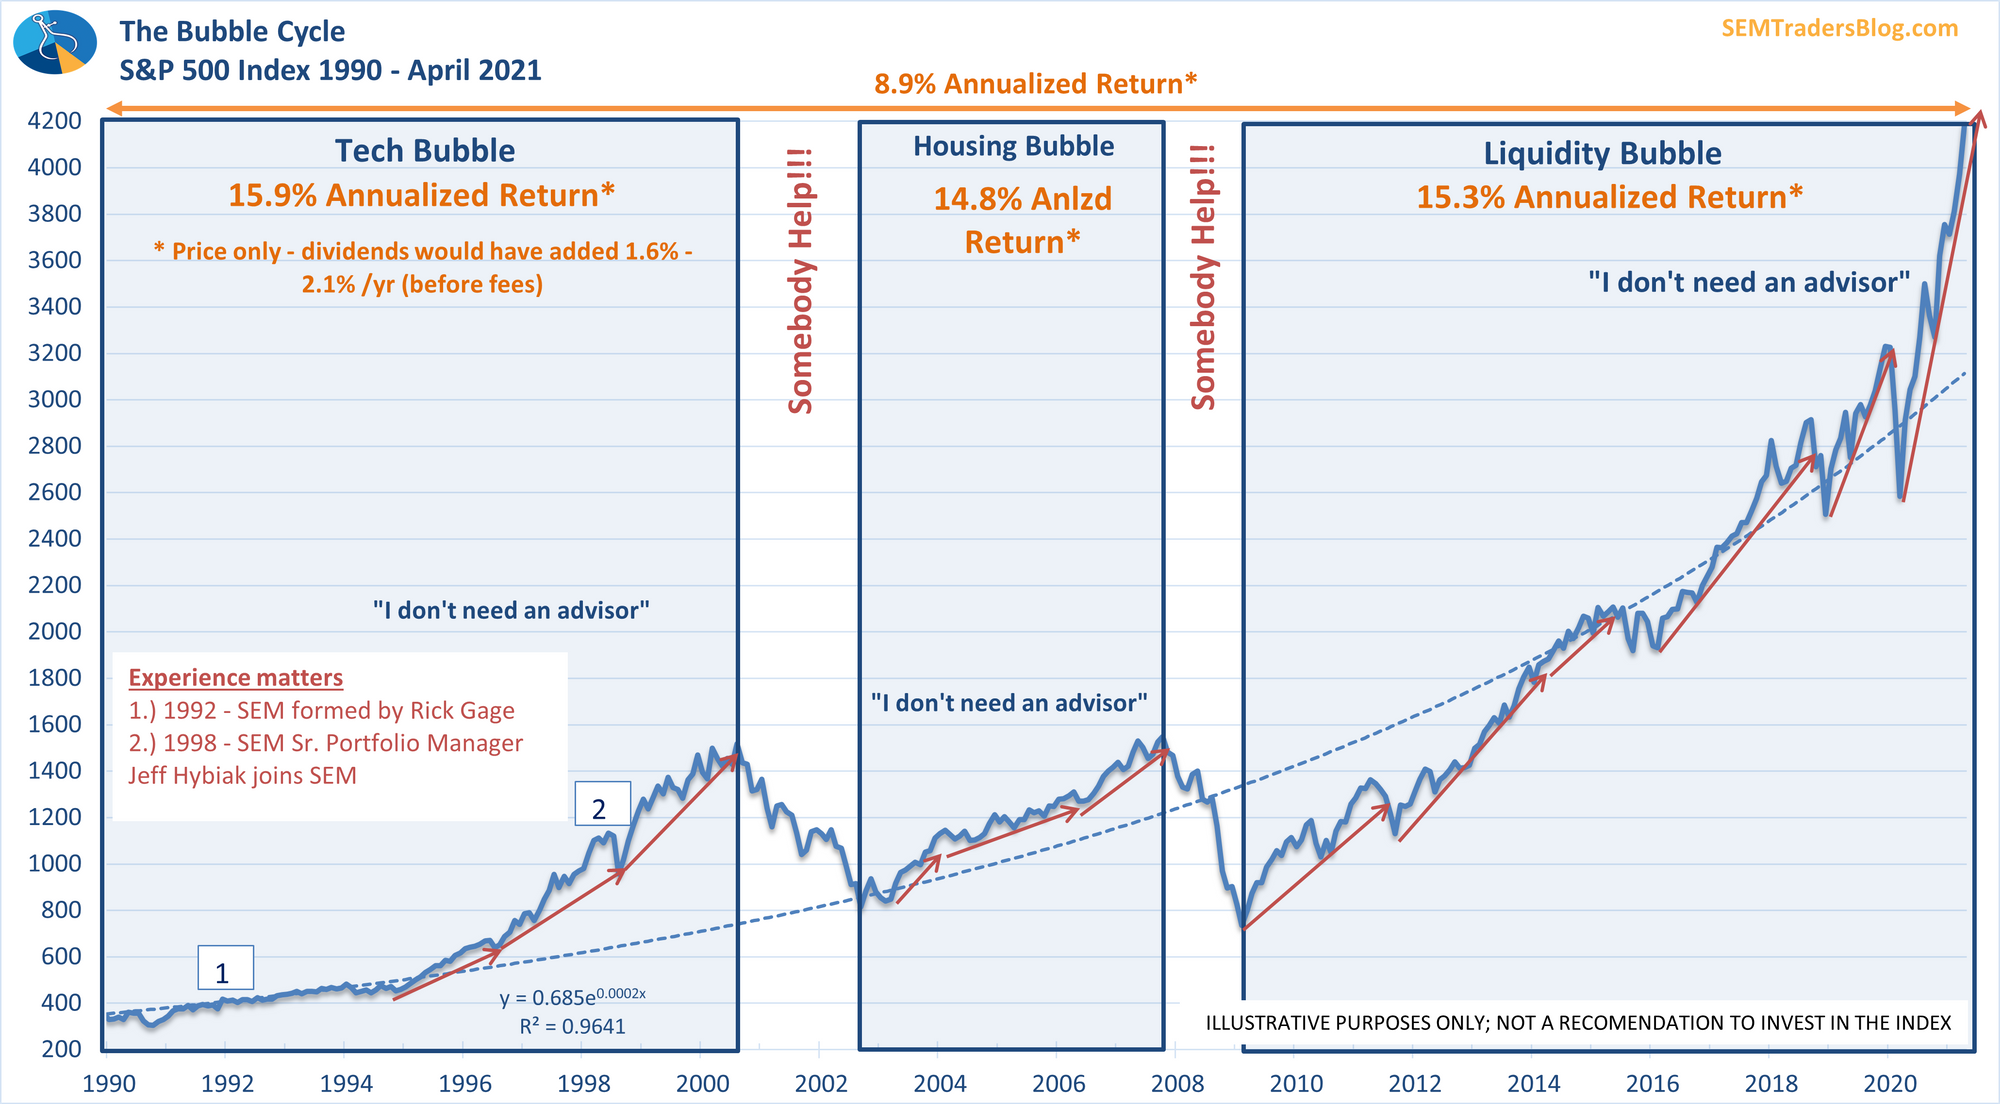
This means over the shorter-term we should be ready for BELOW NORMAL returns (meaning losses for stocks of 25-50% over the next couple of years). There has not been some earth shattering invention that has changed the trajectory of our economy to justify these returns. Instead we've borrowed trillions of dollars from the future to prop up the economy today.
On Friday we saw another example of the problem all of this debt spending is creating. Analysts had expected over 1 million jobs to have been added in April. Instead the number came in at 266,000 while the numbers for February and March were also significantly reduced. Most economists believe the slowdown is due to both the extended unemployment benefits along with the third round of stimulus checks and tax credits which hit in March and April.
I won't get into the details this week, but this chart shows how bad the April jobs report really was. The horizontal axis shows the number of jobs added and the vertical axis shows the hourly earnings for those jobs. More than 300,00 jobs were added in the lowest paying category, which means the combined totals for all other categories went down. We saw some big drops in the higher paying manufacturing category.
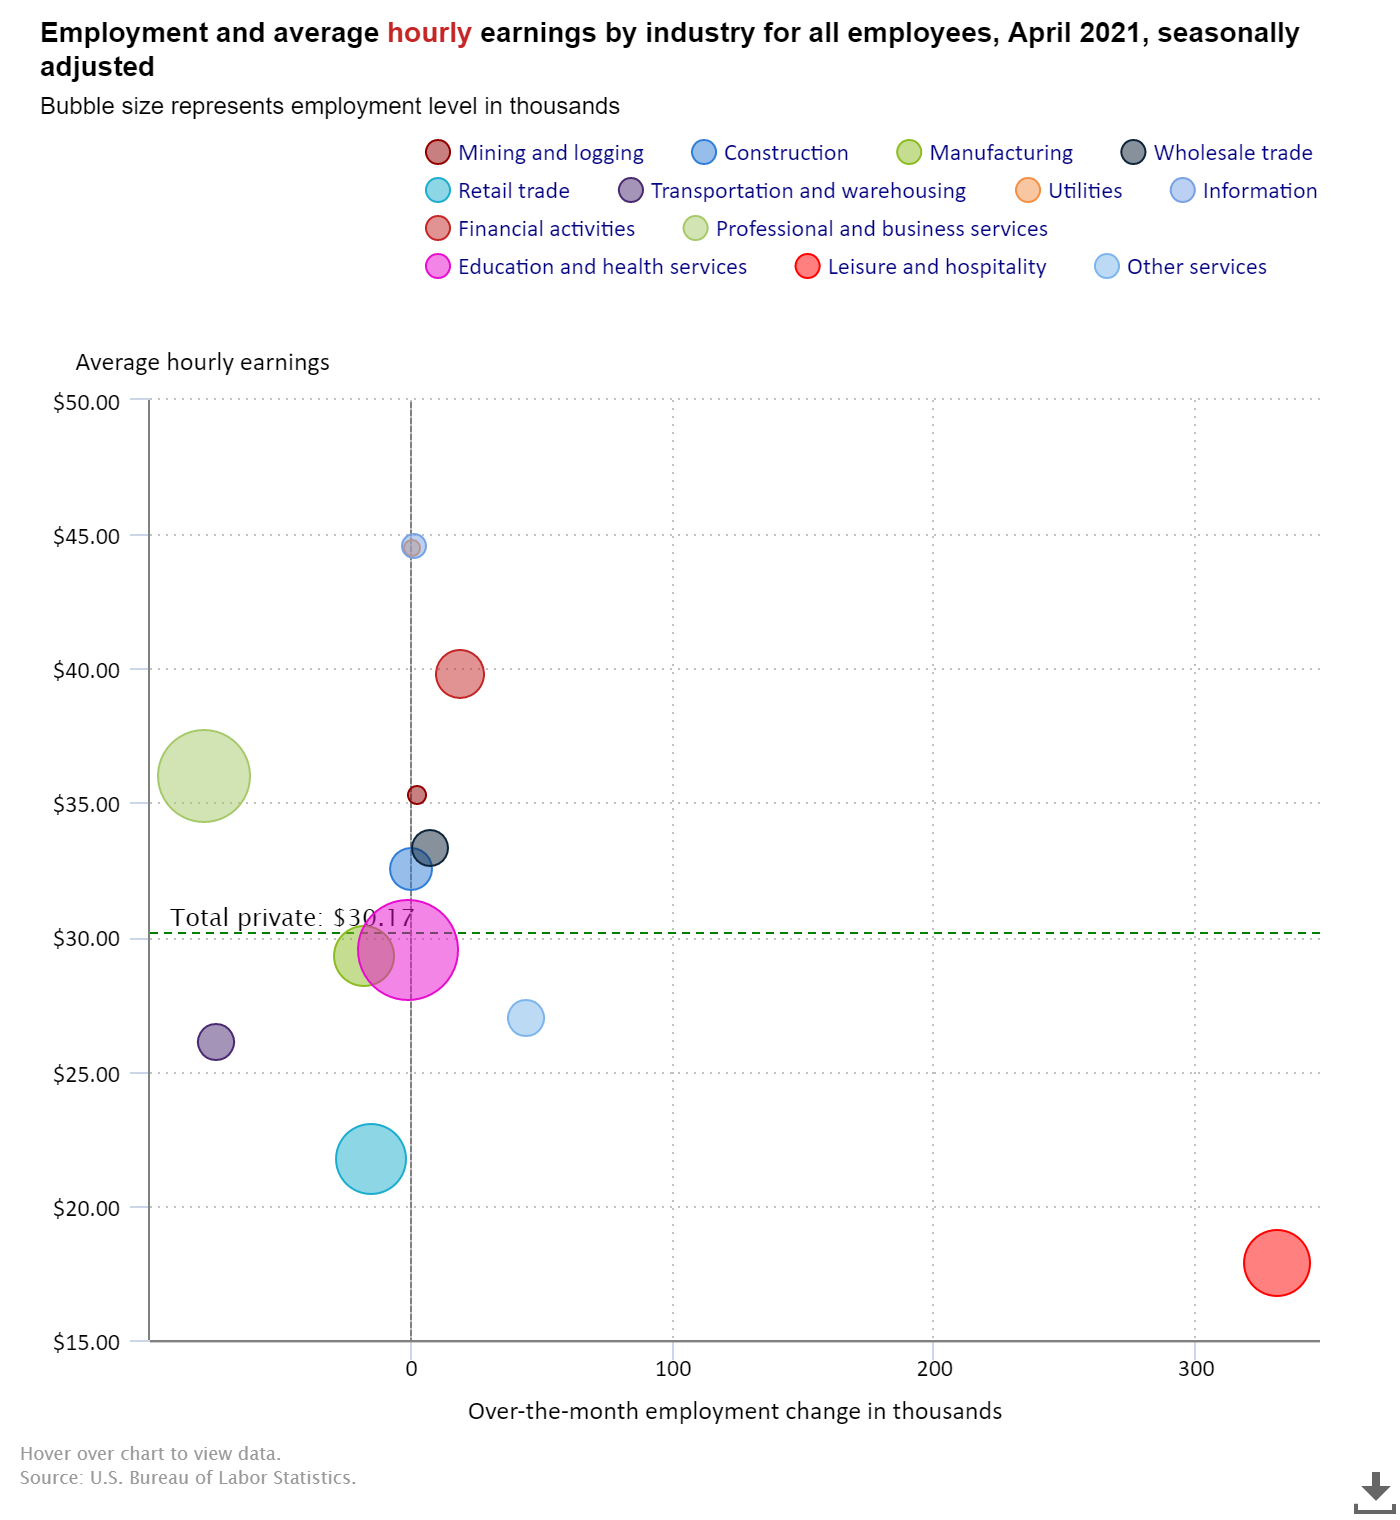
I'm going to push back on the people saying the weak jobs number is the result of unemployment benefits. By most accounts, the combined benefits are the equivalent of $18-20 per hour. Look again at the chart above. This means 331,000 Americans chose to go back to work at a rate equal to or below what they could get on unemployment. If you've ever worked a leisure and hospitality job, you would know it's not easy work. The real issue is the higher paying jobs were almost non-existent. That CANNOT be blamed on extended unemployment benefits.
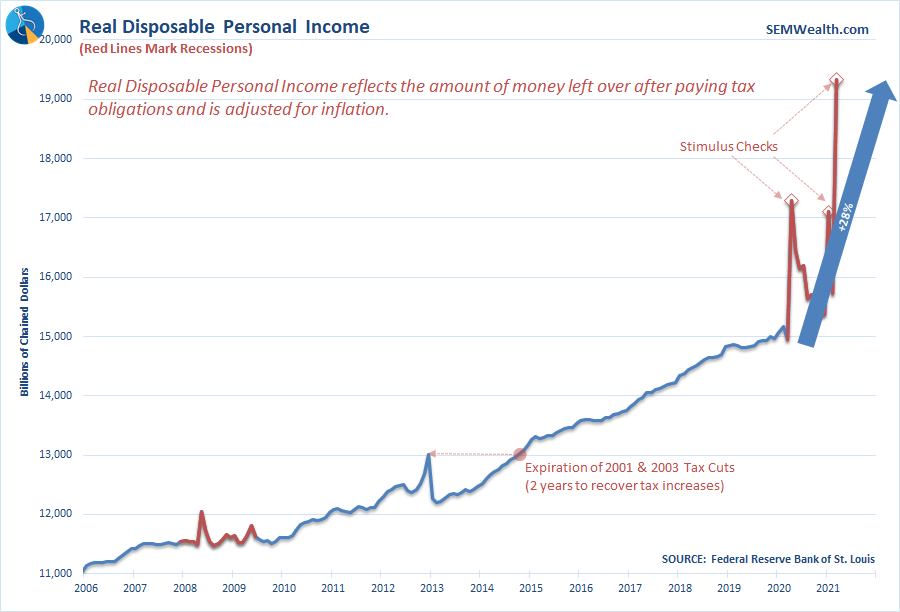
What I think many people are missing is the overwhelming amount of money that has been dumped on Americans the last 9 months. This next chart shows the impact the stimulus payments have had on disposable income. Keep in mind at the same time the third check hit many Americans were filing their taxes and claiming credits for unpaid stimulus checks from the first round. Americans have seen a 28% jump in income from the pre-pandemic levels. According to Goldman Sachs, close to 1/3 of all income so far in 2021 has come from government payments. The big boost in income is TEMPORARY.
The debt-supported payments made to most Americans is part of the problem – our constant focus on short-term profits and avoiding any sort of short-term pain has hurt our supply chain, increased our reliance on cheaply made foreign labor and products, and corporate policies that reward short-term performance means long-term solutions are put off to the future.
Regardless of the reasons we all need to lower our expectations. Now is a great time to make sure our investments align with our financial plan, cash flow strategy, and investment personality. The returns the last 12 months have not been NORMAL. This gives you the opportunity to cash in those above normal returns before you give them all back.
For SEM we'll continue doing what we always do – focus on the data and make adjustments as necessary. We are currently nearly fully invested across the board, but we do have a few signs of weakness popping up in our signals. As always, if you would like a review of your allocations, whether with SEM or not, you can start the no-obligation process by taking our short risk questionnaire.
I'd love to hear from you. What are your expectations of your investments going forward? Am I missing something? Let's talk about it in the comments below.


