
Moving into the second half of 2021 I thought it would be timely to take a walk through SEM's Economic Model to give us an idea of where we stand economically. The markets are obviously pricing in a spectacular recovery and we won't know until the fall what the economy looks like, but this will give us a baseline to compare as we move through the summer.
Here's a look at our dashboard:
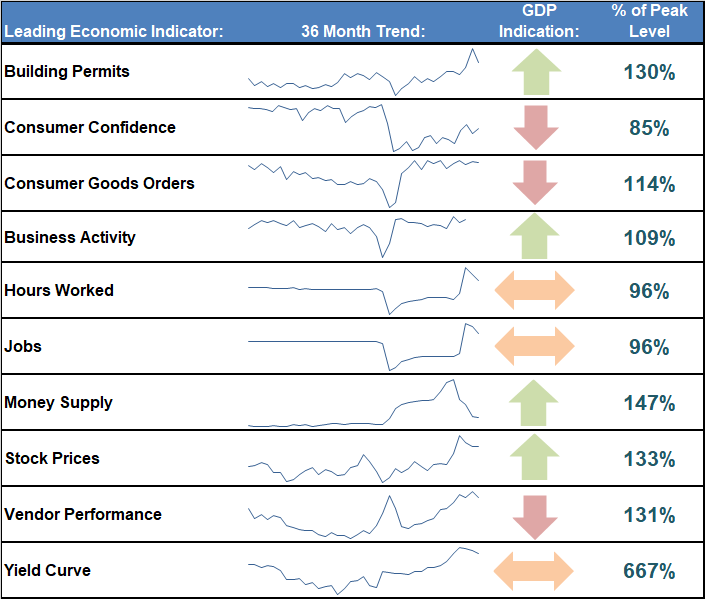
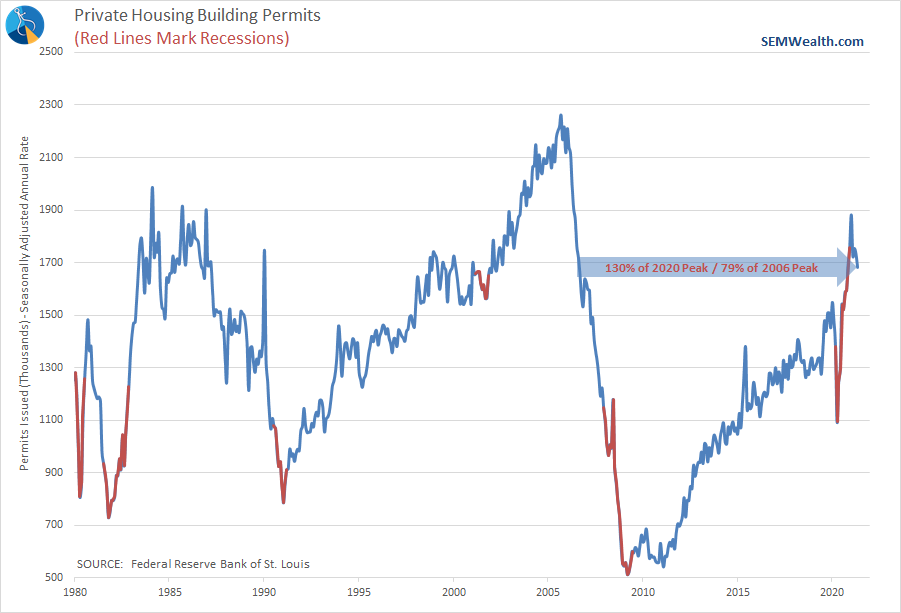
Building Permits
This has been my favorite leading indicator for years. There is so much economic activity that takes place during and after construction this can tell us very early if the economy is about to take off. It is also a sign of confidence in future activity. Clearly the pandemic accelerated demand for houses in different regions and this indicator has been a shining star. Going forward we'll be watching to see if the high cost of materials, the lack of labor, and the overall shortage in entry and mid-level home inventory will cause a slowdown in this indicator.
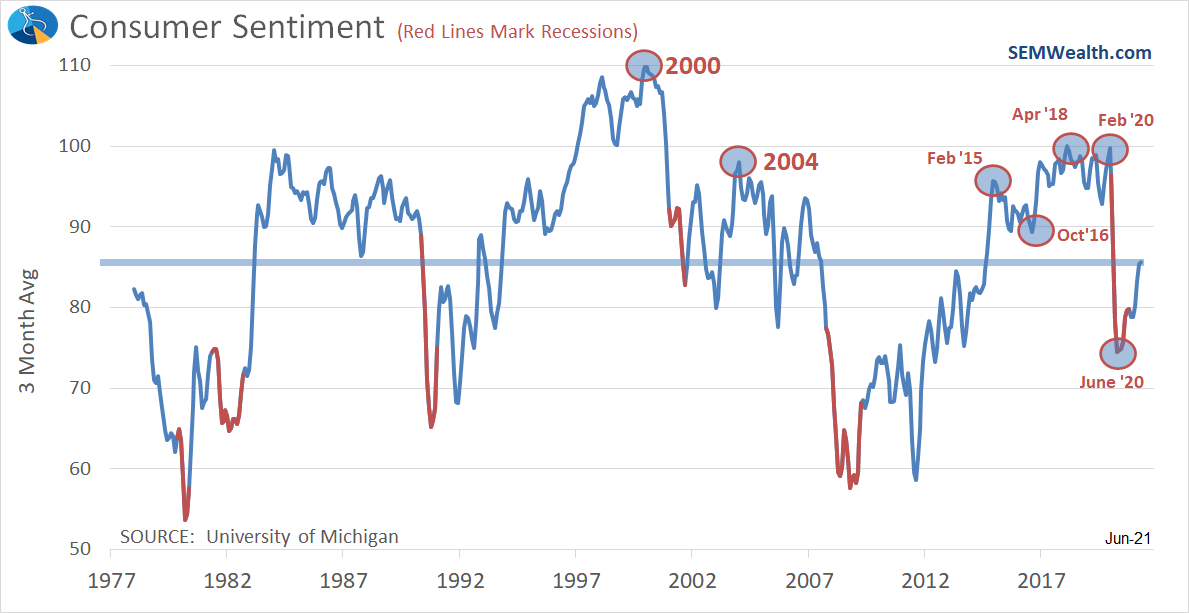
Consumer Confidence
With a consumer driven economy this is obviously a solid leading indicator. One thing I've pointed out for most of this century is the overall decline in confidence the last 20 years. This has also carried over to the social mood and is being reflected in our political environment where we've seen a "change election" (where the House, Senate, and/or White House changes parties) in all but one election this century.
Confident consumers spend money. Pessimistic consumers hoard money.
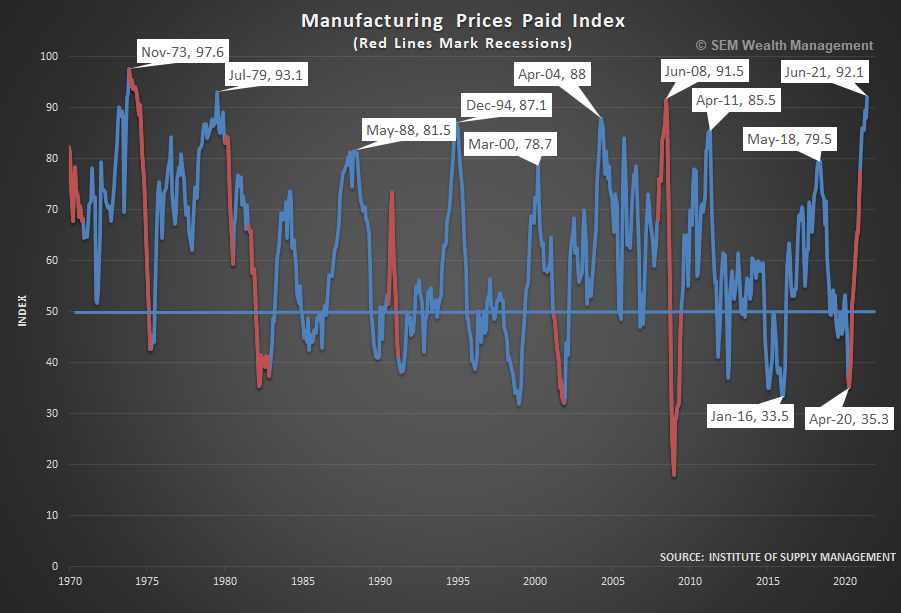
Consumer Goods Orders
This is traditionally a good indicator because consumers are more likely to purchase big ticket items in a thriving economy. COVID skewed this (and caused supply shortages) as households who did not have their jobs eliminated found themselves with excess money and nowhere to spend it.
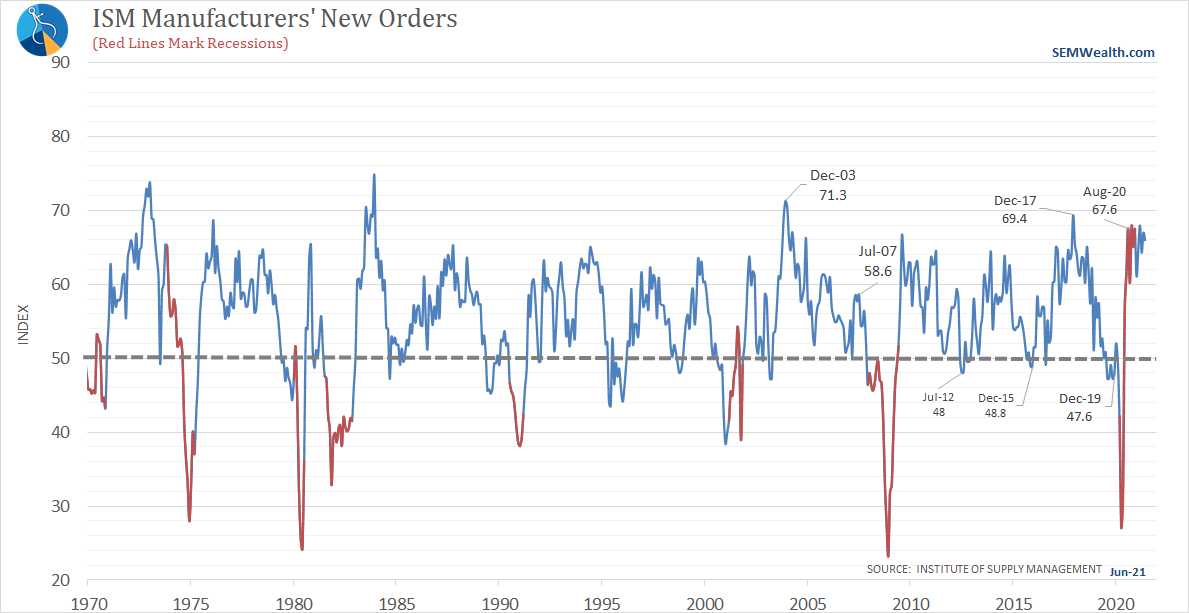
One thing we will have to watch closely, which is related to the supply shortages is the prices paid component. In June this indicator hit the highest level since 1979.
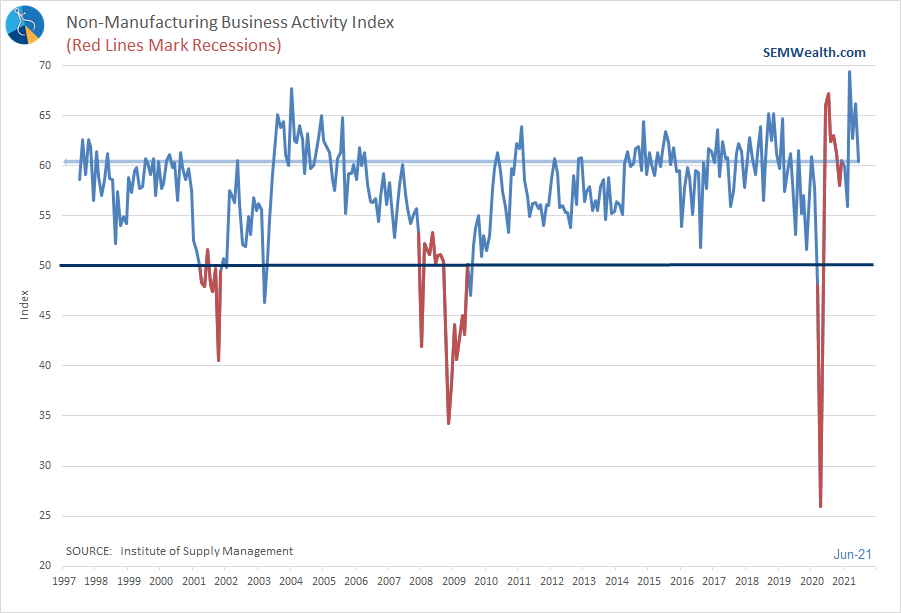
Service Business Activity
With the shift away from manufacturing the past 30 years, having an indicator to monitor service businesses is important. This has turned into one of my favorite leading indicators because of how quickly it can turn ahead of the rest of the economy. You can see how fast it bottomed. Of course the problem with a service based economy is those jobs and that activity is "easy come, easy go."
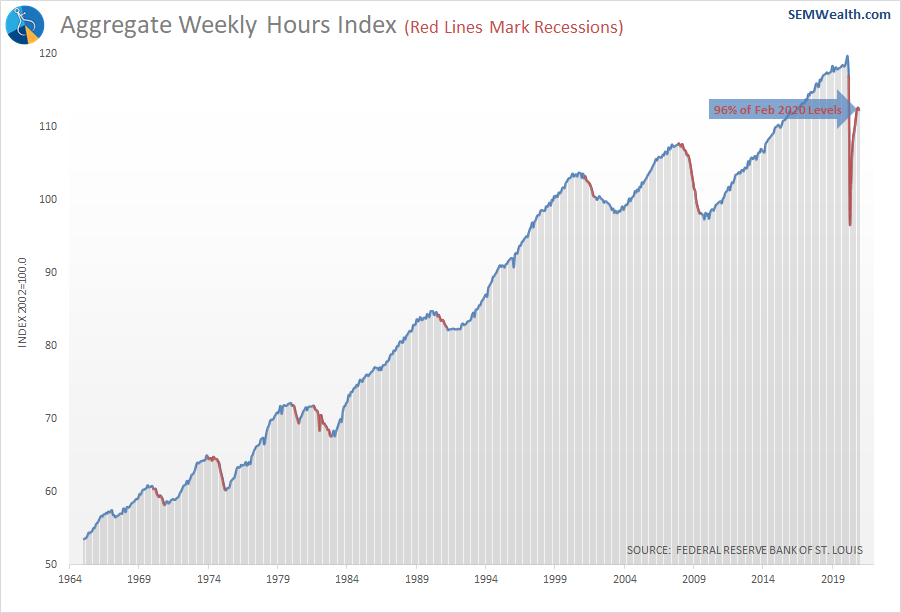
Hours Worked
This is another indicator that can help us identify turning points. If hours are increasing, demand is strong. Declining hours is typically a sign of a looming economic slowdown. We probably won't see this indicator fully recover until late this year at the earliest.
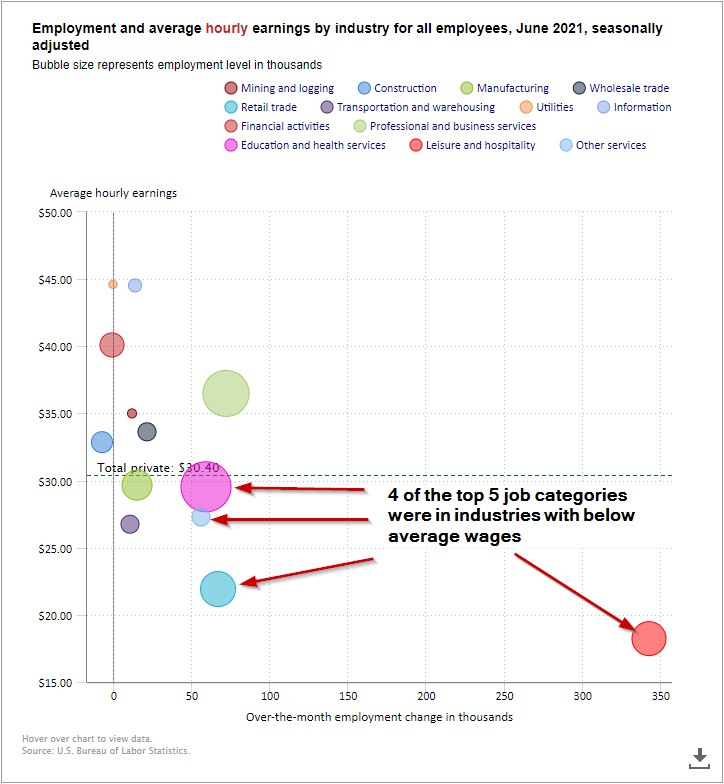
Jobs
From a market moving stand-point, this has been the one indicator which moves the market the most the day it is released. It is more of a coincident, if not lagging indicator, but trend changes are important. Just as we saw the last few recoveries, we should expect the replacement of the lost jobs to be slow.
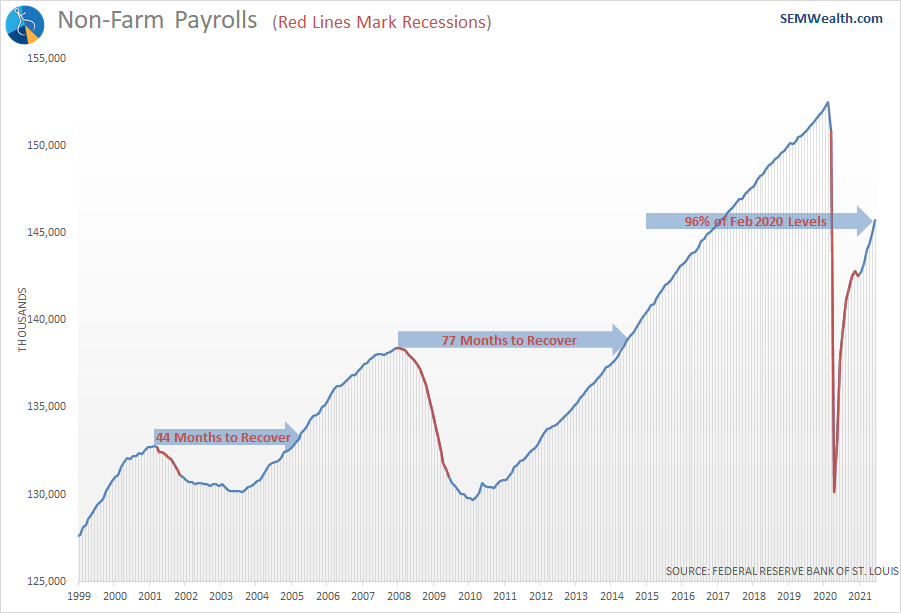
Looking at the most recent report we see again the problem with our economy – the jobs being added are paying well below average.
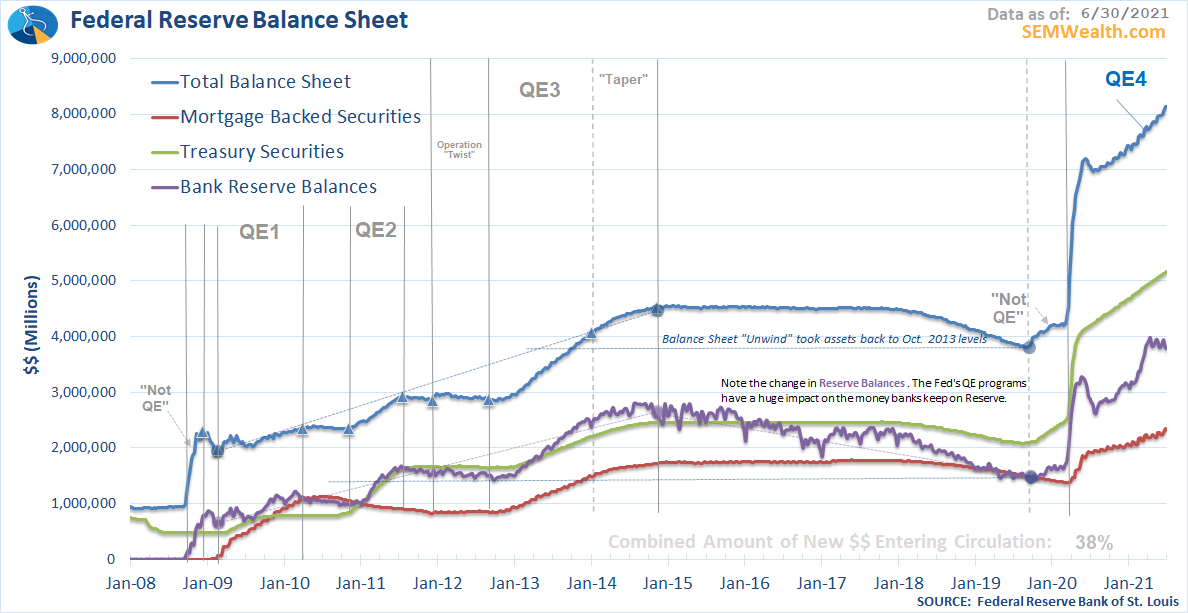
Money Supply
This is obviously something we all have to pay attention to given the influence the Fed has had on the economy and markets the last 25 years. They will eventually have to pull back the "stimulus" to both prevent the economy from overheating, but also give them some room to fight the next recession. How they do this without hurting the economy will be interesting. The pace of money creation has slowed, but it is still up 18% over the last 12 months.
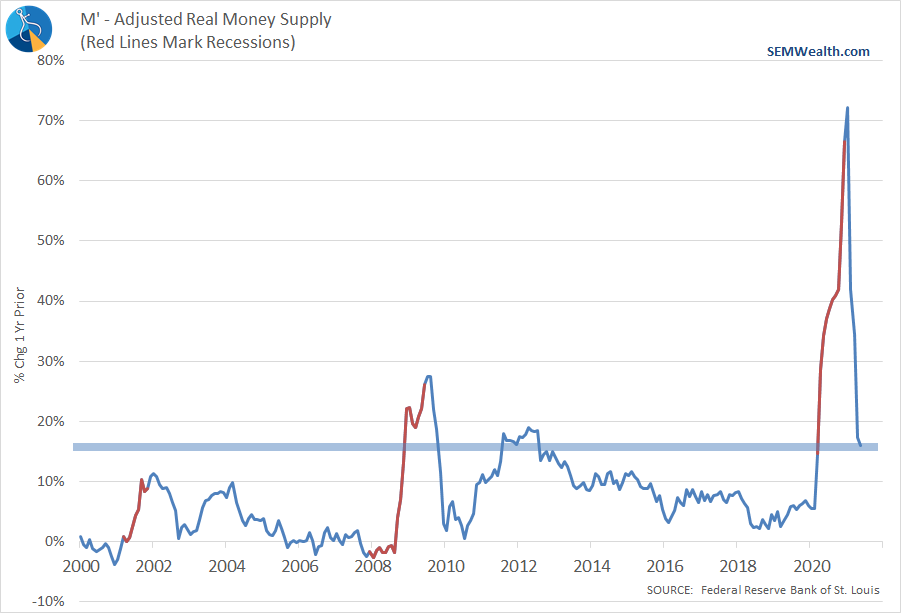
Getting out of the stimulus used to fight the bursting of the housing bubble was not easy and they never finished the job. The small unwind they did in 2018-2019 slowed the economy to the point our economic model was warning about a recession going into 2020 (even with the temporary boost from the Trump tax cuts). Getting out of this mess will take some skill to not cause serious unintended consequences in the markets.
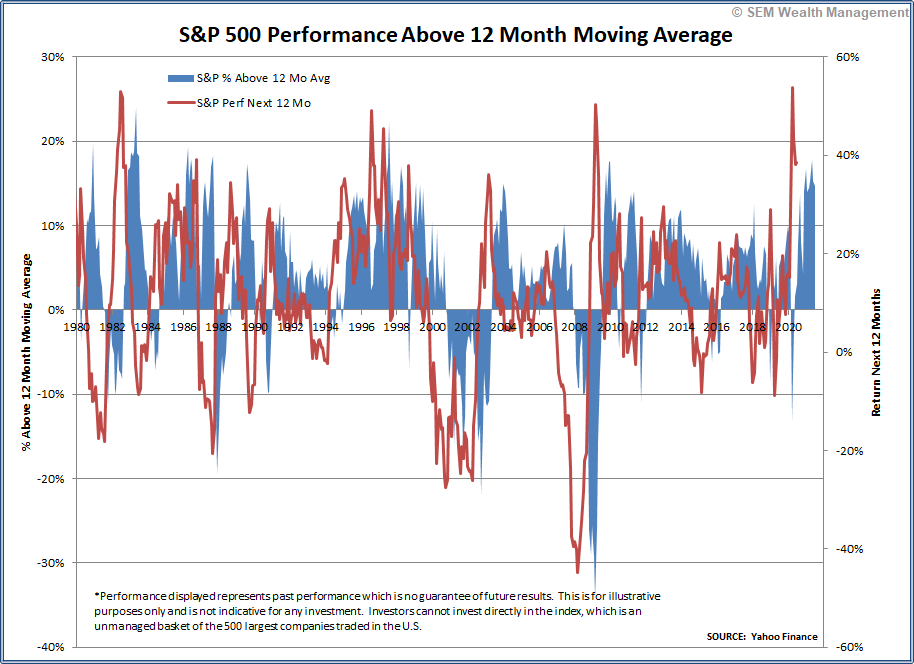
Stock Prices
It might seem strange to have stock prices included as a leading economic indicator, but we have to remember even with all the wild speculation currently in stocks, they are ultimately driven by their profits. When earnings begin to decline, stock prices will be hit, therefore a decline in stock prices is a clear sign the rest of the economy is struggling. Obviously, that is not the case right now.
One thing to note, when stocks have exceeded the 12 month moving average by 10% or more, returns tend to be zero or negative the following 12 months. Whether the decline in stocks is a reversion to the mean or a sign of an economic slowdown will be the more important question.
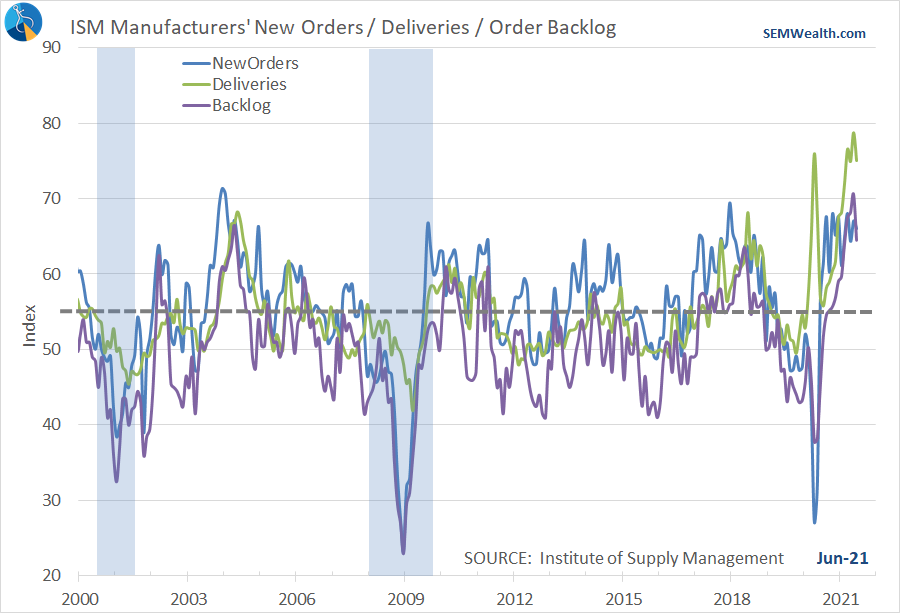
Vendor Performance (Supplier Deliveries)
Traditionally this indicator serves as a barometer on how heavy demand is for manufacturing components. If vendors are struggling to deliver it means demand is strong. If the deliver quickly there is too much supply in inventories. Obviously COVID has skewed this, but it still serves as a valuable indicator on current economic activity (as well as inflation pressures).
The chart below compares Deliveries, Order Backlog, and New Orders. Combined all 3 are valuable data points for future growth.
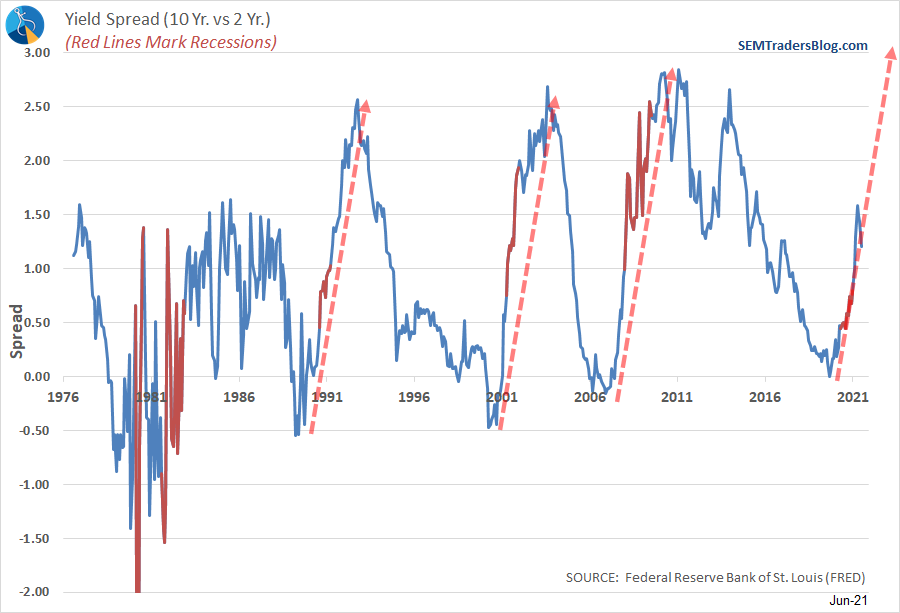
Yield Spread
This is another one of my favorite indicators. The reason is simple – bond traders are smarter than stock traders. Usually stock traders buy stocks only because they believe the stock will be higher in the future. They don't care why, just that it will go up. Bond traders on the other hand have to worry about the ability of the borrower to pay back the loan. They have to be concerned about inflation eroding their returns and what higher inflation does to the overall economic growth rate. Therefore, watching the bond market can give us an idea of what the more rigorous market analysts are seeing in the data.
If the spread between long-term rates and short-term rates is high, it is usually because bond traders believe growth will be strong well into the future. If the spread is low (or worse, negative) it is a sign bond traders believe trouble is on the horizon. In 2019 the spread went negative and was one of several indicators in our model warning about an economic slowdown. Historically you see the spread spike during the recovery.
While it is too early to tell if this is a one-time blip, it is worth noting the spread has declined the past two months. The question is whether bond traders know something we don't about the ability for the economy to keep growing or if this is just a pullback to the uptrend line.
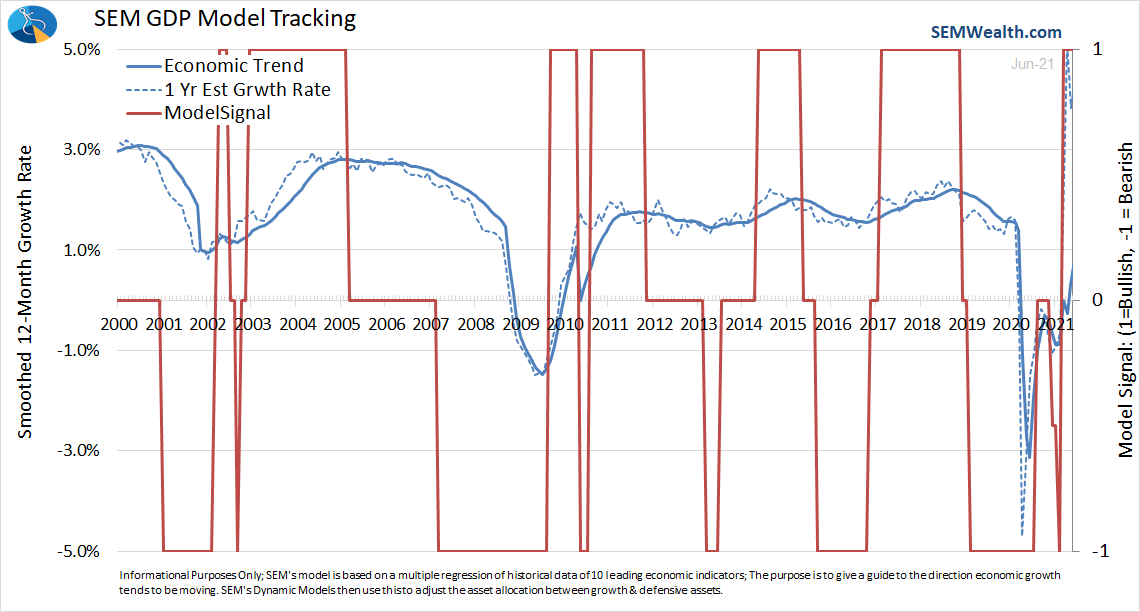
Model Outlook
Despite some concerns in some individual components, our model remains "bullish". This means no change in our Dynamic models from our current positions (overweight small cap in Dynamic Aggressive, overweight dividend stocks in Dynamic Income).
Value over Growth / Small over Large
At the end of each quarter we look at our Core positions in our AmeriGuard and Cornerstone models (as well as Core-Stock). Despite a strong rotation into large cap growth the last 6 weeks of the quarter, our models remain as they were – overweight value and small/mid-cap stocks. We still have positions in large cap growth.
I discussed this in greater detail in our most recent newsletter which posted last week.
 Jeff Hybiak, CFA
Values over Everything Else
I know a lot of people in our country are hurting and a lot of people are pessimistic about the direction our country is headed. That is understandable. After celebrating Independence Day I hope everyone can understand, despite our differences, struggles, and imperfections, our country remains the greatest country in the world. I think most people reading this blog would not come anywhere close to enjoying the quality of life they have today in any other country.
That said, at SEM we are always looking to do more. We want to make a lasting impact in the lives of our clients, advisors, employees, and communities. This is one reason we created the Cornerstone Portfolios. They give us the chance to make a much bigger impact on our world. In case you missed our latest SEM University, here is the replay:
Jeff Hybiak, CFA
Here's to an impactful second half of the year, no matter what happens with the economy.


