
There are many axioms on Wall Street which often are not understood by most people yet are believed to be reliable. One of those is the "Santa Claus Rally". We've heard it discussed so many times it is easy to think the market always rallies around Christmas time. This is mostly true, but there are times where it simply doesn't happen. There are also questions about when the "Santa Claus Rally" starts and how long it lasts.
At SEM we rely on data and have tested this phenomenon. The most often used definition of the rally is from the last trading day before Christmas until the first trading day of the new year. Others have it slightly shorter and some have it a bit longer. Our data shows the best performance is from around the middle of December through the first 4-5 days of the new year. Please do not use this as a trading idea – it is not reliable enough to take on very much risk. All we are saying is statistically this period tends to be significantly better than the "average" period.
Depending on the timing, the Santa Claus Rally tends to lead to positive returns 60-70% of the time. Returns over this period are around double the average return for the time frame. This is partially helped by the fact December is up far more often than the average month (as are November, April & May).
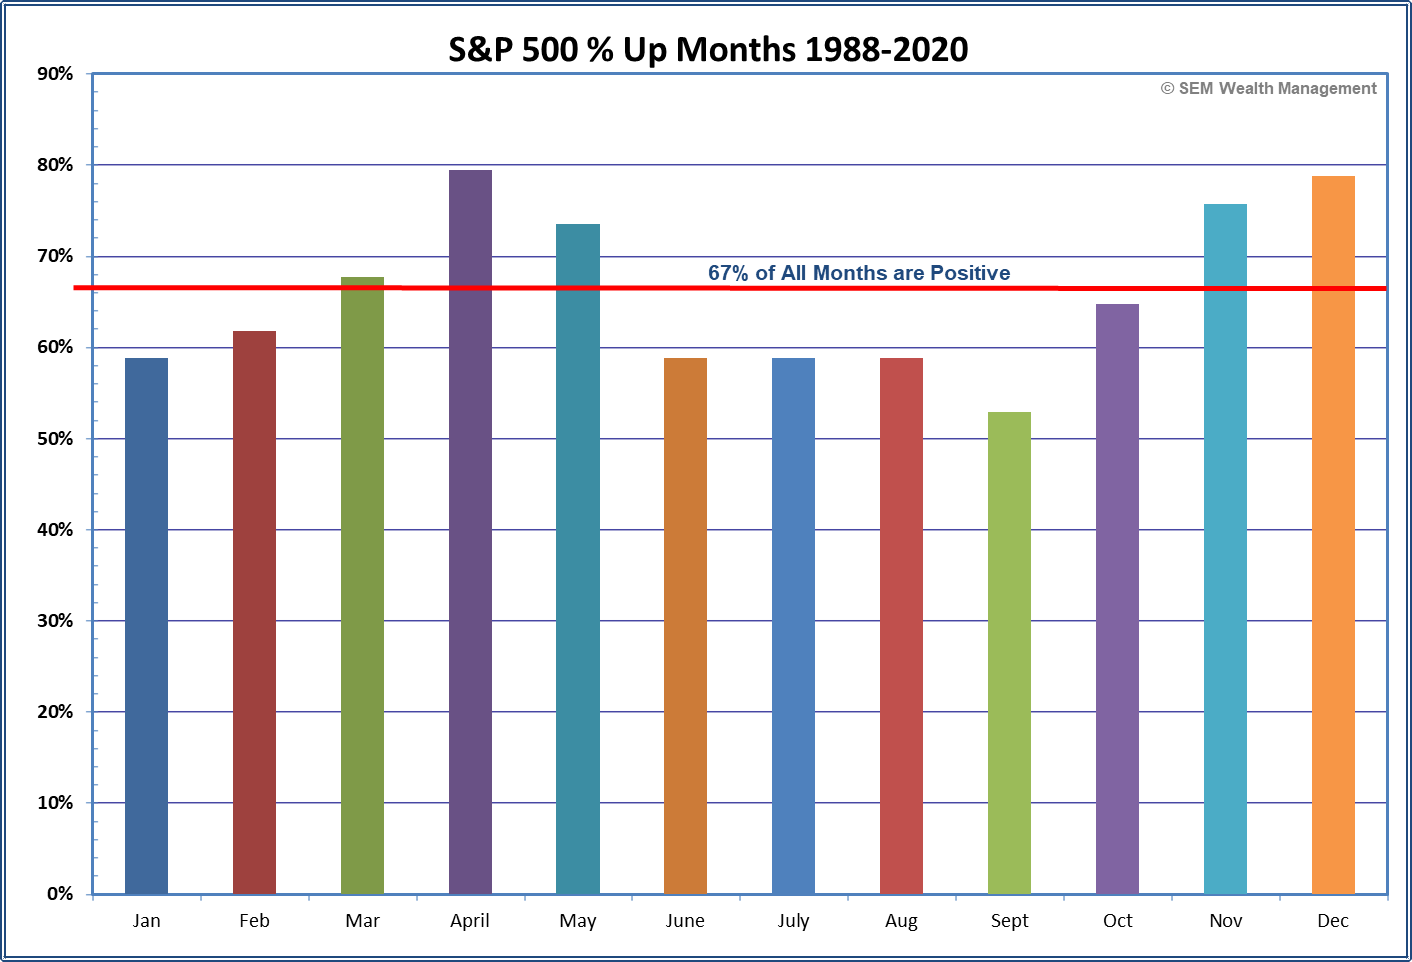
Stocks go up when more people are buying than selling and go down when more people are selling than buying. With investors looking to fund their retirement accounts before year end, pension plans also funding their plans for the year, and other year-end activities, we simply see more money coming into the market in December looking for a home (which also explains the boost in April/May following the tax return deadline).
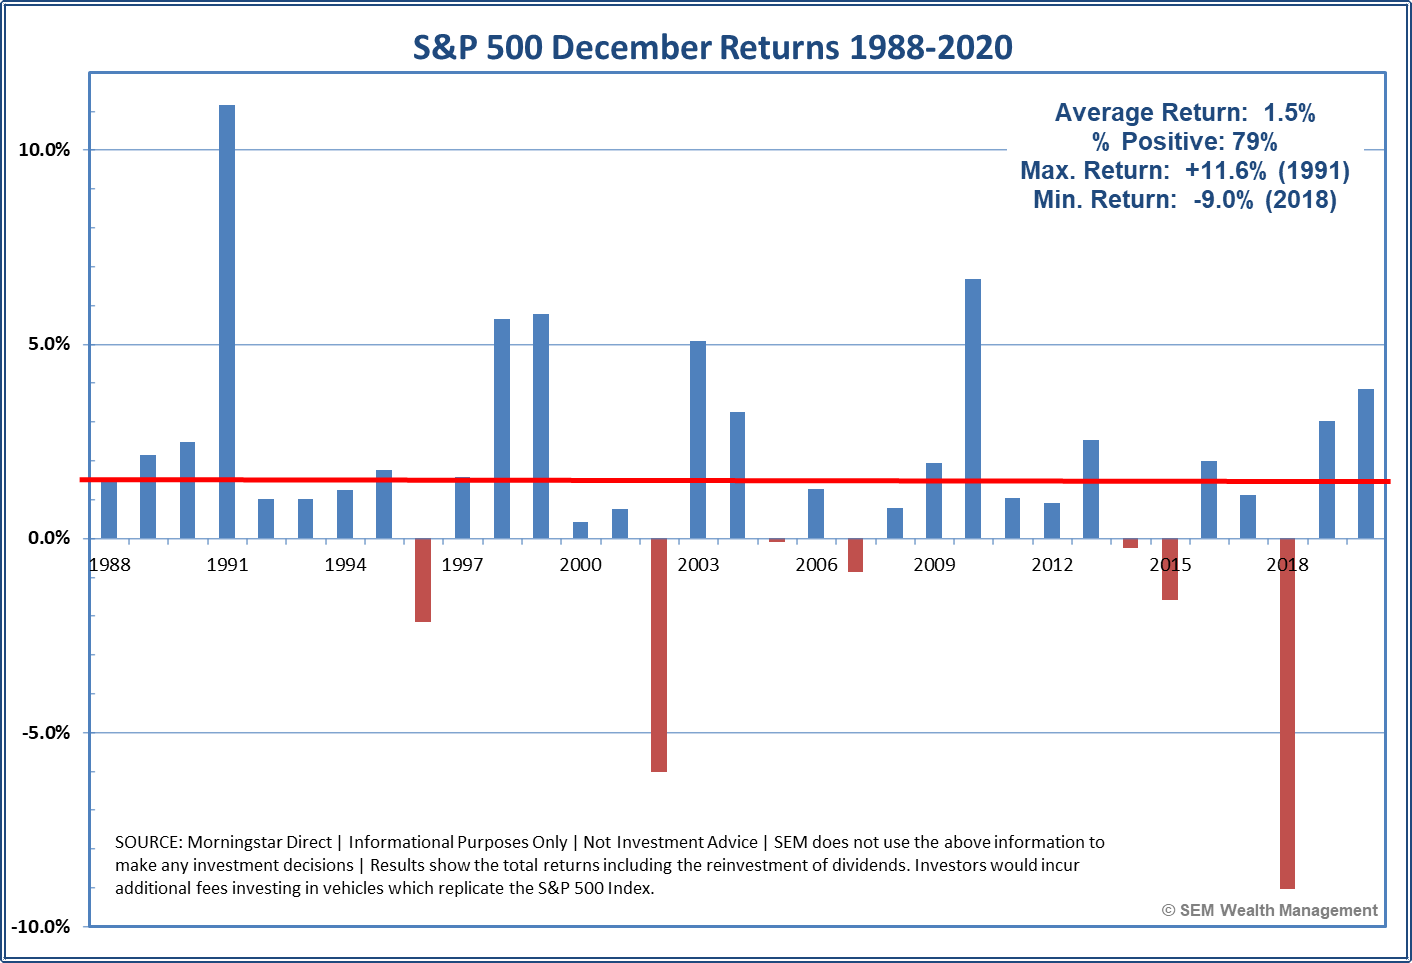
However, there are still years where Santa simply doesn't show up. Often times if the economy is slowing the Grinch tends to ruin Christmas for those betting on a year-end rally. This was certainly the case in 2002, 2007, 2015, & 2018. As we've mentioned several times over the past couple of months, our economic model has moved to a cautious stance and is teetering towards a "slowdown" signal.
The media is pointing to the Omicron variant as well as the "Build Back Better" legislation failing to pass the Senate. Our readers should know this is simply an excuse to sell stocks at or near record high valuations. The foundation of this rally was weak and investors (speculators) chasing returns know this and have a very short trigger on the sell button.
For our take, check out these resources:
I think it's important for our clients and advisors to understand how our data-driven process works. We ignore the headlines and narratives and let the data determine how we react. Here are some recent examples:
6 minute video discussing Omicron's impact on the market:
SEM's November Economic Update:
 Jeff Hybiak, CFA
A look at the impact inflation, stimulus, and the lack of new stimulus is having (including links to deeper dives on these subjects):
Jeff Hybiak, CFA
Finally, in case you missed it, on Thursday I posted a quick "Chart of the Week" looking at the Federal Reserve's latest policy statement, which some are also pointing to as an excuse behind the selling:
Jeff Hybiak, CFA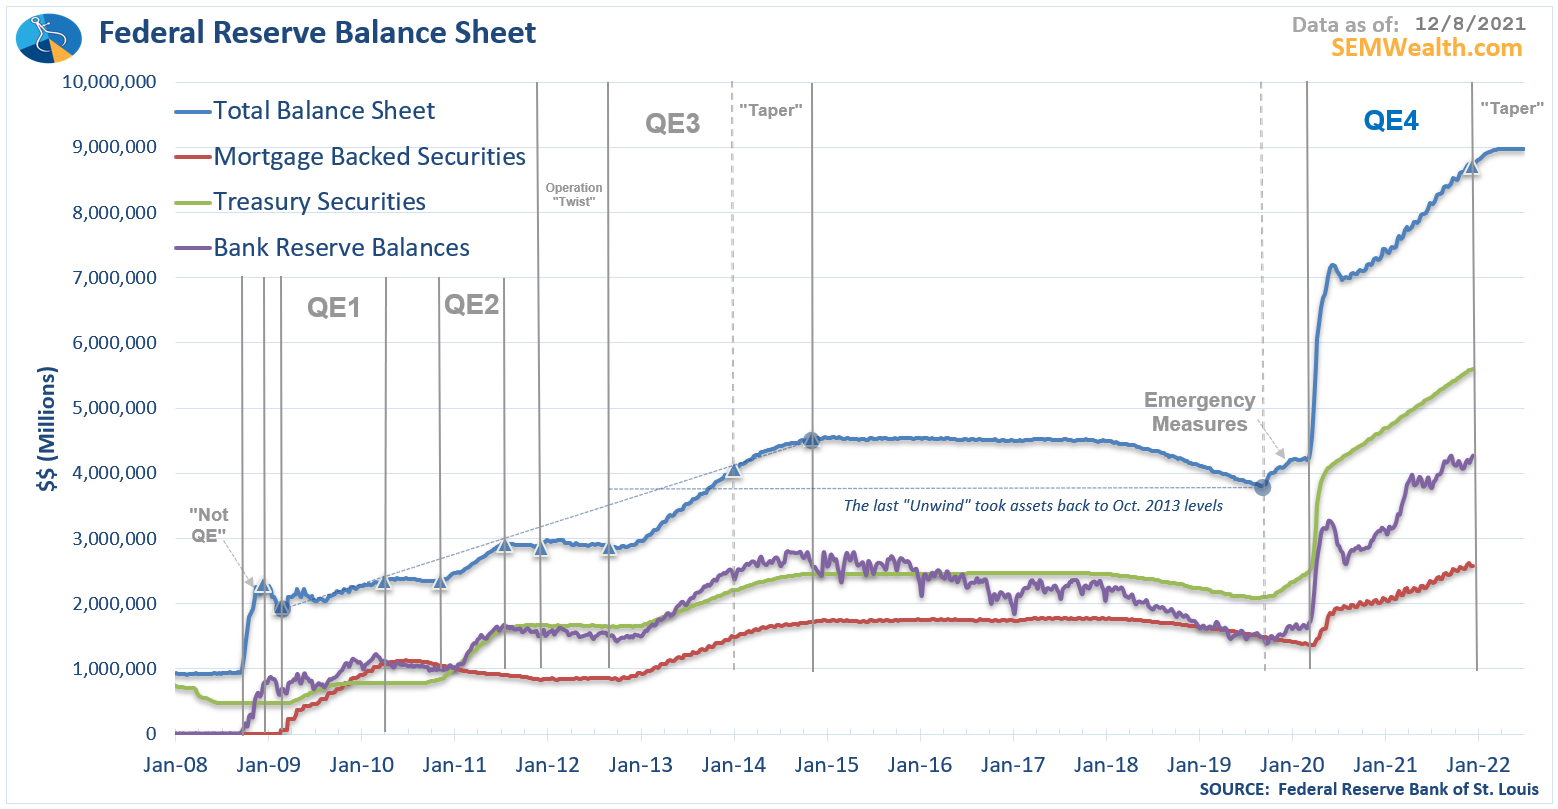
Will Santa Show Up?
This is anybody's guess. While we don't use "calendar" strategies specifically, we do have a few indicators that have a slight impact in some of our investment models. Inside of Enhanced Growth Allocator (EGA), which is having a very solid 2021 our Price Divergence System (a system we've used since 1992) has a filter that essentially makes it harder to get sell signals if certain indicators are in place in the last part of December. Those indicators have been met and will be in place until the first week of the year. (Again, please don't use this as a recommendation to buy – we can still get sell signals during this time and won't be posting them in real time on the blog.)
Our Momentum Stock Model (MSM), which had a great 2020 and a fantastic first half of 2021 before struggling the second half as momentum investing has become quite volatile, had its trend indicator trigger a sell on Friday. However, there is a "calendar" override in there which keeps our positions in place if certain criteria are met – they are so far in place, but again, this could change if things deteriorate further.
From a bigger picture perspective, I've been surprised at the amount of concern we've seen from advisors, clients, and investors overall. The market is not down very much yet people are panicking. It should be noted not very many SEM clients or advisors have contacted me about the omicron scare, but a few of them have. I use the marketing adage if a couple of people are reacting to something there are enough who have yet to contact you that it should be addressed.
We of course will adjust to what the DATA is telling us, regardless of what the calendar says. Looking at the market from a big picture perspective, this "scare" is still very minor and part of a normal up-trending market.
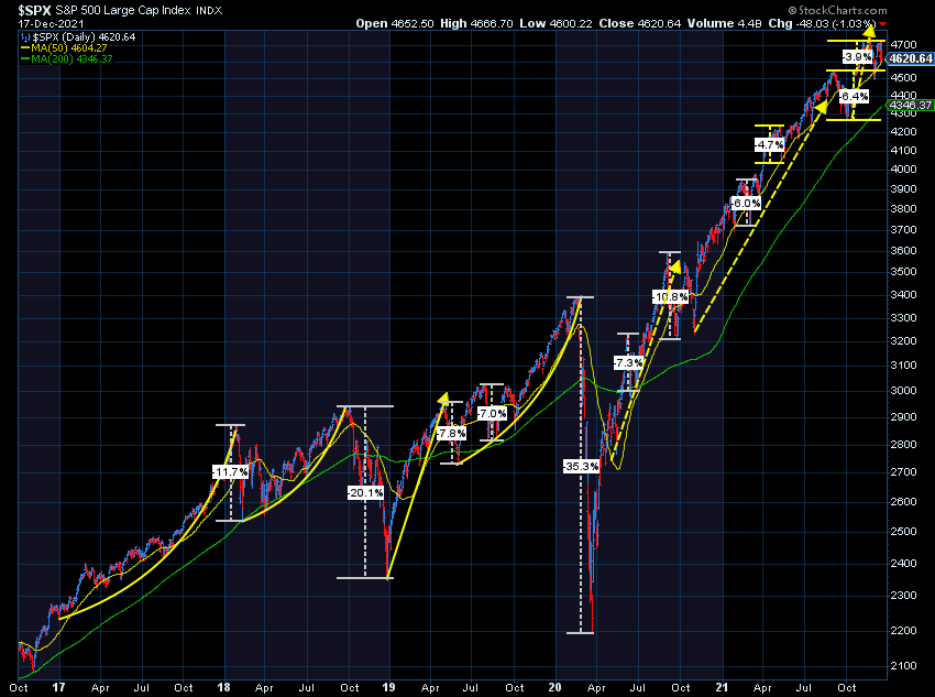
Things could still get much worse and at the same time the up-trend can remain in-tact. Even a 6% drop from here (making the total loss 10% from the high) would simply put the stock market back to the longer-term 200-day moving average. This is what happens when investors (speculators) chase stocks higher. Minor events can cause large losses to those jumping in too late.
The most important thing is to stick to the plan. SEM's clients are in portfolios customized to match the investment plan, cash flow strategy, risk tolerance, and investment personality. Whatever happens from here, we'll be ready, just as we have for the past 30 years.


