
The confidence some prognosticators have in their outlook and advice they give on television never ceases to amaze me. Of course, they aren't held responsible by their clients and advisors for their advice. Regulators do not force them to document and disclose the performance of their advice. And most importantly, if they told the truth, "Honestly there are so many moving pieces controlled by humans right now that I have no idea what's going to happen next," their career as a prognosticator would be over quickly.
Readers of this blog know we do not have the same luxuries as the "experts" on television. We also aren't afraid to tell the truth – sometimes the future is not clear.
I have A LOT of things on my mind going into the week. I'll try to do my best to keep it to what I believe are the most important things for us to focus on and to have some sort of coherence to this week's musings. But first, here are my weekly talking points, which is a condensed version of what we've shared the past two weeks:
Weekly Talking Points
- Nobody knows what will happen or what the impact will be on the economy, the markets, and the world. Avoid taking advice from anybody who says otherwise.
- This could get ugly. Putin is a tyrant and has been buddies with China (more details below).
- Best case is Russia ends their invasion quickly. Even with that we are dealing with a Federal Reserve who has completely lost control of inflation and will need to act aggressively or risk having inflation implode the fragile economy.
- If you were overweight stocks going into the year, any bounce should be looked at as a selling opportunity. We're well overdue for a real bear market (more on that below) and we've only given back the gains from the last 9 months.
- SEM's allocations are close to minimum exposure across the board. Unless your financial plan, cash flow strategy, or investment objectives have changed, there is no need for action on your part.
Most importantly, if you are an investor with money outside of SEM or an advisor who is relying on "hope" for a good outcome in Ukraine and the inflation battle, we should talk. We offer free portfolio reviews as a starting point. Schedule a short, no-obligation meeting here.
Things could get ugly
I was one of the first subscribers to John Mauldin's "Thoughts from the Frontline" back in 1998. For the most part, his weekly letter is the first thing I read on Saturday mornings. He has an incredible big-picture mind and a great team of researchers behind him. I tend to not share too much of his content, because it can tend to lean bearish (rightly so, in my opinion). It's not that I don't want to share "bearish" research, it's that I've seen with experience it can cause advisors to become ultra-bearish in their advice.
Anyway, this week's letter is a good read as it delves deeper into both the impact the Ukraine-Russia situation could have on the rest of the world economy for years (decades?) to come. A lot has been made about the impact of shutting down Russian oil exports to the free world, but the bigger concern should be in the food supply.
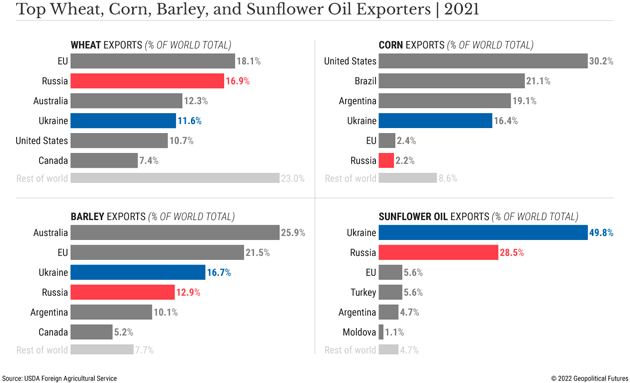
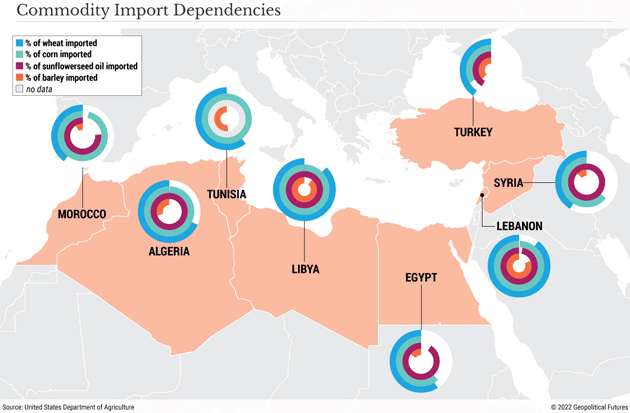
A study of history tells us most military conflicts start with economic problems. This map shows a region we certainly do not want to have more economic problems.
John shared this bit of information:
"My friend Vitaliy Katsenelsen (whose Coming to America story I sent you in December) has been following Russian media and talking to friends who still live there. He is not optimistic about Putin losing power. More the opposite: In a chilling tweet, he said
“They are preparing to turn Russia into North Korea.”
"That parallel, if accurate, is economically problematic. North Korea has been cut off from most of the world economy for decades, yet the regime survives. The sanctions we have placed on Russia, while necessary (and certainly preferable to a wider war), could last a long, long time."
The US is set to meet with China this week and supposedly will "warn" them about "severe" consequences if they help Russia get around the sanctions, both economically and militarily. There are already rumors, which China has of course denied, that they are supplying arms reinforcements to Russia. For two decades the China-Russia alliance has been building at the same time China has been looking to take over as the world's economic power.
We need this to end quickly before China is forced to pick their (basically) communist buddies or continue masquerading like they are capitalists.
What about oil?
I try to keep politics out of our blog, but sometimes politics influences our readers assessment of the economy and markets, which can directly influence their appetite for risk. My number one rule of investing is "don't let your political opinions influence your investment decisions." That certainly applies here.
I was curious about US oil production and found this chart:
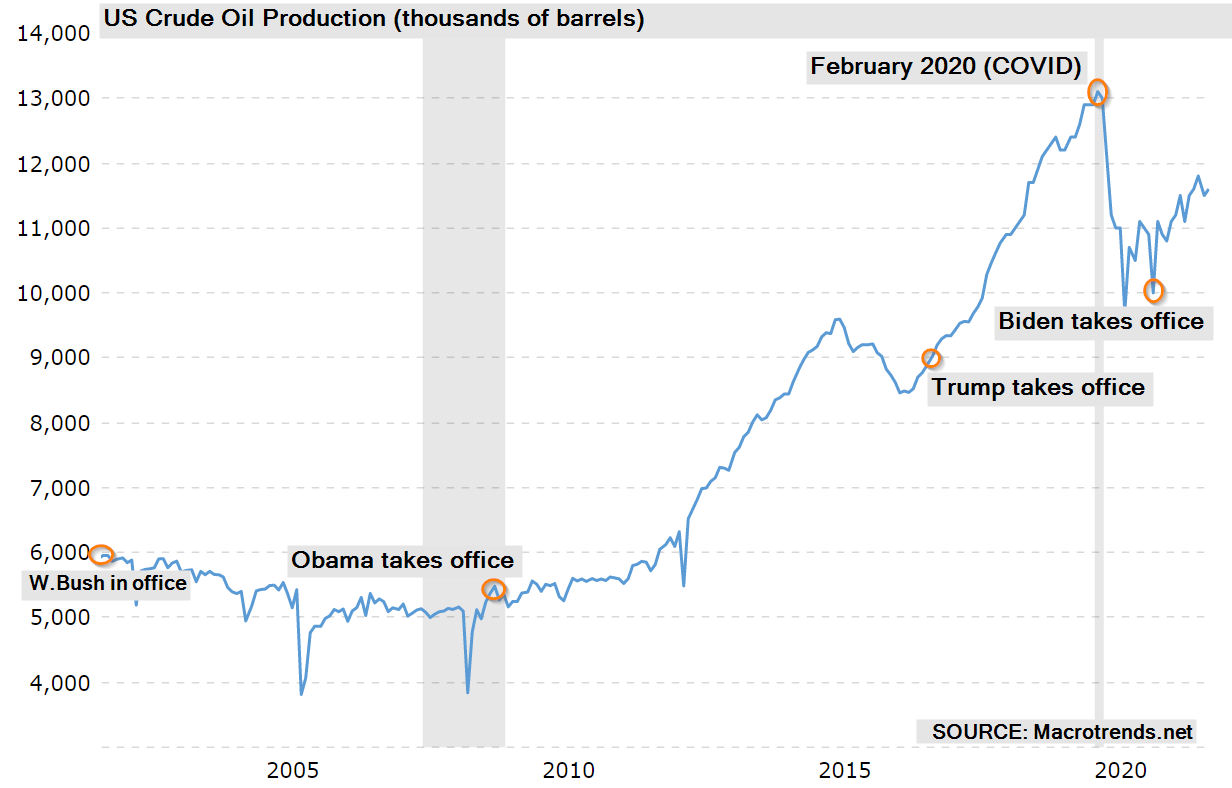
The level of production does not match the ideological opinions of either side. On a percentage basis, President Obama oversaw a much higher increase in US oil production than President Trump did, even at the pre-COVID peak.
My point – one single person cannot control energy prices. One or even a series of several policies cannot control energy prices. If they could it would be in the political best interest of EVERY president to keep energy prices down. We saw how little tolerance Americans have for any sort of price increases. Angry consumers lead to angry voters. Angry voters blame the party in charge.
Angry Consumers
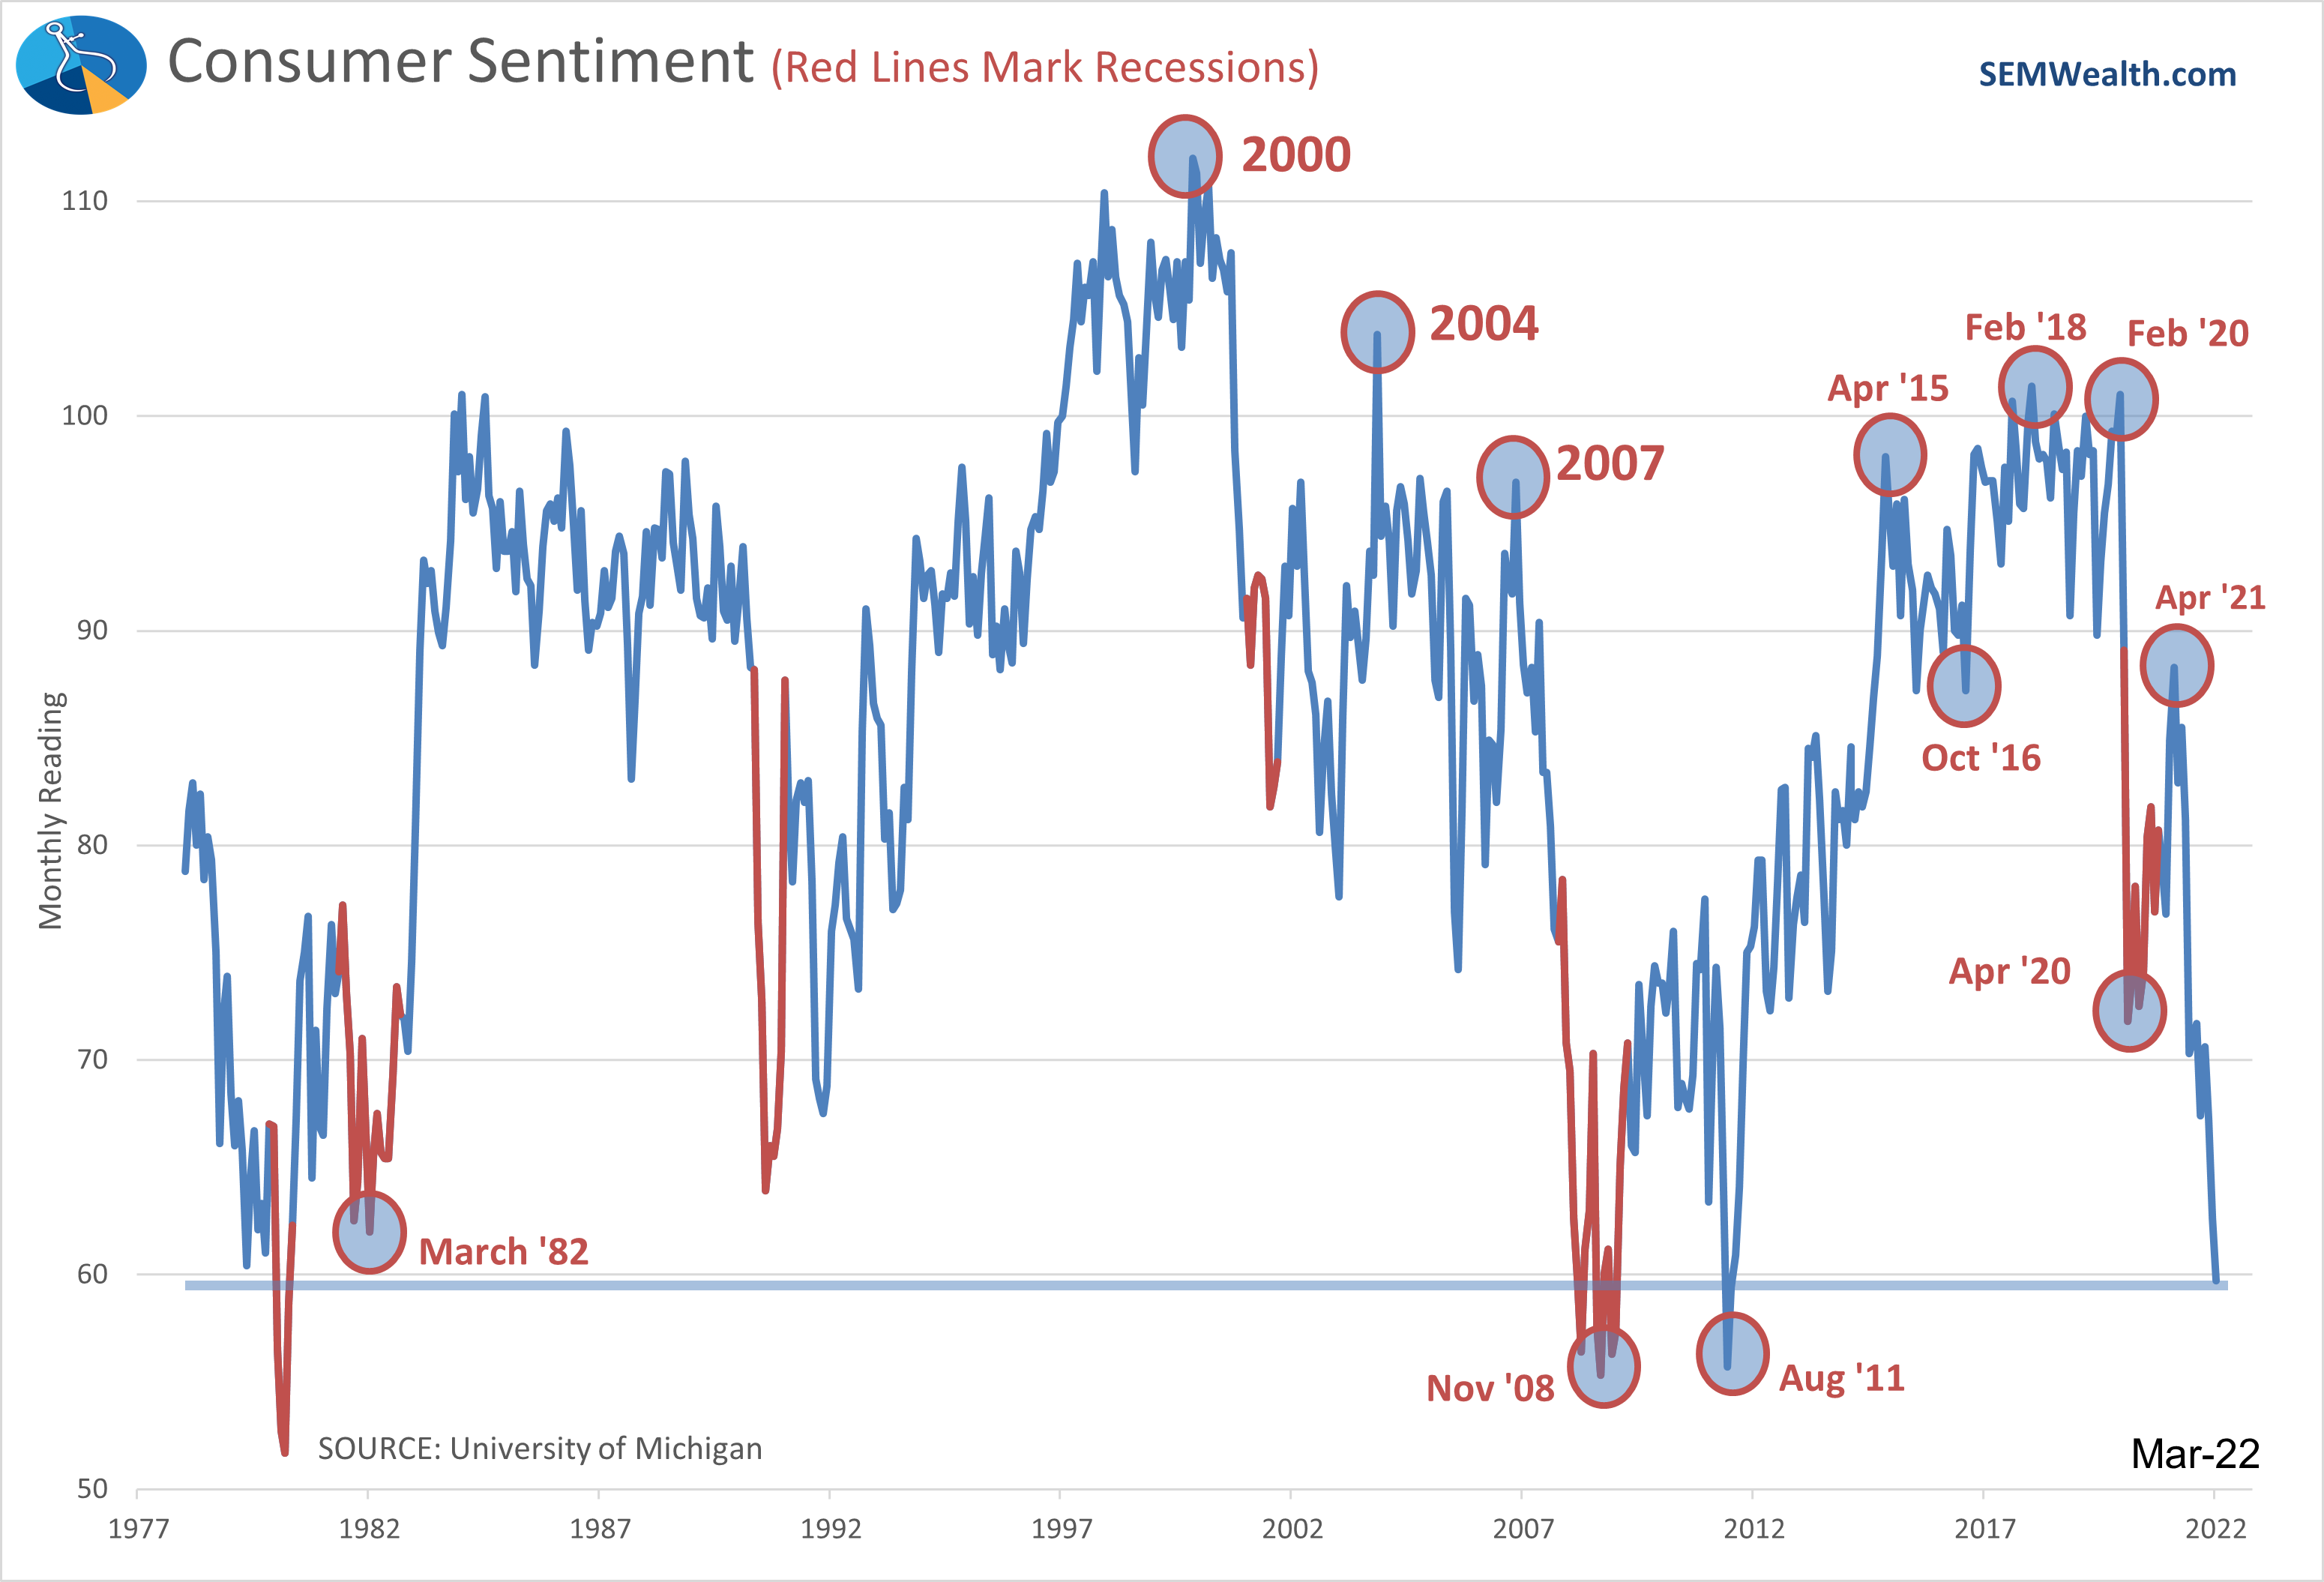
I continue to be amazed at how little enthusiasm the American consumer has had since April 2021. At that time we'd started mass-vaccinations, COVID restrictions were rolling back, and we had just replaced one of the least popular presidents in American history (based on approval ratings). All the things people supposedly longed for had come to fruition, yet here we are looking at the lowest level of consumer sentiment since the chaos of 2011 and the depths of the financial crisis.
Angry consumers do not open up their wallets and spend with confidence, or at least that's what the economic models say.
Inflation Surging
The CPI last week showed continued high levels of inflation. I don't like using CPI at all for many reasons too detailed to go into in this blog. I instead focus on the Fed's preferred inflation gauge, the Personal Consumption Expenditures (PCE) index. This is also the same inflation number used in GDP calculations.
"Normal" inflation has been assumed to be 3%, which goes back to the "modern" era of economic data (post World War II). However, this long-term average was skewed by the high inflation 50s and 70s. My first economics class in the late 1980s told me "normal" inflation was 7%, which was the average from 1947-1985.
We've enjoyed 2% inflation since 1990, despite the Fed doing everything in its power to push this number to 3%. Note how they failed in the 2010s when they essentially had some sort of stimulus program operating the entire decade. They only hit 1.5% when they were striving for 3%. Now inflation is above 3% and the Fed will have to act.
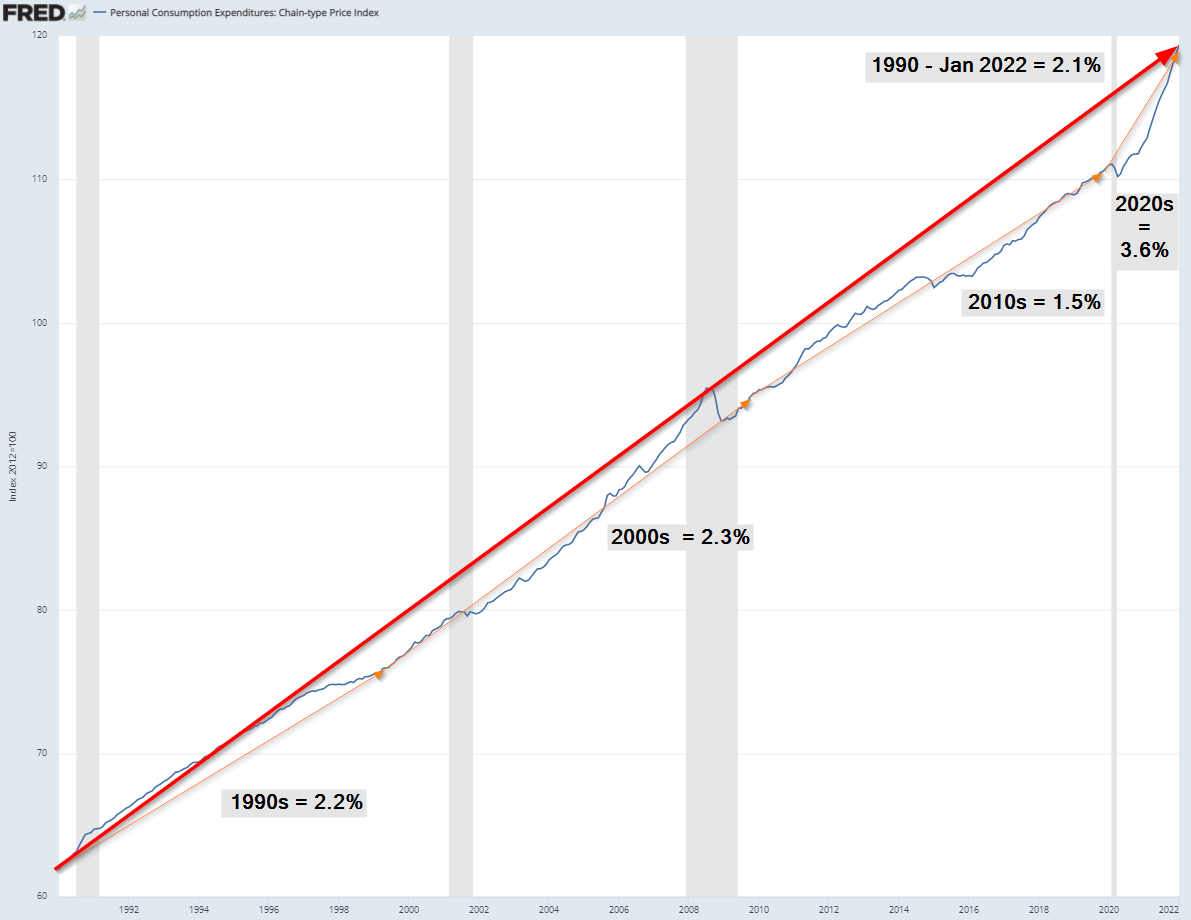
The big error in their calculations is their failure to understand the impact of the 3 rounds of stimulus put to work by Congress. In total 25% of GDP was added via the 3 stimulus bills with the Fed adding another 25% of GDP. What in the world did they expect would happen?
I shared this chart on Facebook exactly a year ago (after the passing of the 3rd stimulus bill):
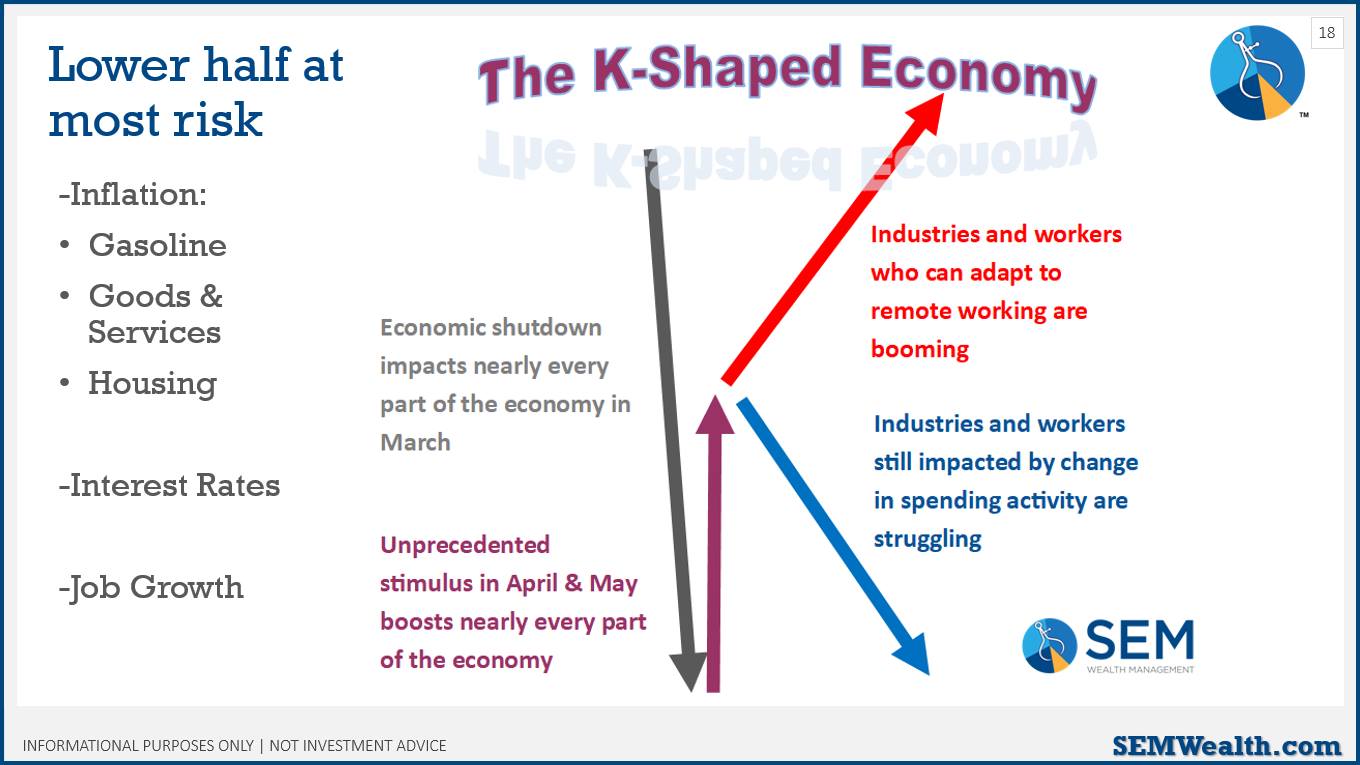
Notice my notes on the left. This is EXACTLY what we are seeing today. The people the stimulus was supposed to help have been hurt the most by inflation. I wrote this with the post:
The sad part is this bill will end up hurting the lower half of our economy more over the long run. Throwing money to people who didn't need it will create inflation, cause interest rates to go up, and ultimately hurt job growth. I'm predicting a recession in late 2022 or early 2023 when this temporary boost is no longer there and we're left with the unstable economy we had at the beginning of 2020.
It takes 9-12 months for one policy change to filter through the economy. We are 12 months out from the last stimulus bill and inflation is raging. Some want to blame Russia, but this was already a problem at the beginning of the year.
This has put the Fed in a terrible position (more on that below).
Signs of Financial Stress
Even before the oil price increase, we've seen Americans dipping more into their savings each month. The 3 rounds of stimulus caused a huge surge in excess income/savings, but based on the latest data from the Federal Reserve (January), Americans have eaten through all of that savings and now are saving the lowest percentage of their income since 2018.
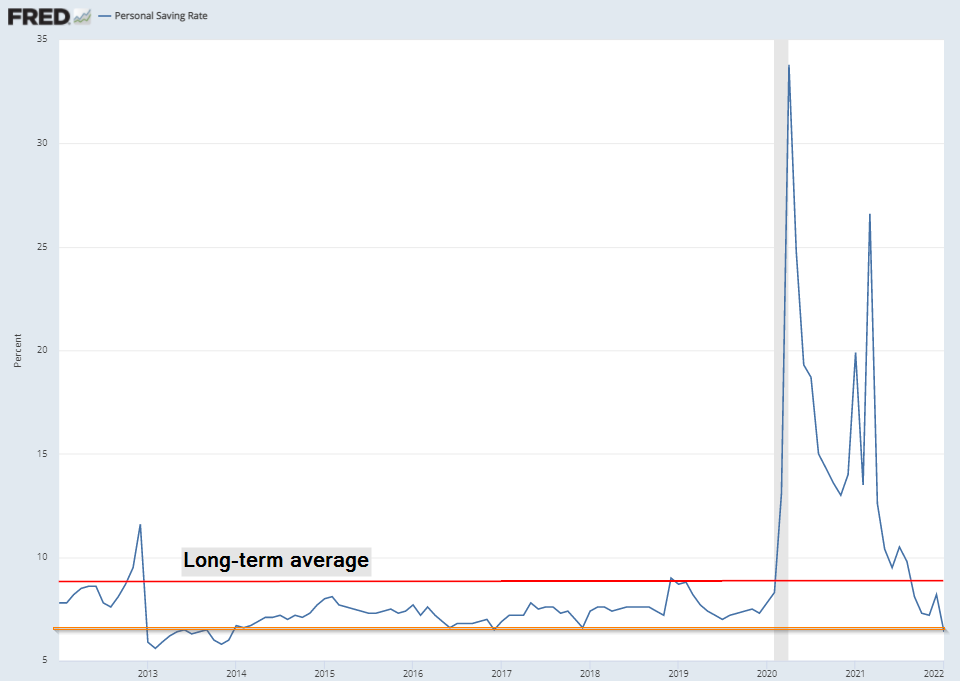
The "experts" keep talking about the "unprecedented" amount of money sitting in savings/money market accounts, but that is held mostly by the wealthiest Americans. This number shows Americans on the lower levels are struggling. The Fed will end up hurting them even more.
The Fed is Clueless
I honestly cannot fathom what the Fed is thinking. They should have been shutting down their stimulus programs when Congress decided to do the heavy lifting. During 2009-2012 the Fed continuously told Congress they could only do so much with monetary policy. In every single Congressional testimony, the Fed chair reminds them that fiscal policy (controlled by Congress) has a far greater impact in stimulating the economy. Yet for some inexcusable reason the Fed kept creating money week after week to "stimulate" the Wall Street banks. They kept short-term interest rates at zero, hurting those relying on fixed income. They wanted everyone to spend more money for some unknown reason.
A month ago, most experts expected the Fed to raise interest rates by 0.5% in March. Now most experts expect just a 0.25% increase this week with a "measured" approach the rest of the year. The Fed is so far behind the inflation curve it is ridiculous. They seem to care far more about keeping asset prices in bubble territory than actually controlling inflation.
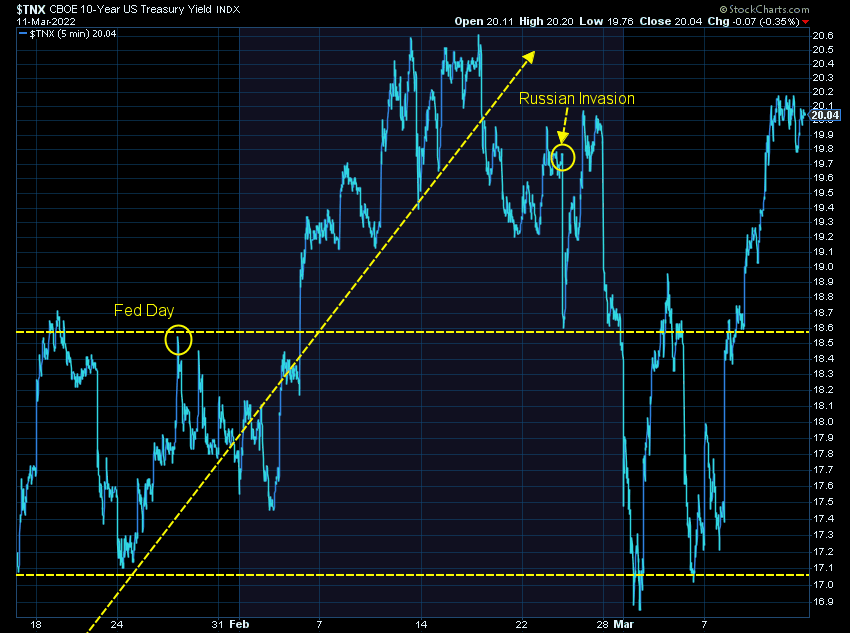
Normally, you'd see long-term rates start to move lower as the Fed raises short-term rates. Instead we've seen long-term rates move up. Unlike the Fed, bond investors are worried about long-term inflation because the Fed has waited far too long to end their stimulus programs.
Interestingly enough, the bond market has already raised interest rates almost exactly 0.25% on long-term bonds since the last Fed meeting. Rates are now above where they were at when Russia invaded Ukraine. An economic slowdown would normally be thought of as deflationary, but with both the developments in Ukraine and the big shift from the Fed to a much slower rate-hike cycle, the bond market is worried about inflation.
This makes it tough for normal (passive/traditional) investors. Looking at our numerous trading systems, every bond category is in a downtrend, even categories typically seen as "safe havens".
What's next for stocks?
RealMoney.com (and former USA Today) columnist Helene Meisler posted this chart over the weekend:
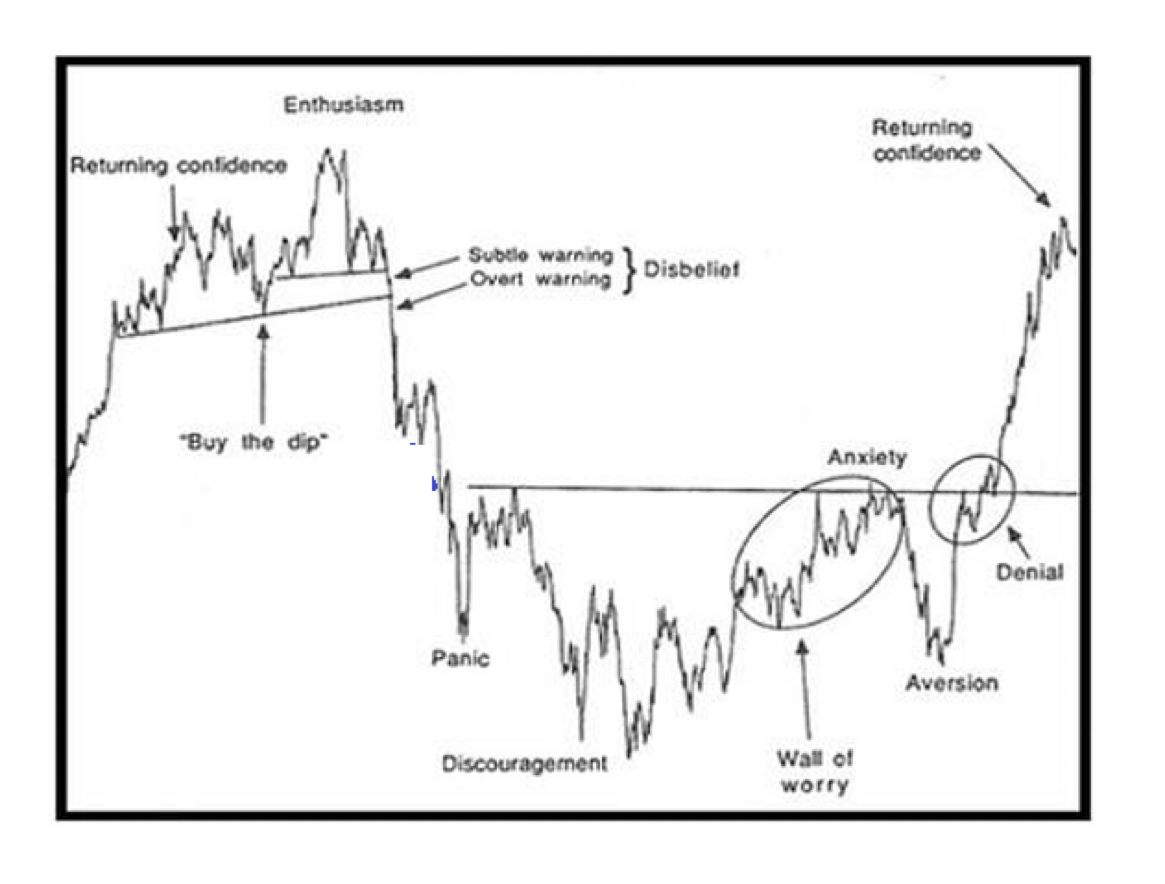
Here's something to ponder this weekend. Where do you think we are on this chart? pic.twitter.com/xhlU630523
— Helene Meisler (@hmeisler) March 12, 2022
Most of the answers said, somewhere around "discouragement". They were most likely looking at a short-term chart:
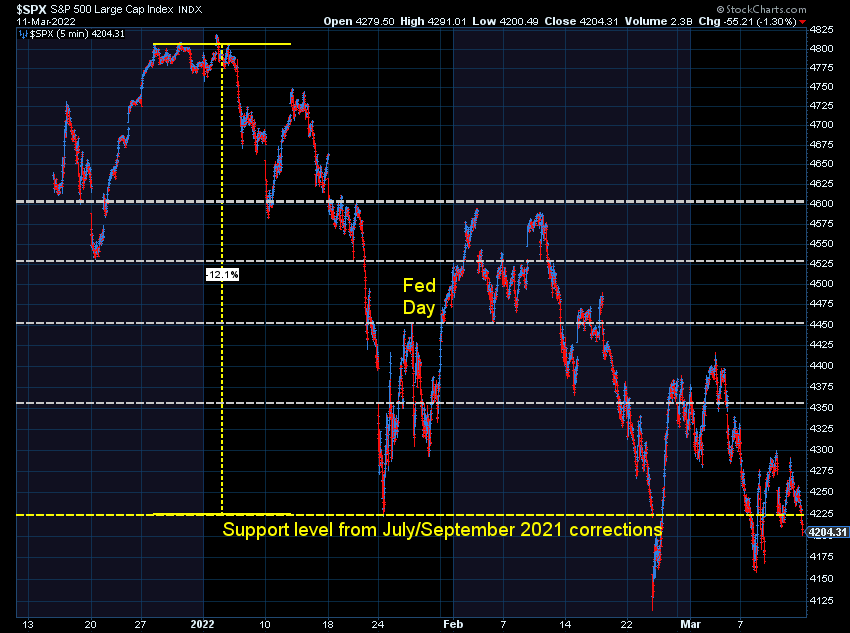
It certainly looks like we've had the "panic" and even the "discouragement" when the "retest" failed (twice).
Zooming out, it could easily be argued we are somewhere in the "disbelief" section – which is just BEFORE the panic phase.
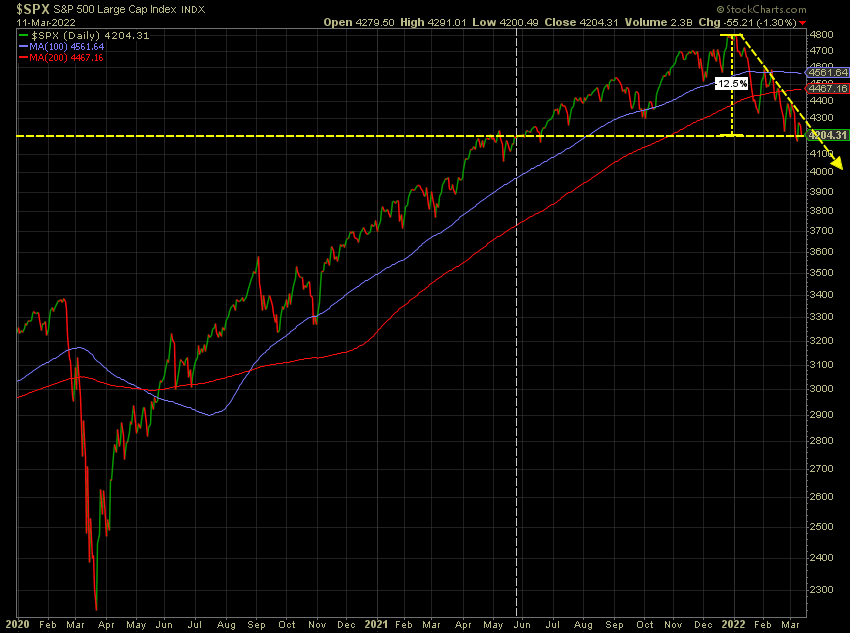
Market history doesn't repeat, but it often rhymes. We are well overdue for a true bear market (35-50% drop in prices which lasts 18-24 months before the ultimate bottom.) I'm not saying it's started, but it should be in the realm of legitimate expectations for "normal" (passive/traditional) investors. Combine that with the potential for a down market for bonds and you should EXPECT a big drop in portfolio values in those "normal" strategies.
The market is due for a bounce and the most important takeaway from the emotional cycle chart is how volatile the market can be. In the midst of it all it can be quite emotional. You may be certain the worst is over or the worst is still to come. The most important part is to have a plan in place, which of course we do at SEM.
One again, working as expected
Here is a summary of the moves we've made thus far during the correction:
- October 1: Economic model moves from "bullish" to "neutral". Dynamic Income Allocation (DIA) (and Cornerstone-Income) sells half of dividend stock exposure. Dynamic Aggressive Growth (DAG) sells half of small cap exposure. Bonds are added in place of these positions. As mentioned above, the model remains in "neutral", which is the most volatile part of the cycle.
- January 3: AmeriGuard & Cornerstone Balanced & Growth core positions eliminated small cap growth and added Large Cap Value.
- January 10: First sell signal in High Yield Bond system, reducing exposure by 1/4 in Tactical Bond (TB).
- January 19: Second sell signal in High Yield Bonds, reducing exposure in TB, Tax Advantaged Bond (TAB), and Income Allocator (INA).
- January 24: Third and fourth (final) sell signals in High Yield Bonds, reducing exposure in TB, INA, and Cornerstone-Bond (CS-BND). This puts TB & CS-BND in fully "risk-off" positions.
- January 31: INA sells last high yield bond position, placing this model fully in "risk-off" mode.
- February 22 (two days before Russia invaded Ukraine): First trend indicator triggers in AmeriGuard & Cornerstone Balanced & Growth models, cutting stock exposure to half of the target range (Balanced now at 50% stock, Growth at 85%).
- March 7: Second trend indicator triggers in AmeriGuard & Cornerstone Balanced & Growth models, cutting exposure to minimum of the target range (Balanced now at 30%, Growth at 70%).
The most important thing is to have a strategy in place to handle ALL types of markets. If you don't, let's talk.


