Throughout May the fear for many market participants was the US economy was heading into a recession. Last week, stocks and bonds staged an impressive rally with the riskiest of assets rallying the most. The justification from market commentators was interesting.
- The economic data has slowed significantly enough the Fed will likely not need to raise rates as aggressively as previously thought.
- Inflation appears to have peaked in March, with the April number dropping slightly.
- Stocks and bonds have dropped to levels that are attractive if we do not have a recession.
At SEM we thankfully don't make predictions. This is especially helpful when the data is moving quickly and we are dealing with some unprecedented economic and financial conditions. The pandemic changed the structure of our economy (both positively and negatively). Congress and the Fed reacted in a way that has never been done before. We are dealing with inflation levels we haven't seen in 40 years. The social mood as measured by consumer sentiment and presidential/Congress approval ratings is extremely low. Corporate profit margins hit all-time highs last year. Stock valuations are still above the long-term average.
All of that adds up to an environment which still warrants caution. The weekly talking points at the bottom of the page are the same ones we've been using. How you adjust your portfolio (if at all) depends on your time horizon.
This week, I want to walk through a bunch of charts to give you a picture of our current environment.
Economic growth still moving to "below average" rate
There hasn't been a single piece of economic data that says the risk of recession has been removed. Our economic model moved to "bearish" at the beginning of April. We'll have the 'final' May numbers on Friday, but here is our dashboard of indicators.
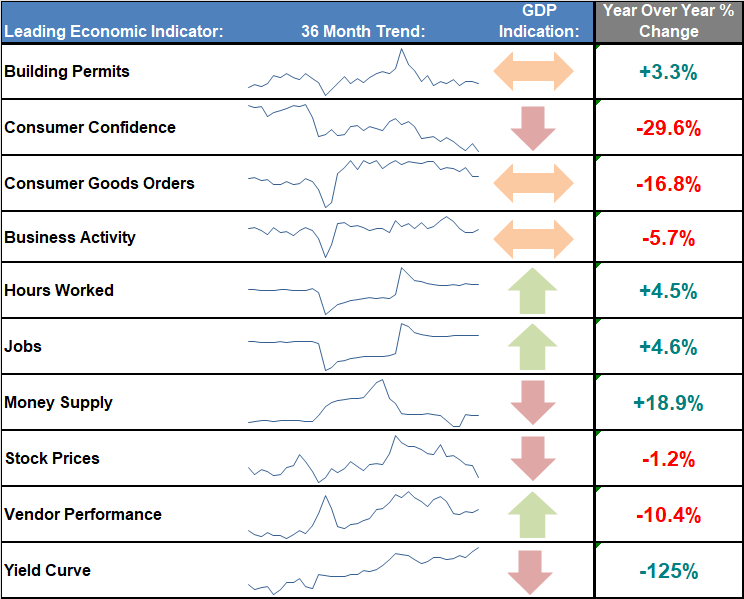
The indicators I'm watching the closest are Personal Income and Consumer Sentiment. We are a consumer driven economy. Runaway consumer spending during COVID, thanks to 3 massive rounds of stimulus boosted the economy artificially. If income drops too much and sentiment continues to decline, the economy is going to struggle.
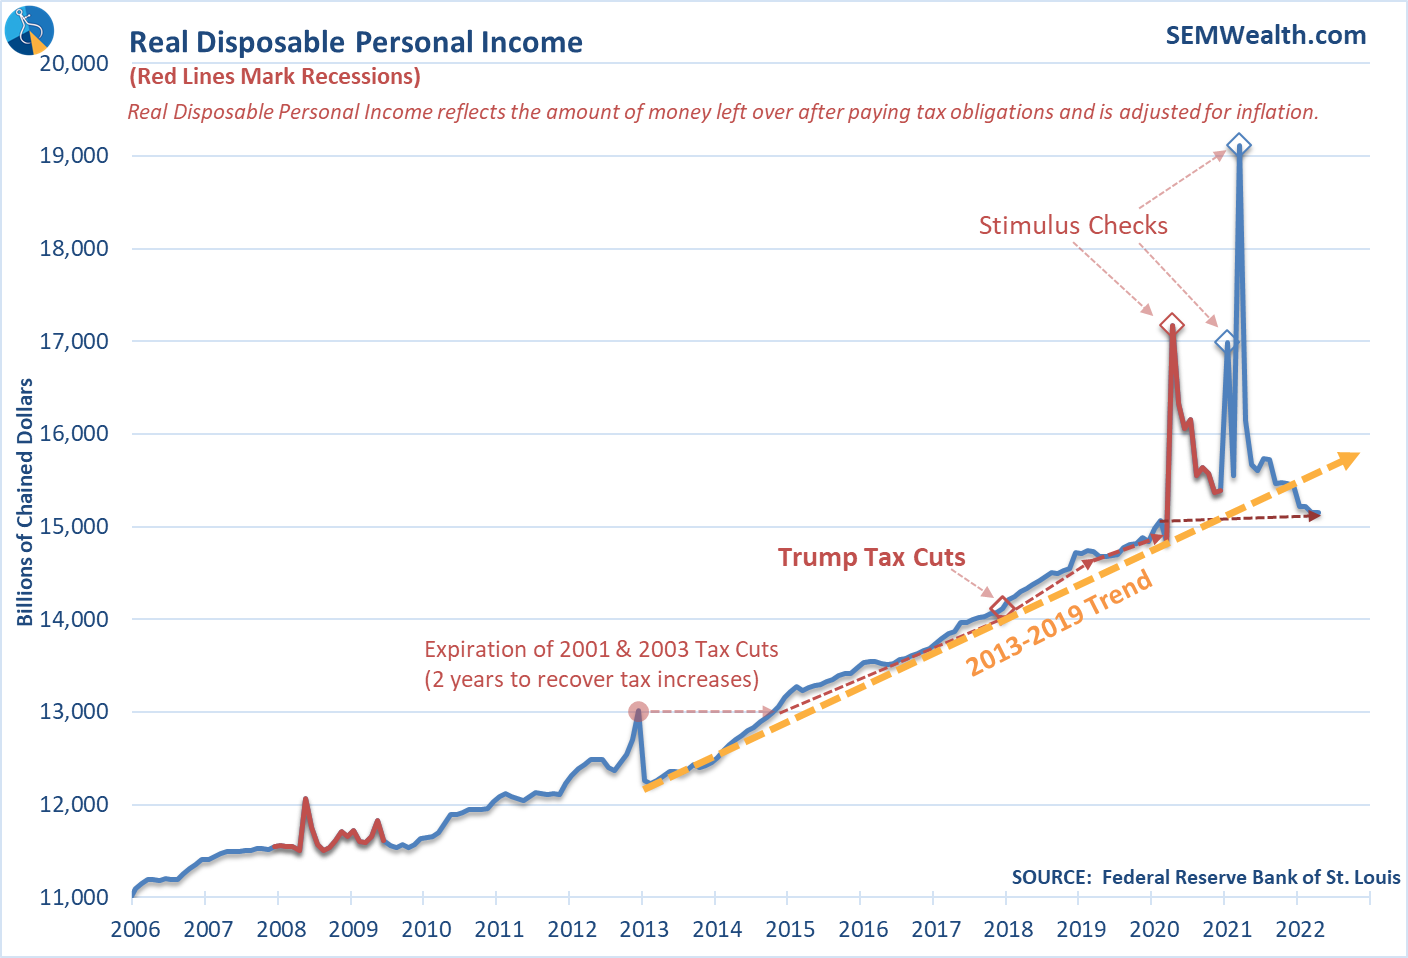
Real Disposable Personal Income is the money we have left after paying taxes and adjusting for inflation. It is essentially how much money you have to live on. The data through April shows consumers are now barely above the same level of income as they were in February 2020, just before COVID hit.
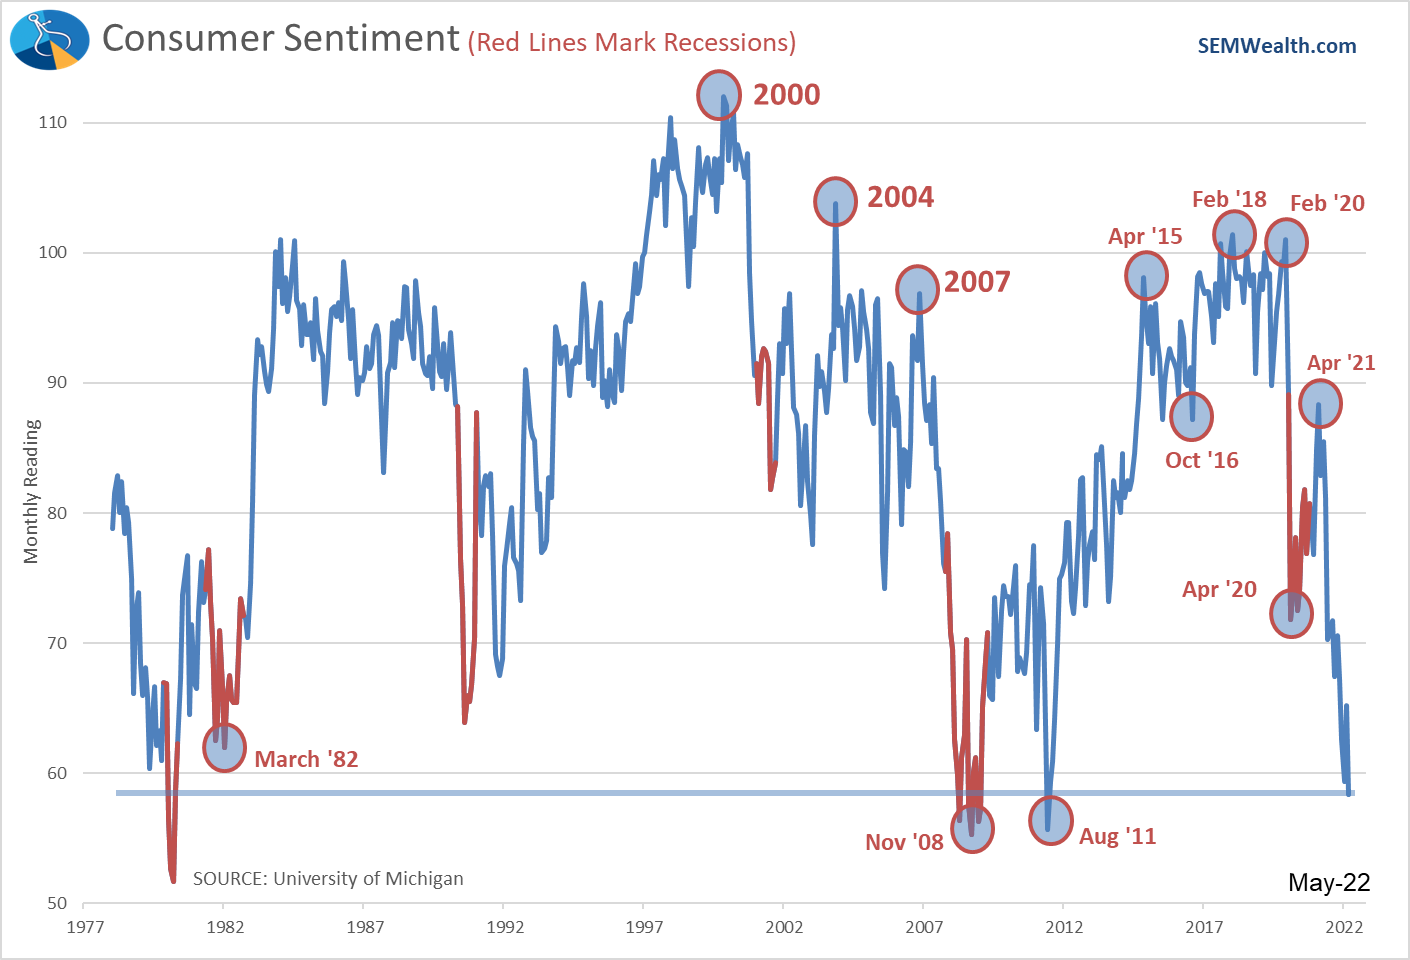
Sentiment continues to run at recession levels.
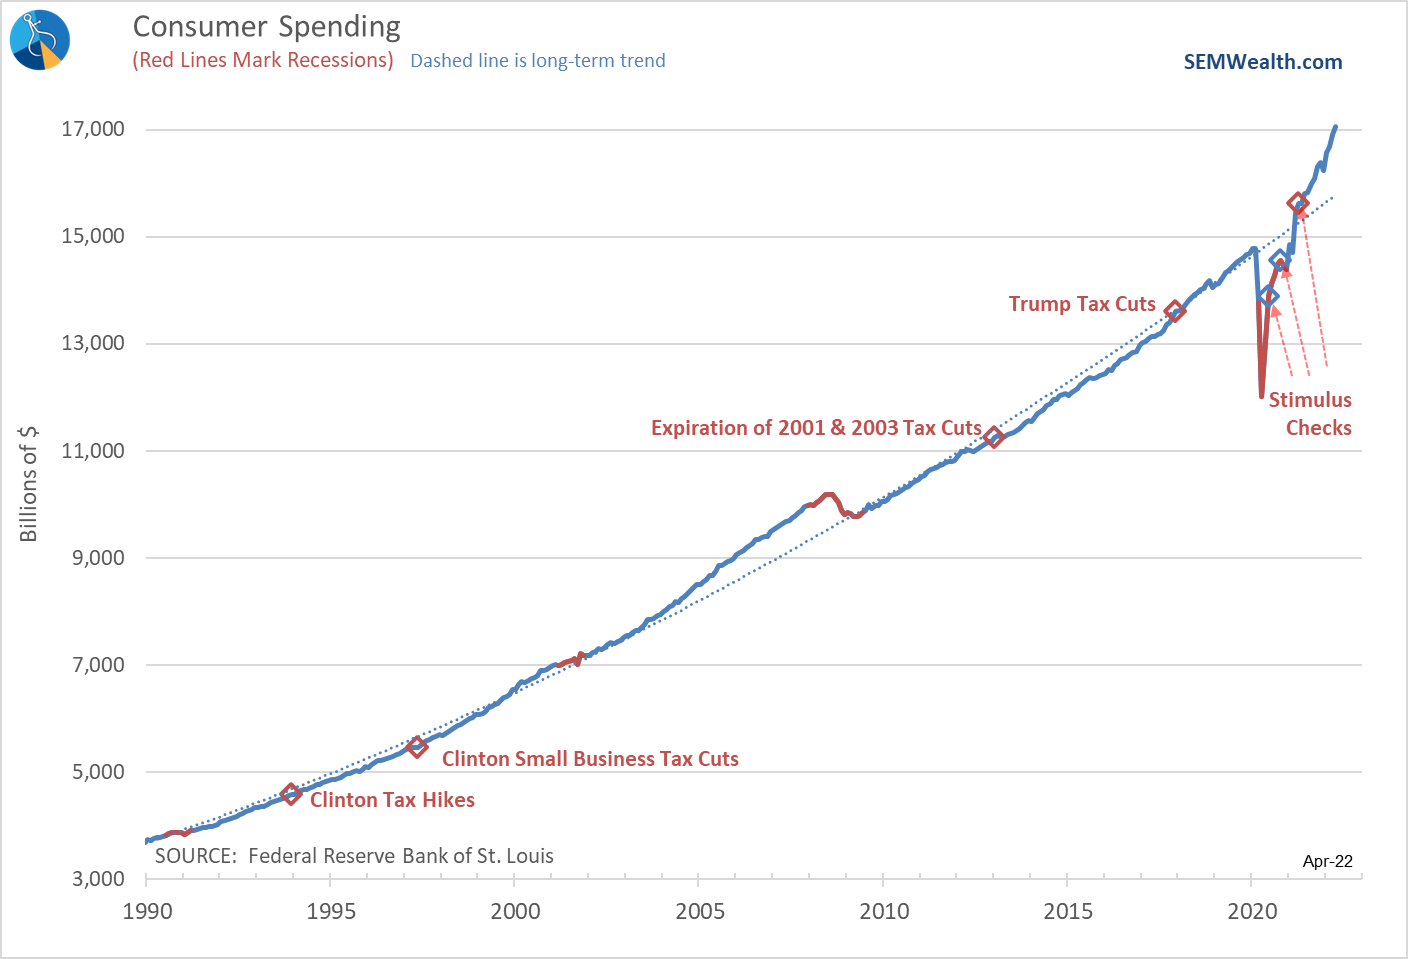
Right now consumers are still spending money at a healthy clip. Based on conversations I've had with travel experts, this is directly related to families taking trips they had to cancel in 2020 and 2021. The expectation is once we get through the travel season, we will see spending drop significantly.
Why do we trust the Fed?
The most interesting part of the rally last week is the thought process that the slower economic data will lead the Fed to slow their interest rate hikes enough to not cause a recession. Even though the Fed has a horrible track record of predicting recessions and more importantly being able to prevent them, most people still trust them.
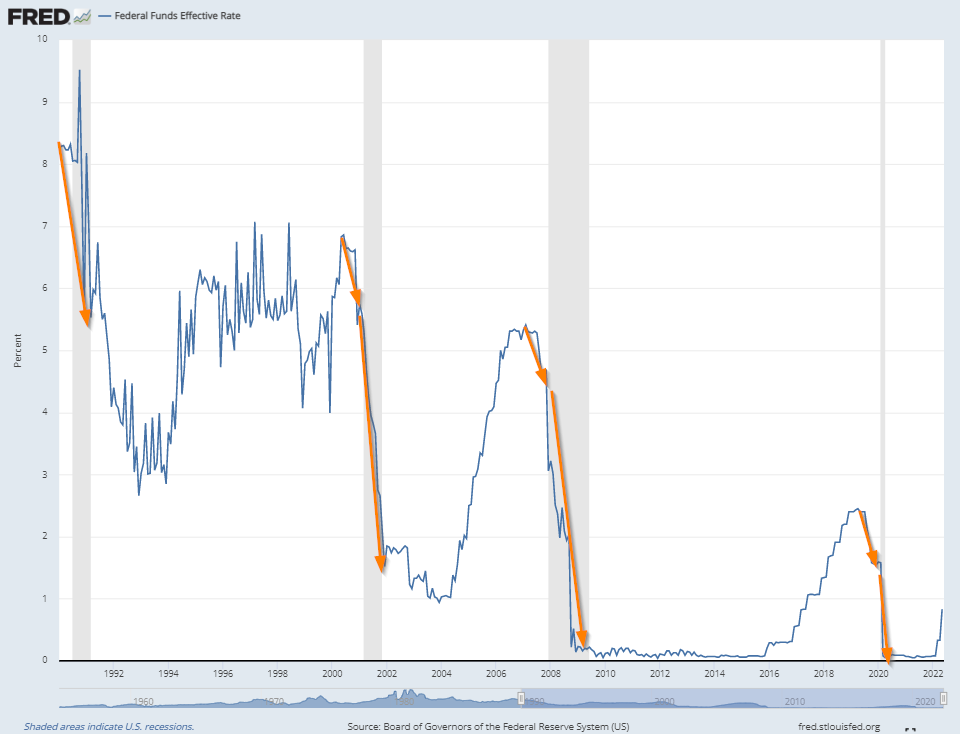
This chart shows the Federal Funds rate (short-term interest rates set by the Fed), which is supposed to be their primary tool to control the economy. It also helps illustrate Fed policy moves before, during, and after a recession (the grey bars).
During the last 4 recessions we saw the Fed cutting rates BEFORE the recession and then continue cutting rates DURING the recession. The key takeaway here is we still had a recession even though the Fed cut interest rates. (Note during 1990 the Gulf War caused some strange fluctuations in the Fed Funds rate beyond their control.)
The bigger issue is what the Fed does with their Balance Sheet. They say they are going to begin "unwinding" their balance sheet, yet all they have done is stop buying more assets. They haven't even begun selling those assets yet and we already are looking at an economy that is slowing rapidly.
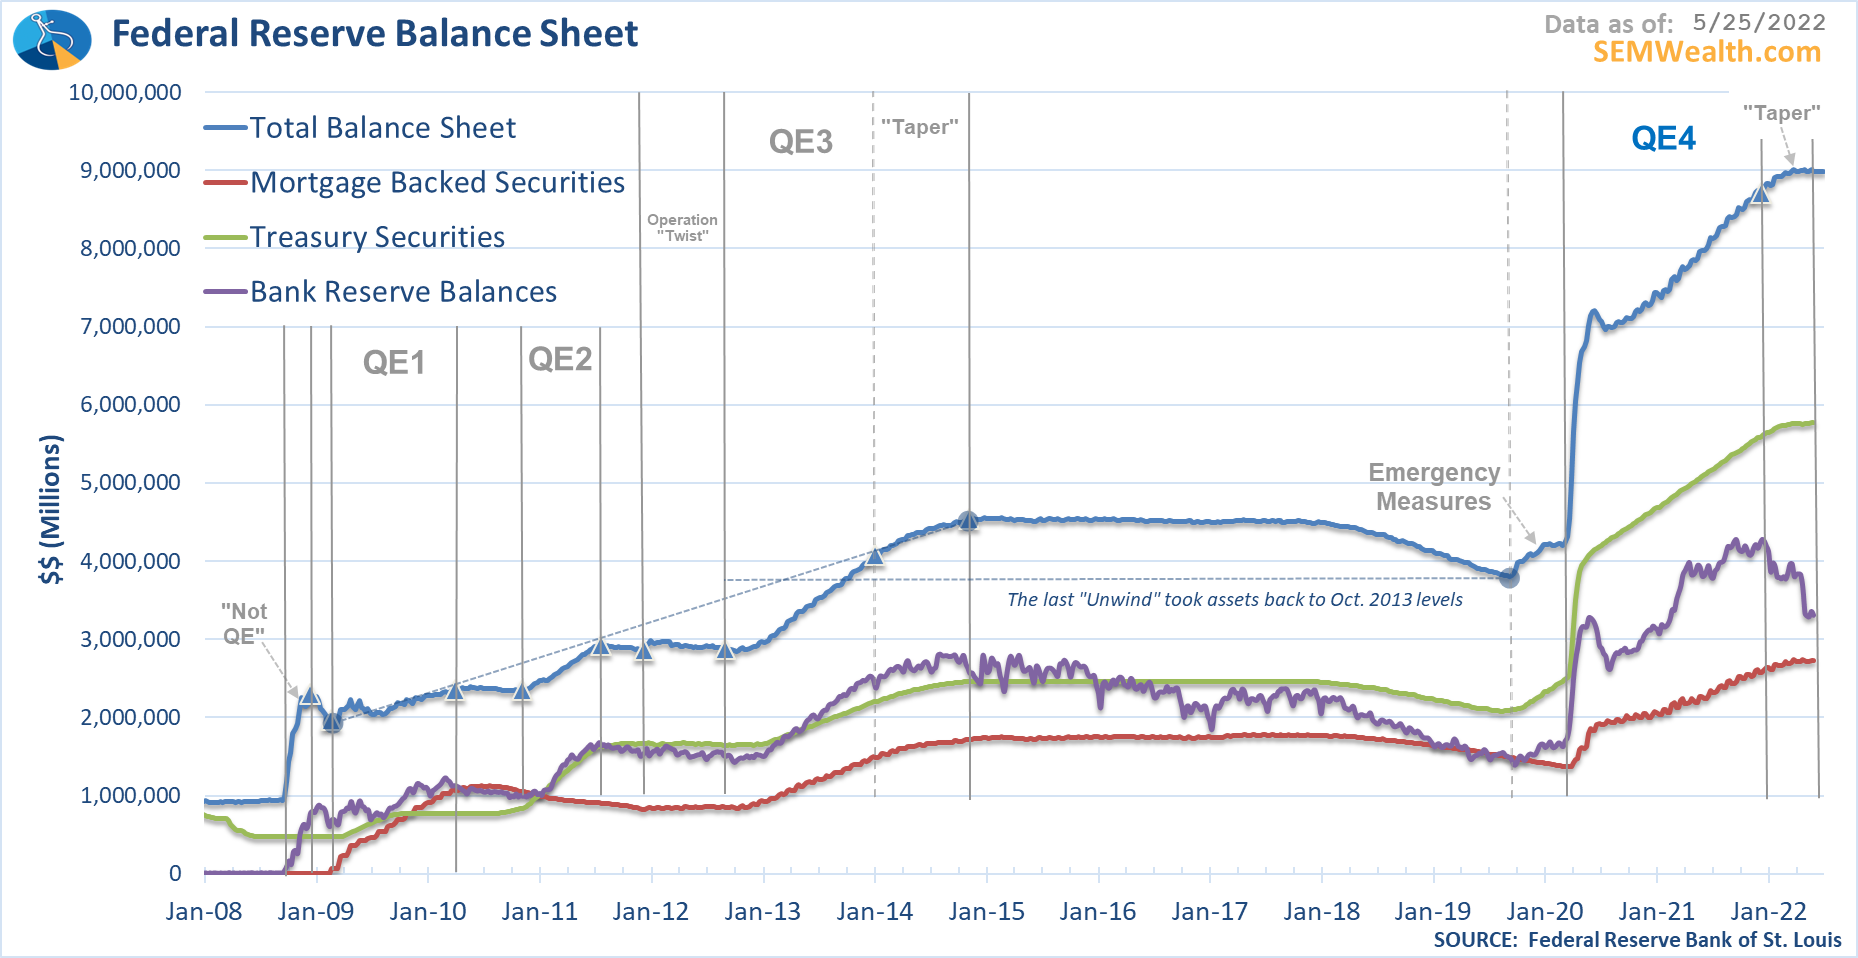
In a much healthier environment in 2015 and 2018 the Fed's "taper" and "unwind" caused problems with the economy and stock market. In both those time periods there was a legitimate concern the economy was heading into a recession, which eventually forced the Fed to reverse course (for a while).
The difference this time is inflation
A big narrative for the rally is the "peak" of inflation. Yes, the rate is now (slightly) lower, but it is still very high. The concern I have is we could be looking at a systematically higher level of inflation for the next few years. This will handcuff the Fed and not allow them to be laser focused on propping up stock prices (or the economy.)
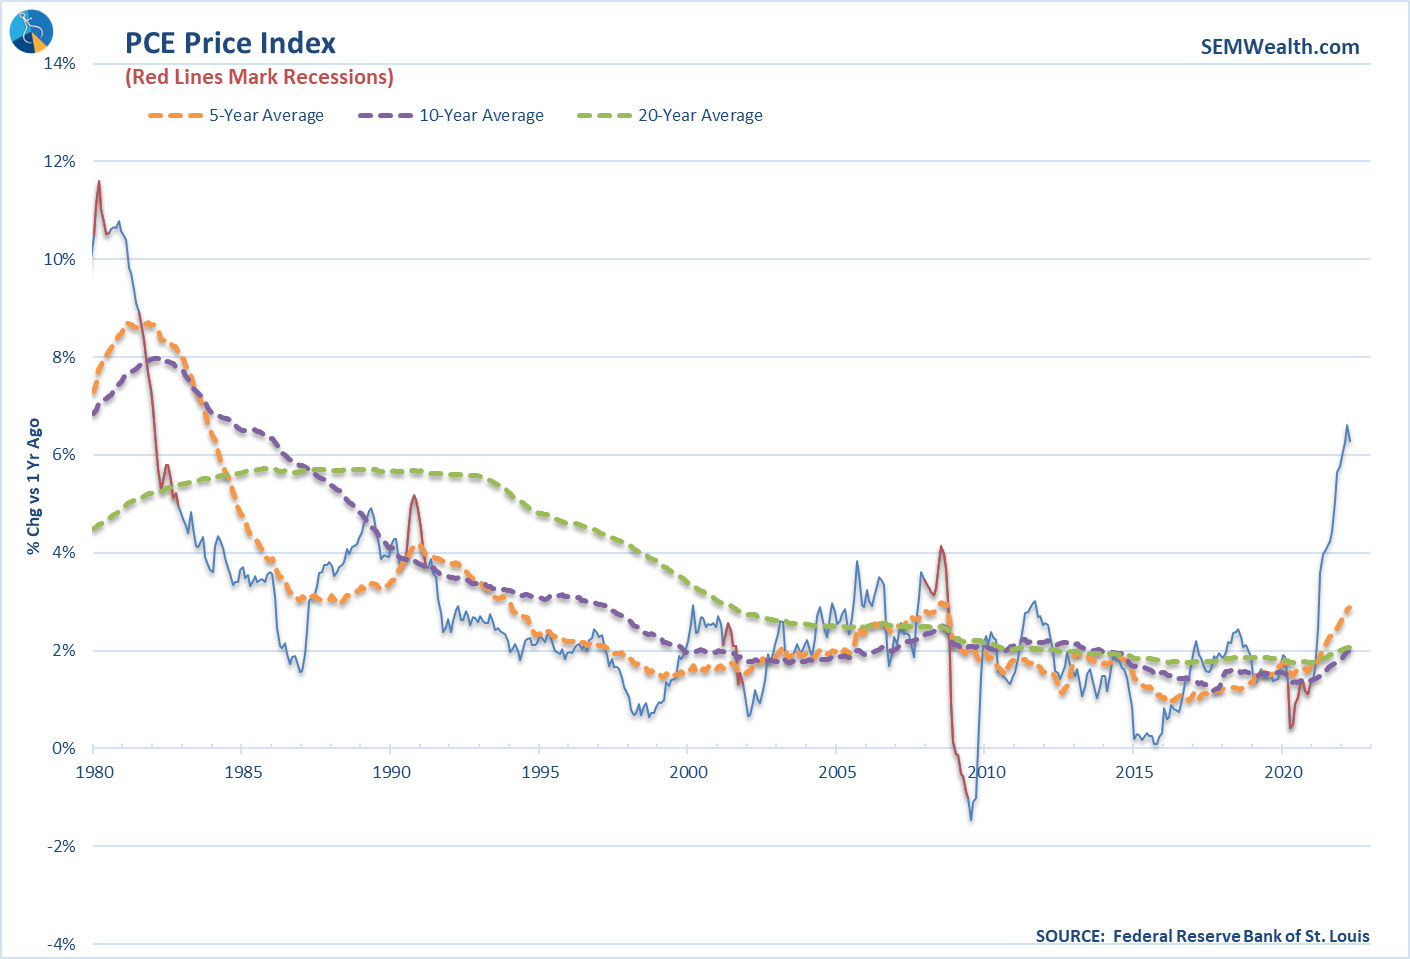
The 5-year average is now just under 3%. The Fed said they are comfortable with inflation between 2-3%. As long as we see inflation above 3%, the Fed is going to be forced to pull back their stimulus. This is bad for stocks (and some bonds).
What is the bond market telling us?
I've always said bond traders are smarter than stock traders (in terms of giving us long-term signals.) This is because stock traders only care about selling their stocks at a higher price. They don't mind buying high if they believe they can sell higher. Bond traders, on the other hand, have to look at whether or not the bond issuer will be able to pay them back in full when the bond matures. This makes them look at the credit worthiness of the borrower, which also means looking at the economic environment.
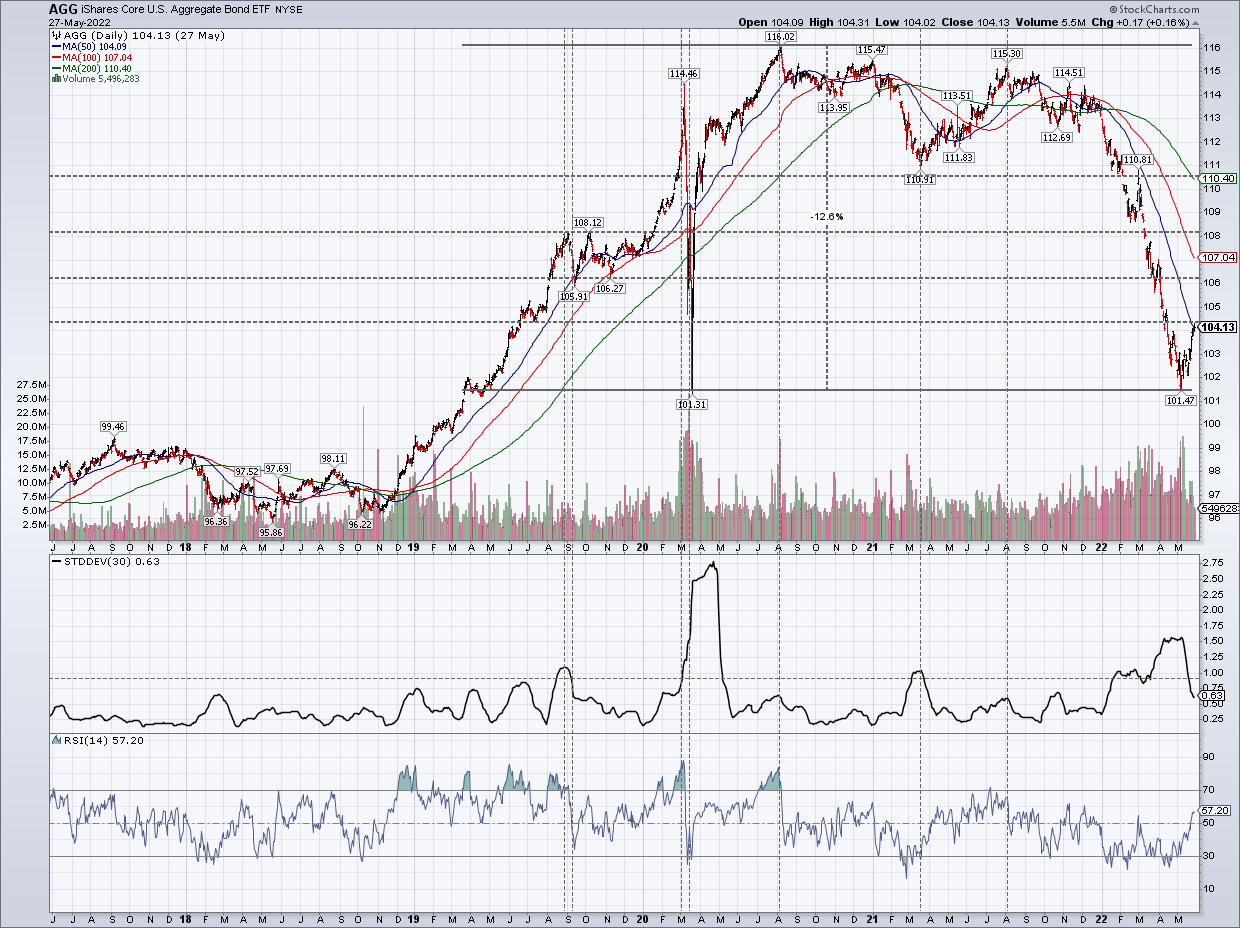
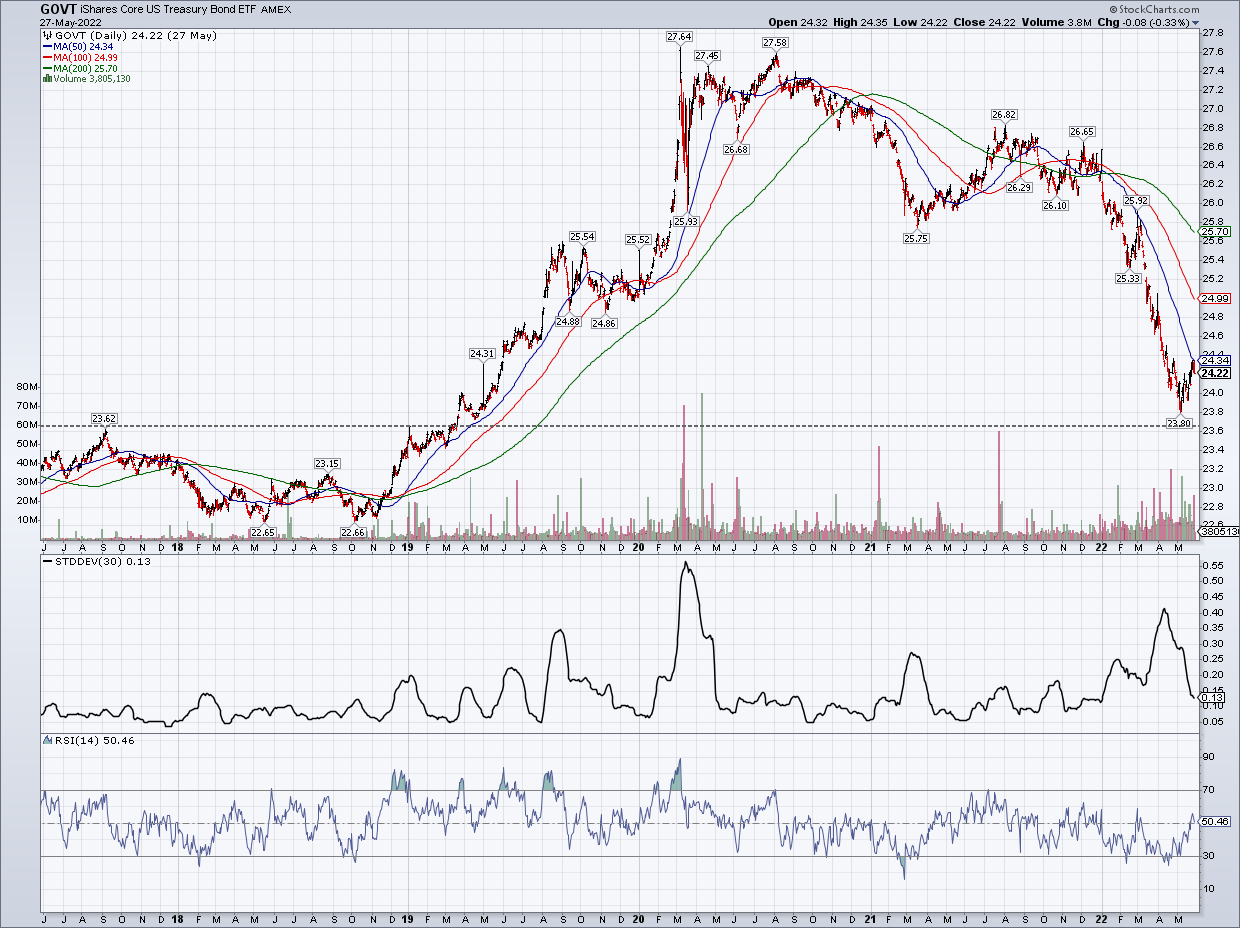
Bonds have had a horrible year with nearly every category dropping by significant amounts. My prediction was if the bond market believed the Fed was finally getting serious about fighting inflation, we would see bonds begin to rally. Treasury bonds would be seen as a safe haven, yields would fall, and prices would rise. Every morning I walk through the various segments of the bond market. Here is what it looks like.
Aggregate Bond Index "V-Bottom"?
Government bonds attempting to bottom
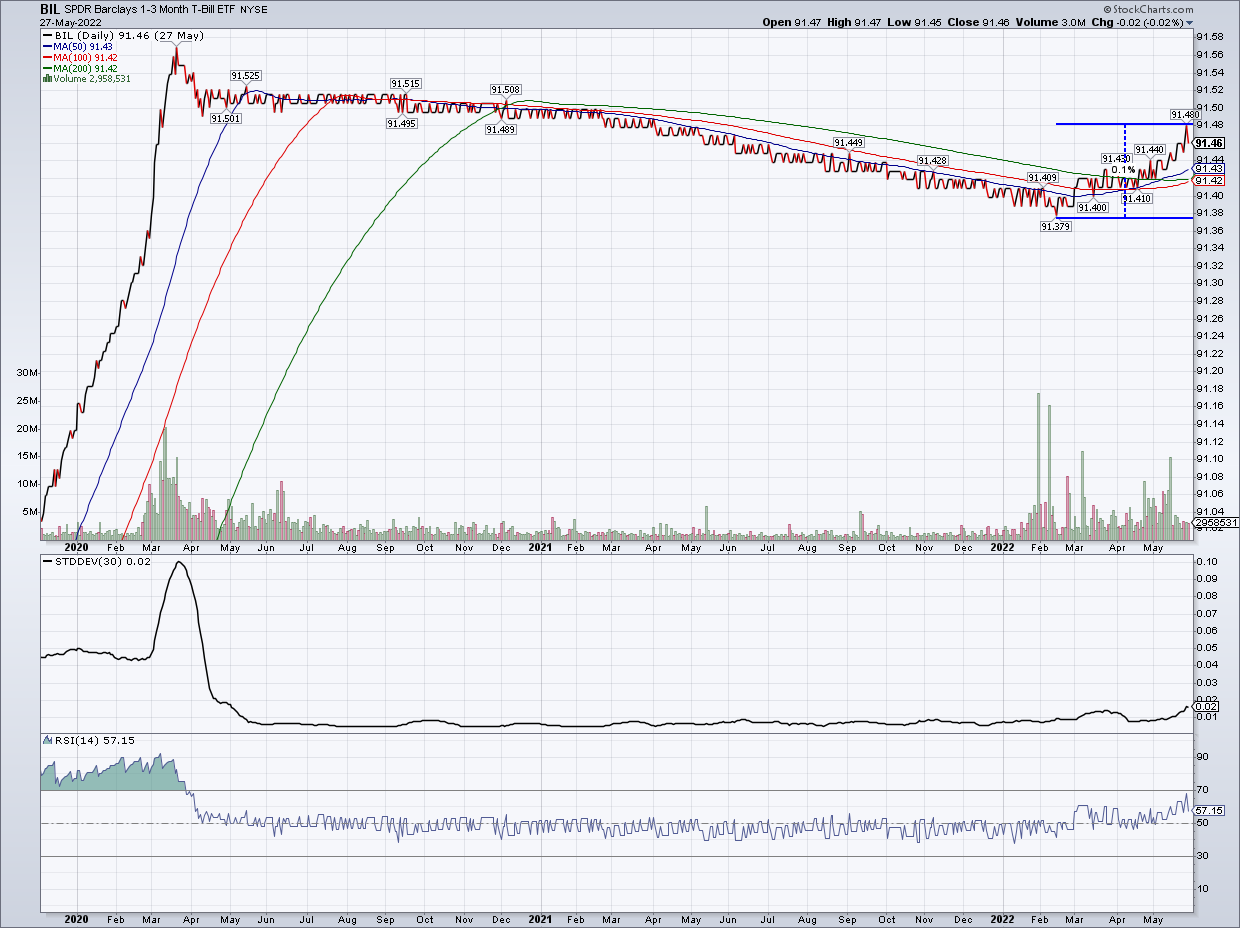
1-3 Month T-Bills starting to rally
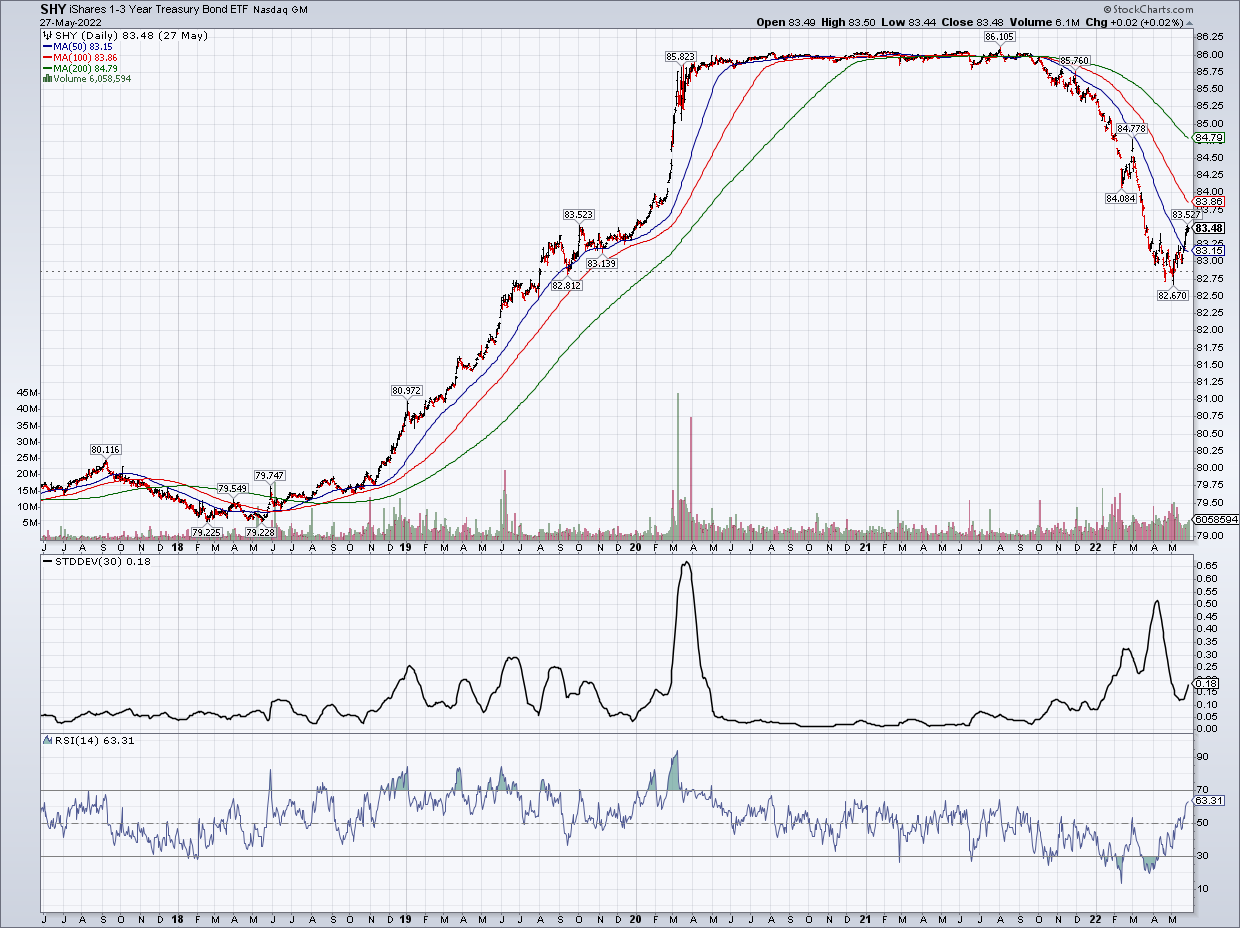
1-3 Year Treasury Notes continue to strengthen
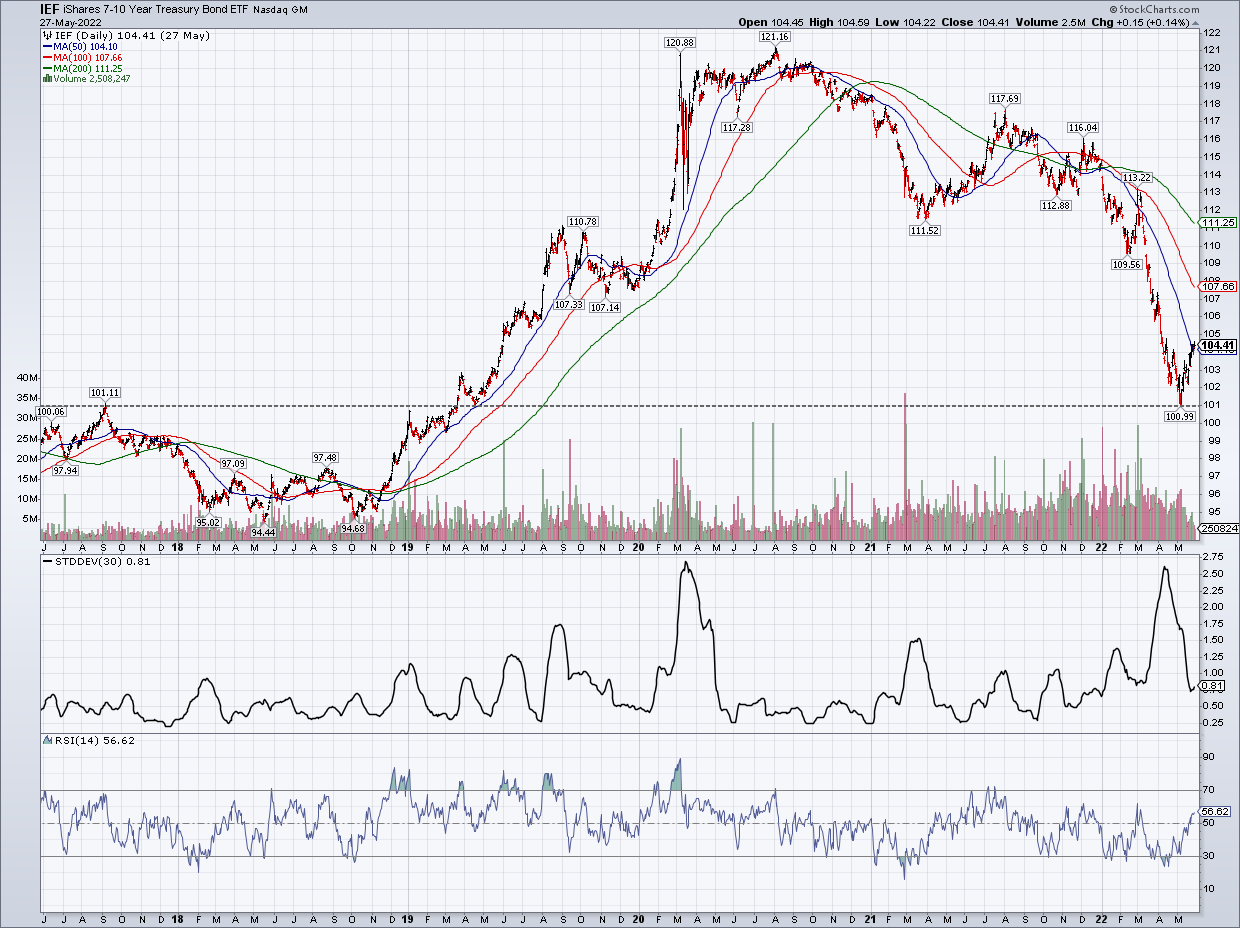
7-10 Year Treasury Bonds attempting a rebound
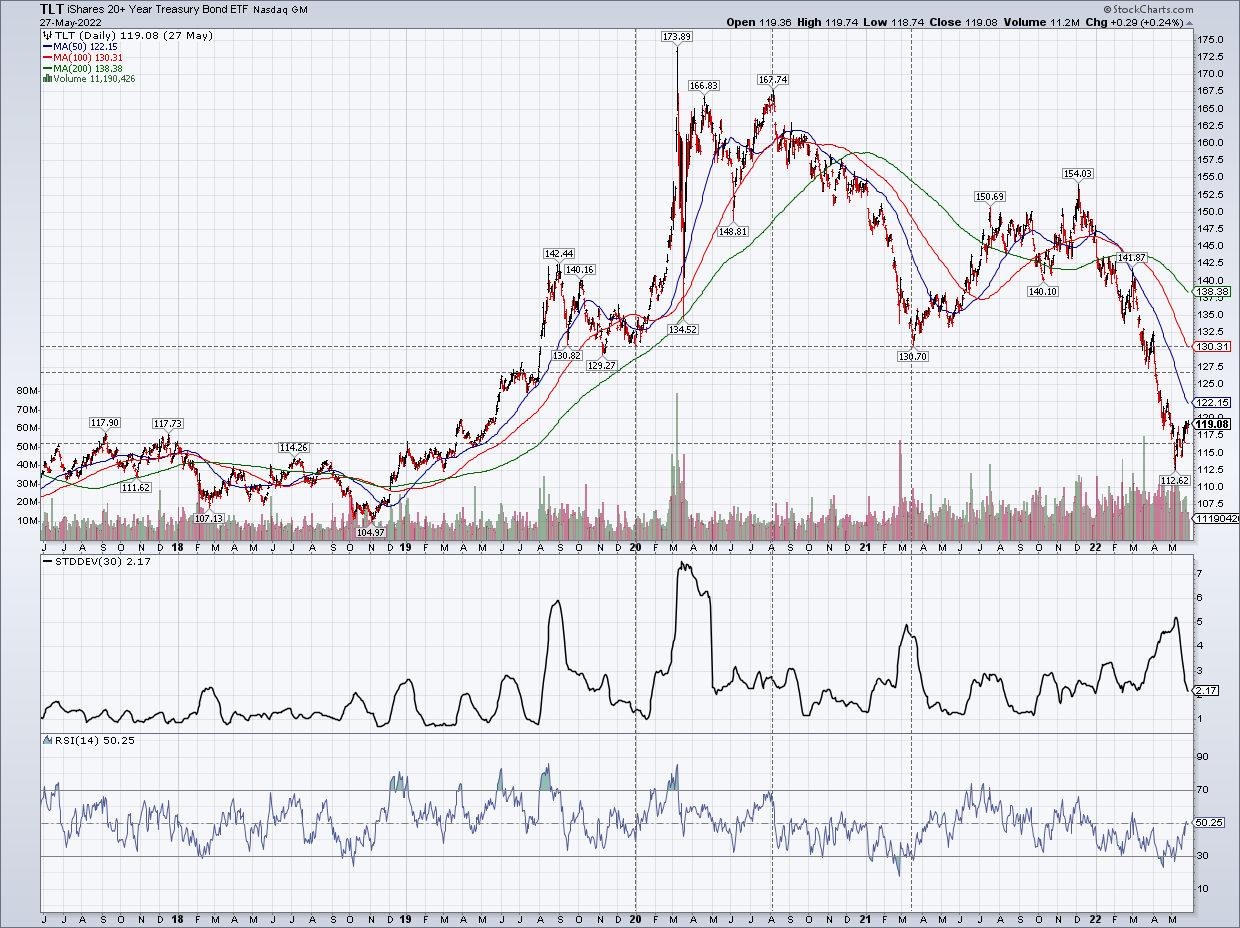
Long-term Treasuries still weak
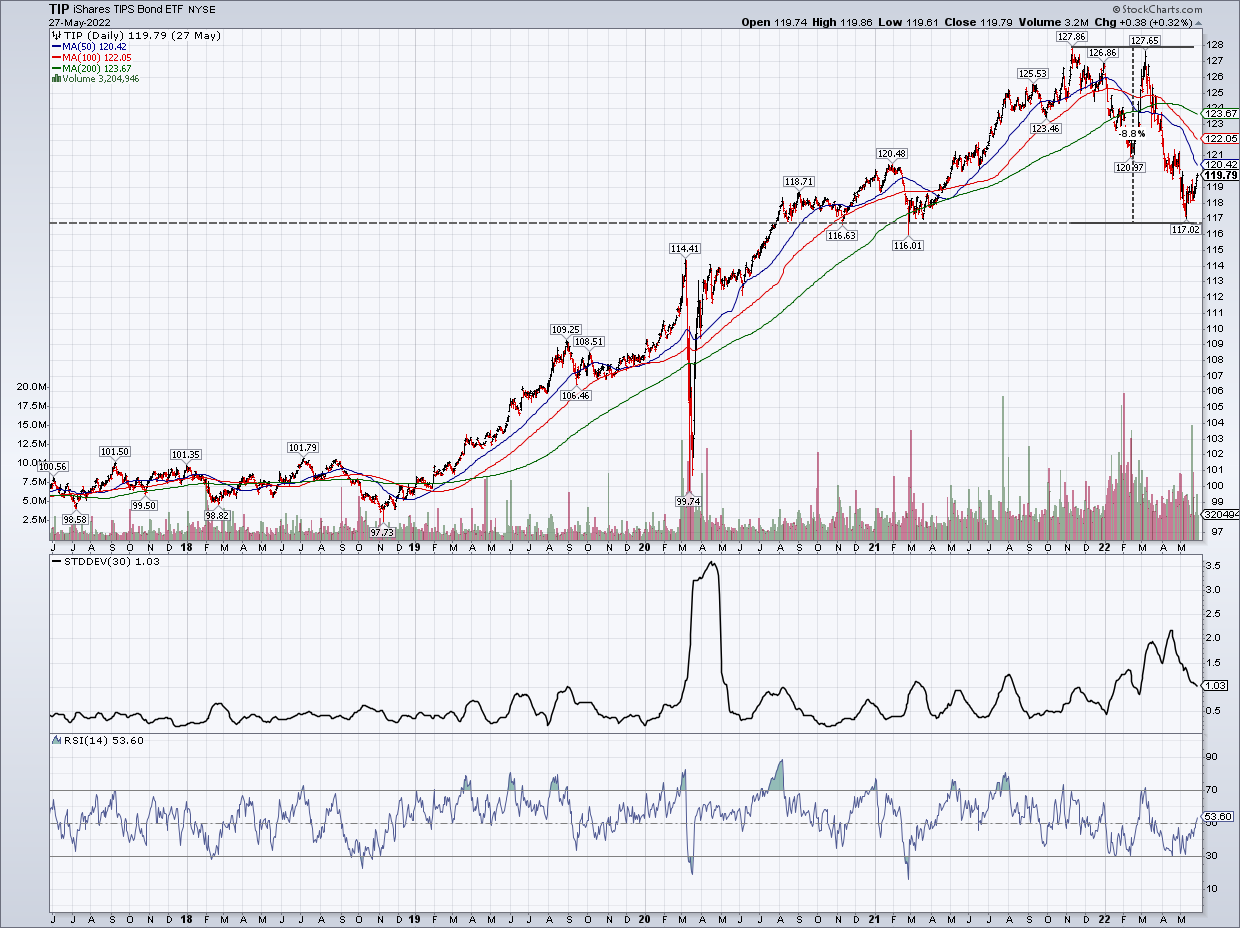
TIPS still struggling
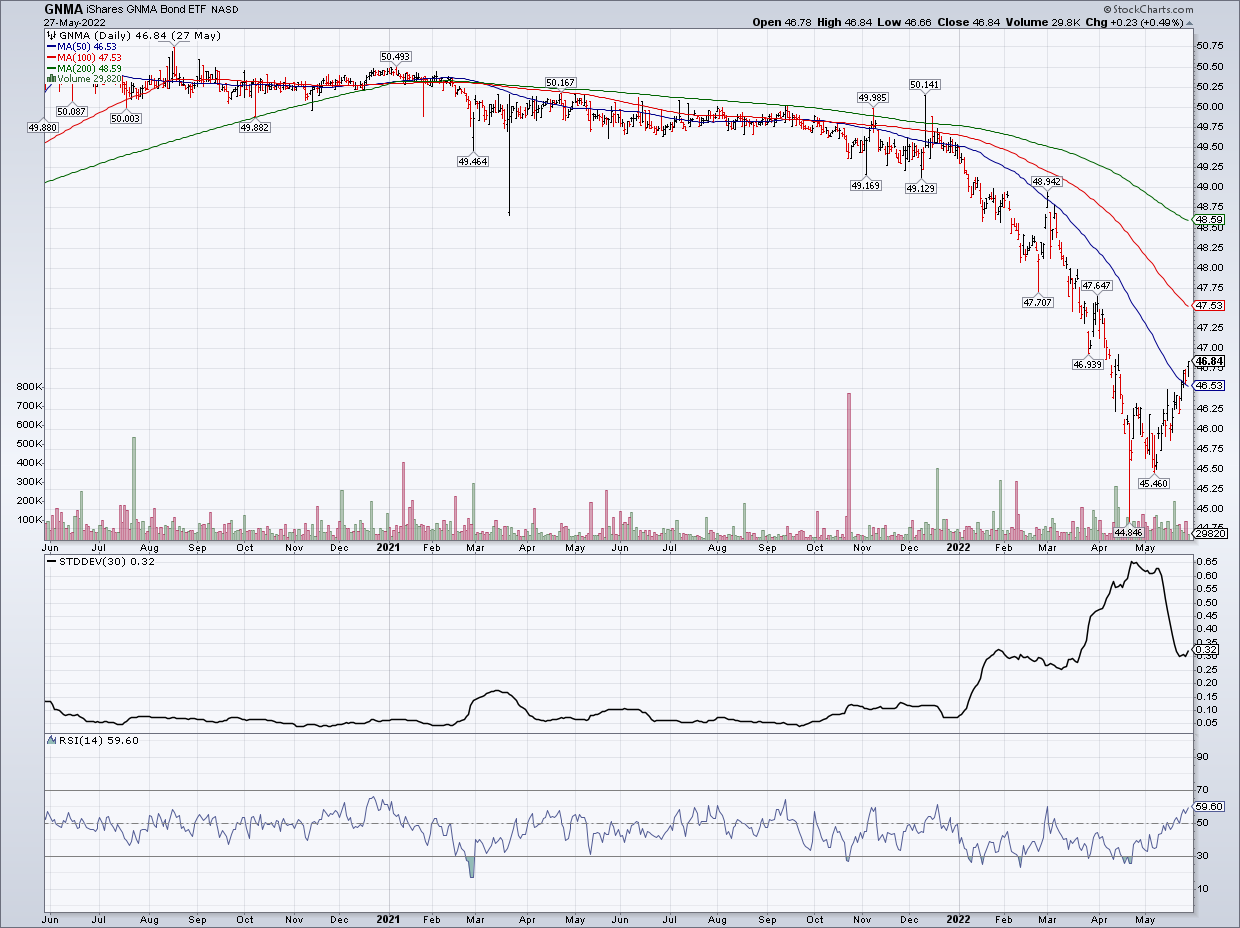
GNMA considered a "safe haven" again?
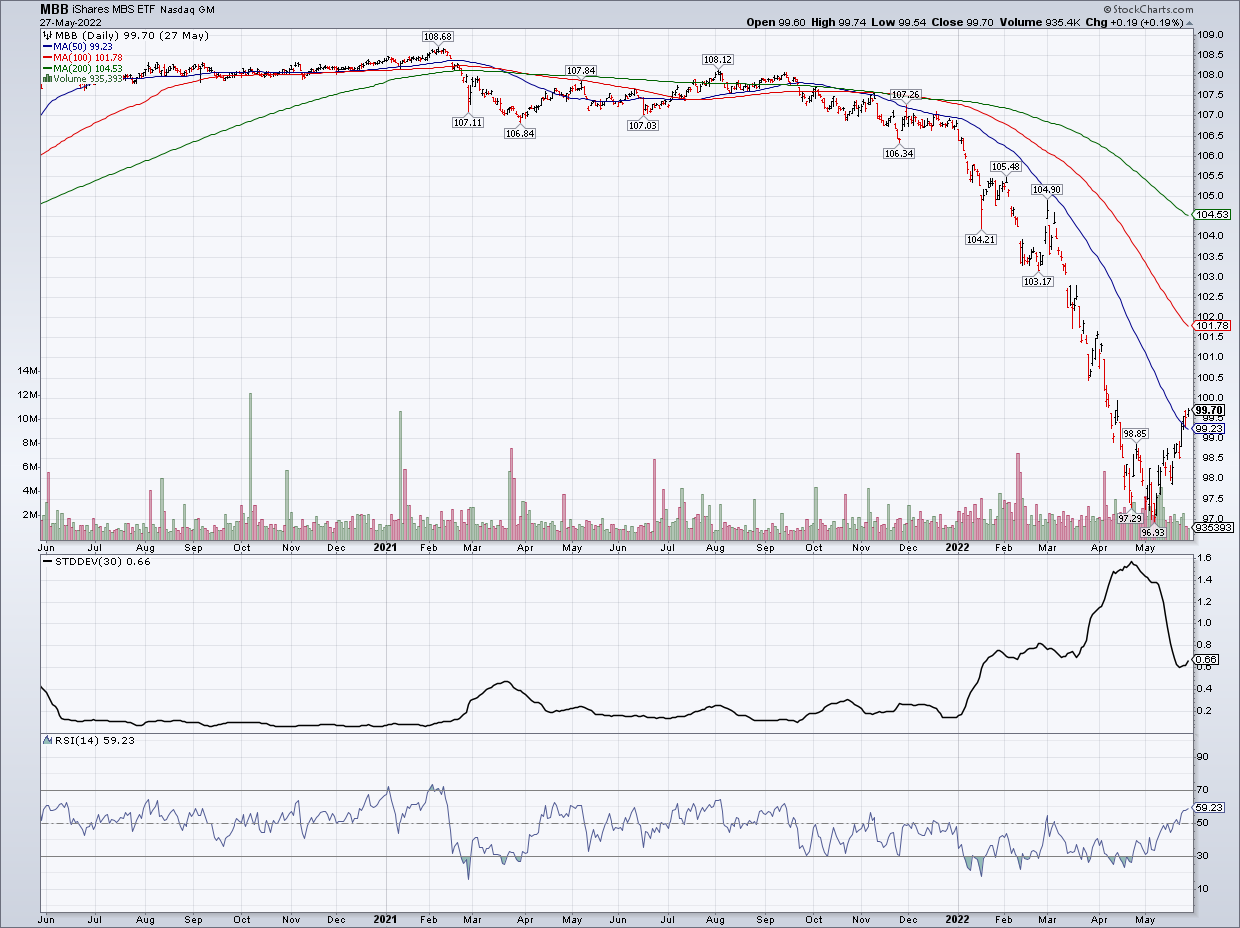
Mortgage-Backed Securities rally despite upcoming loss of Fed support
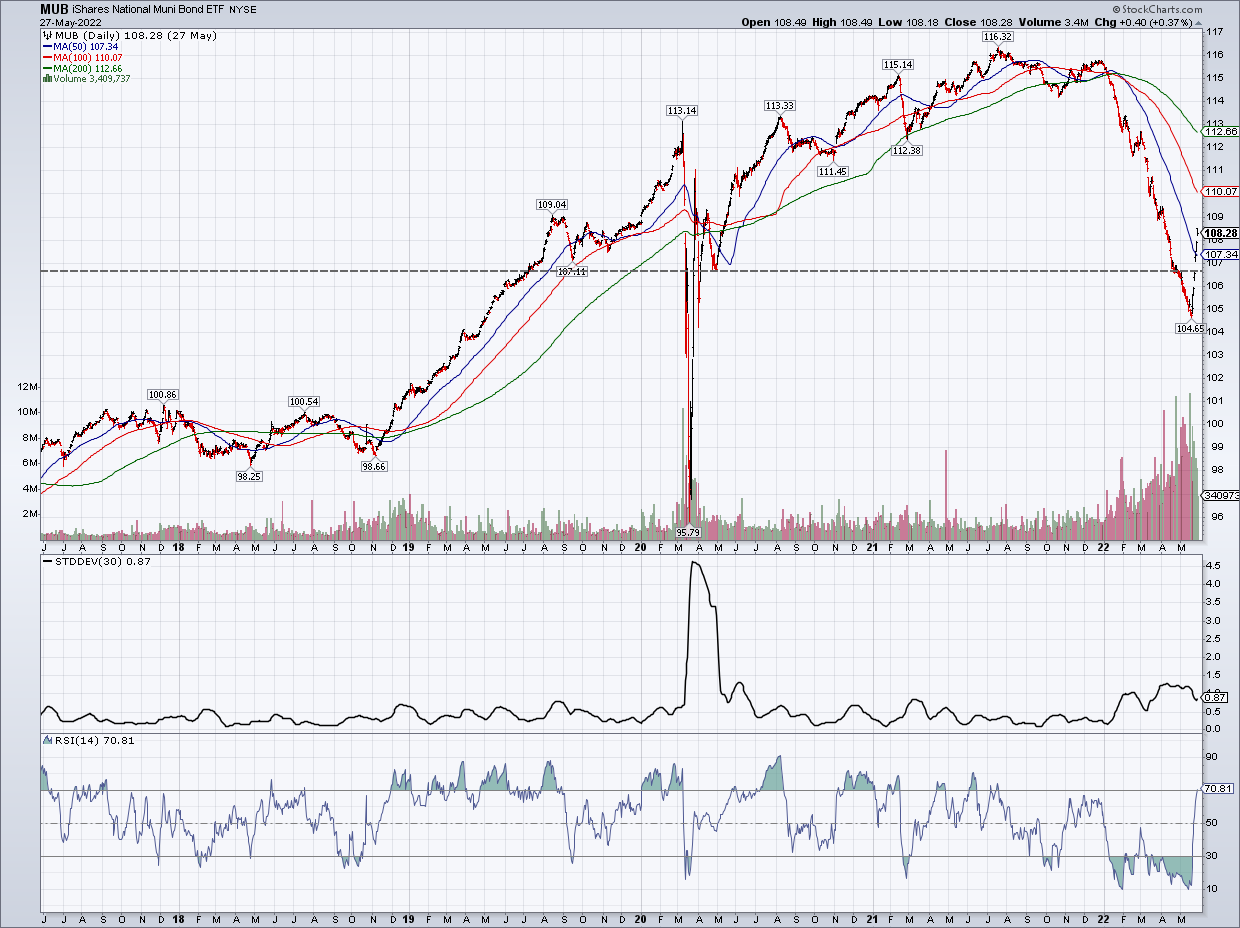
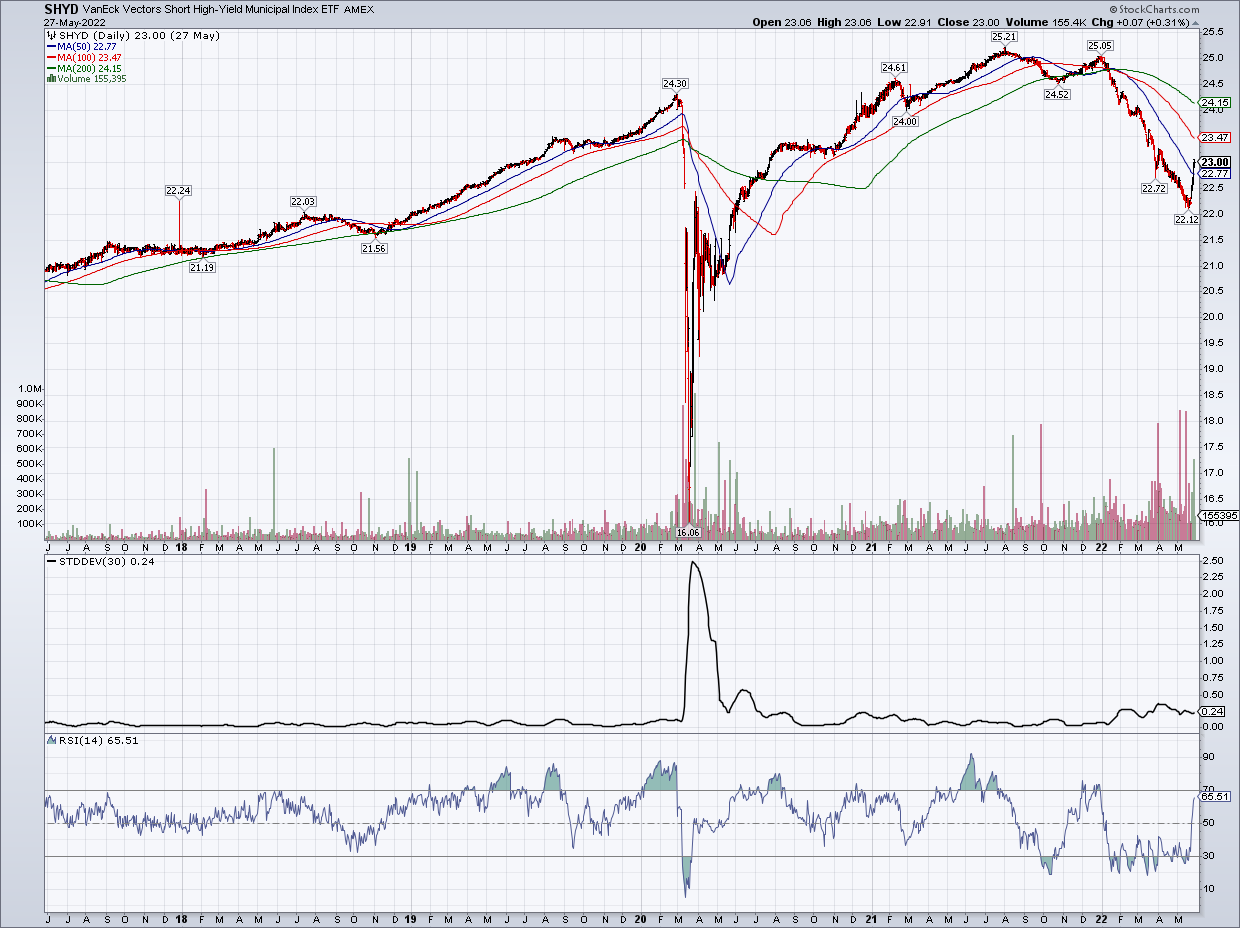
Municipal Bonds snap back
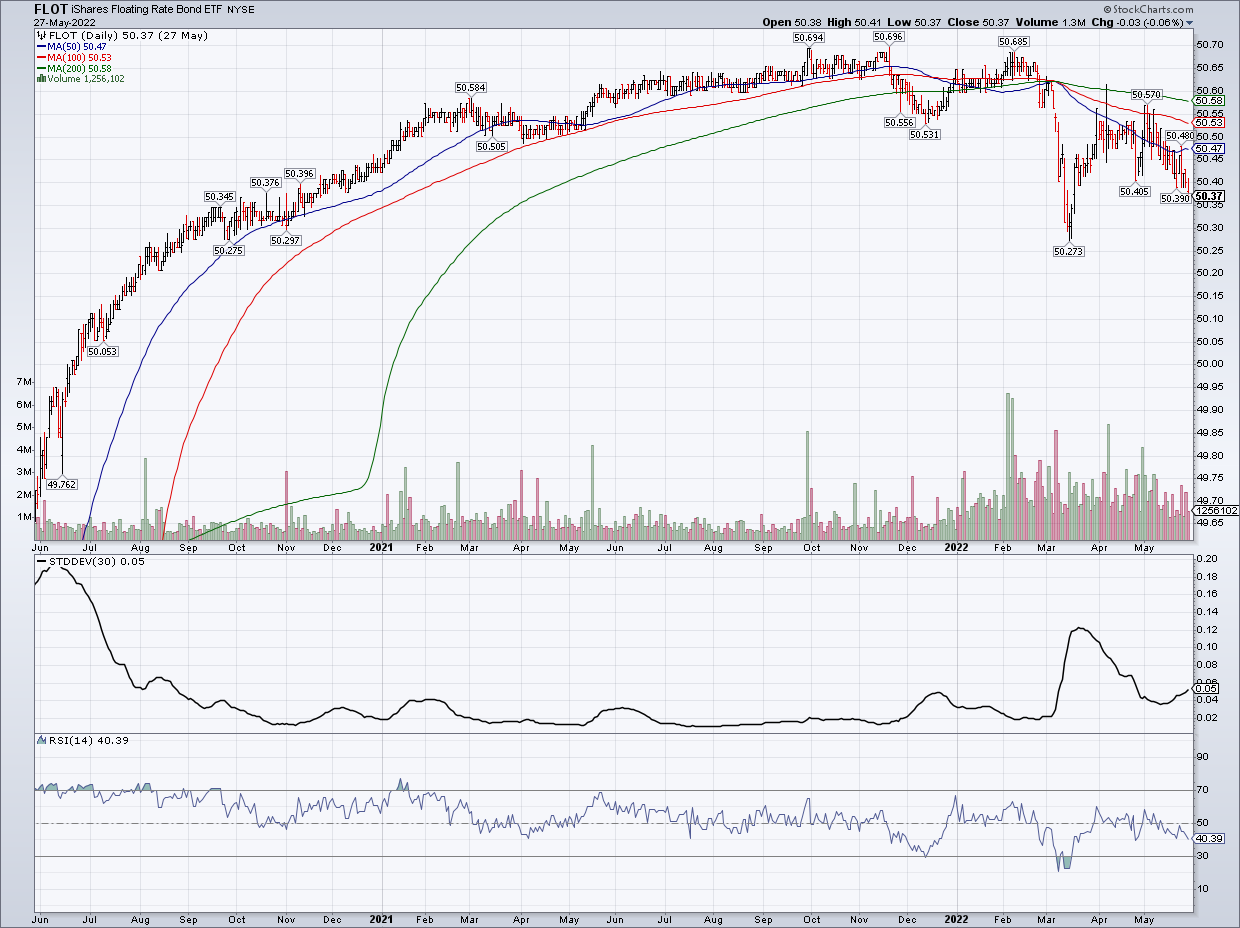
Floating Rate Bonds still struggling
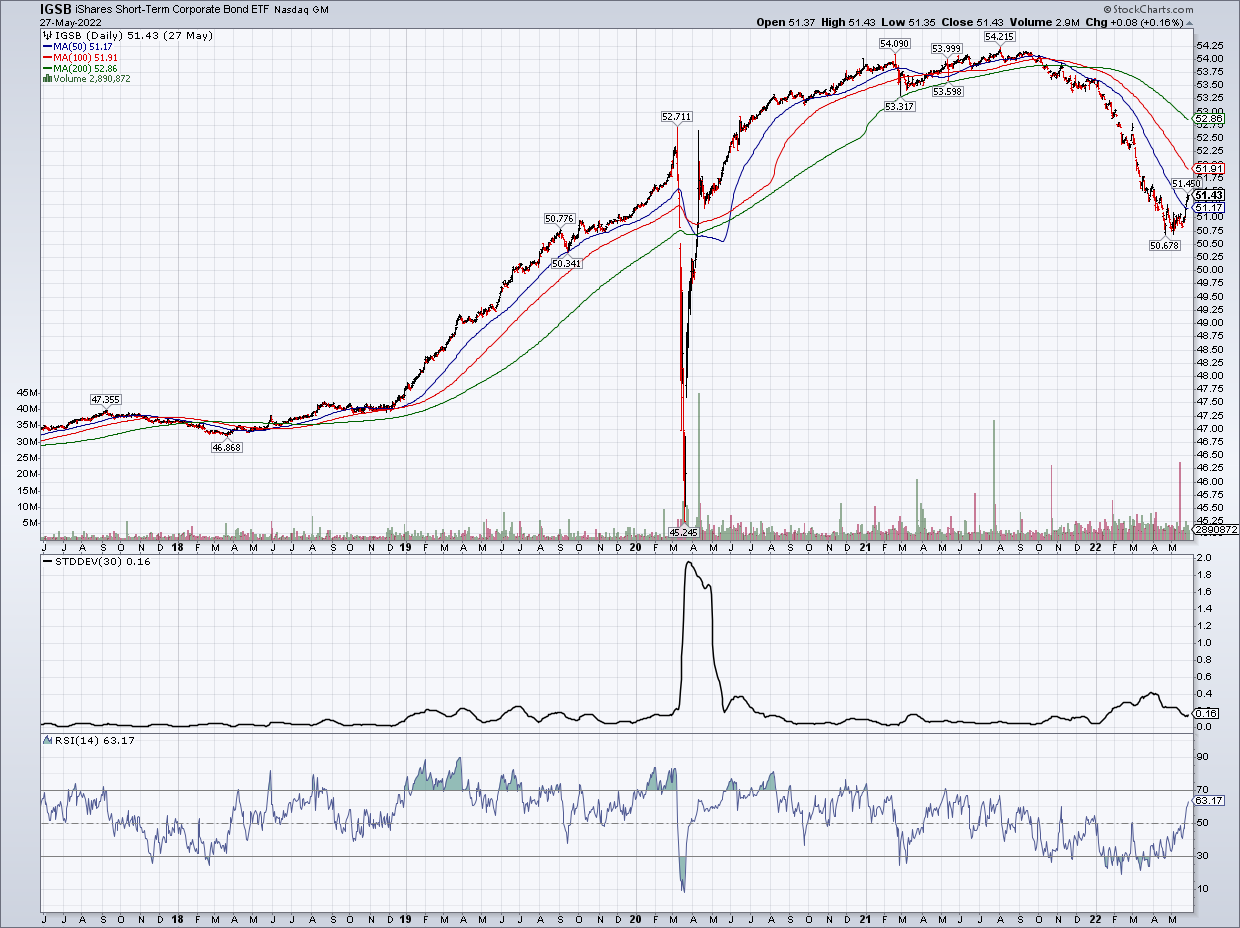
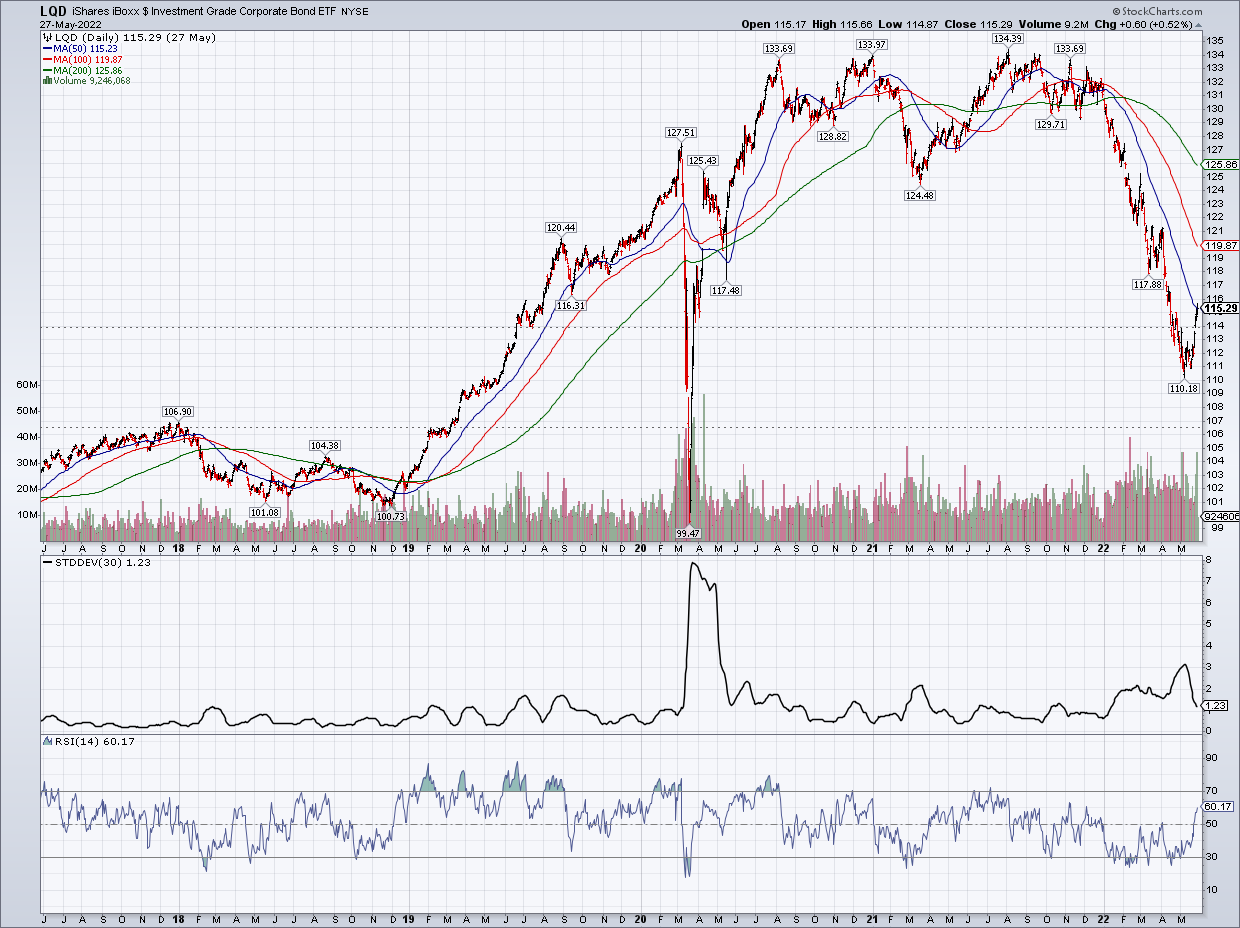
Corporate Bonds finding a bottom?
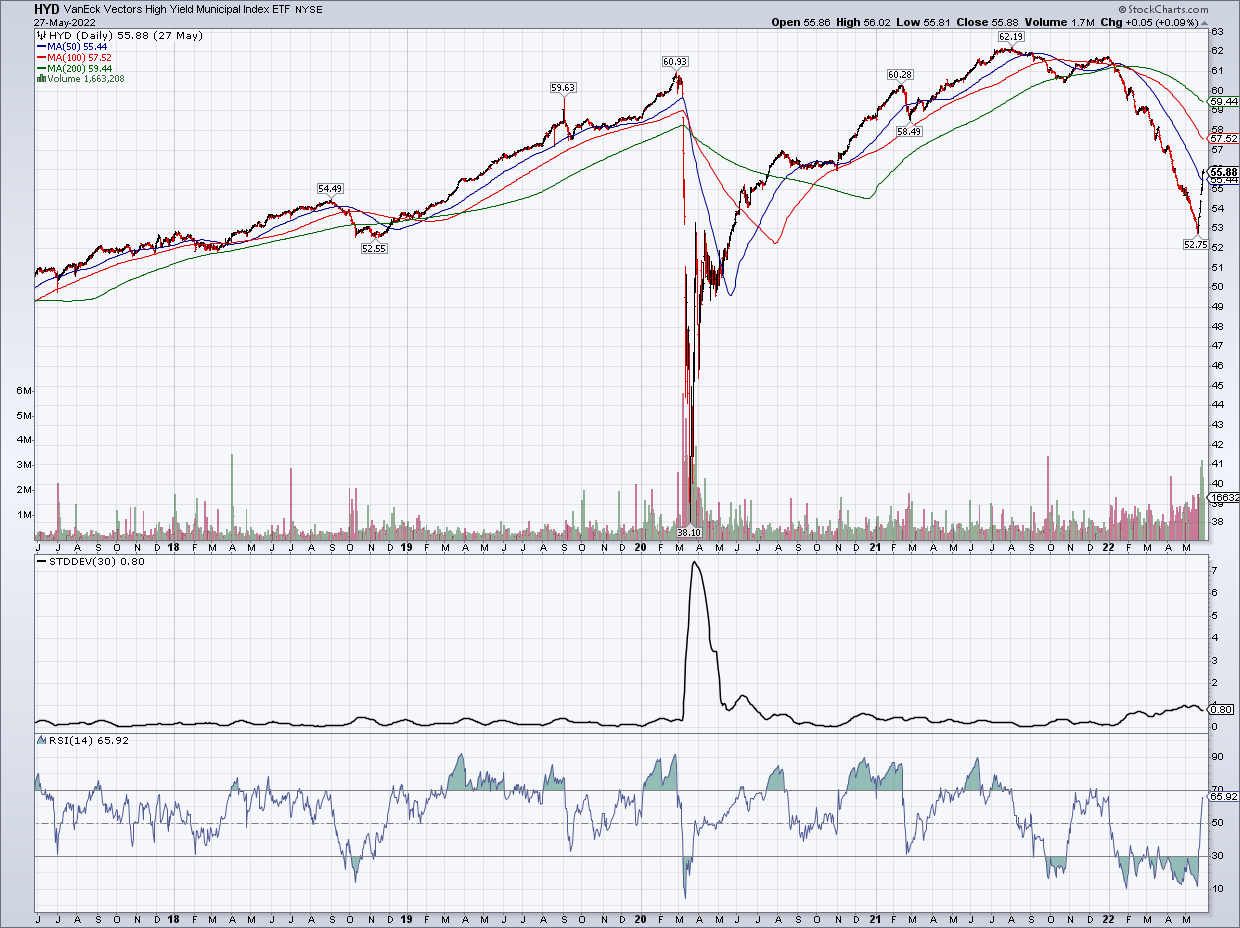
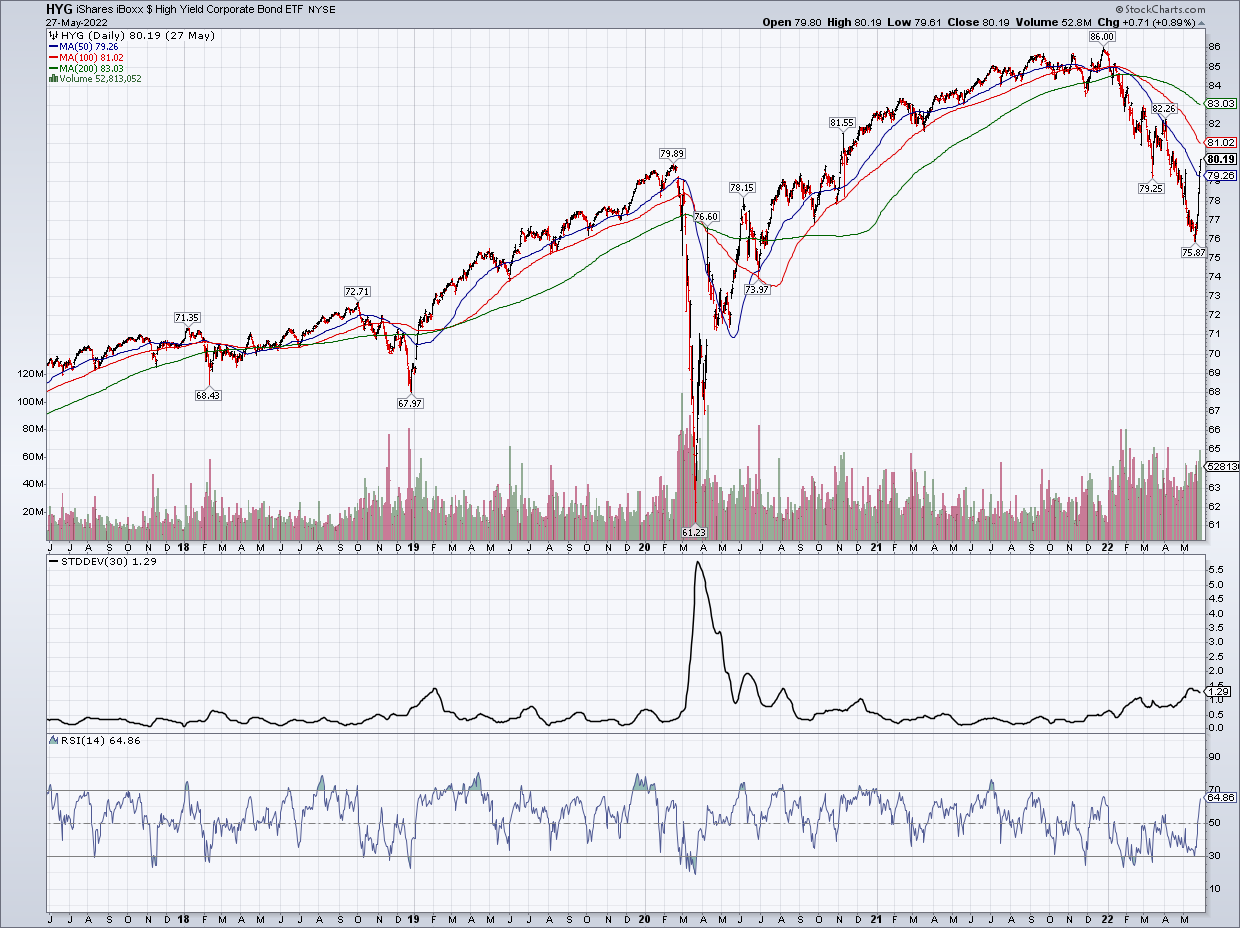
High yields see no risk?
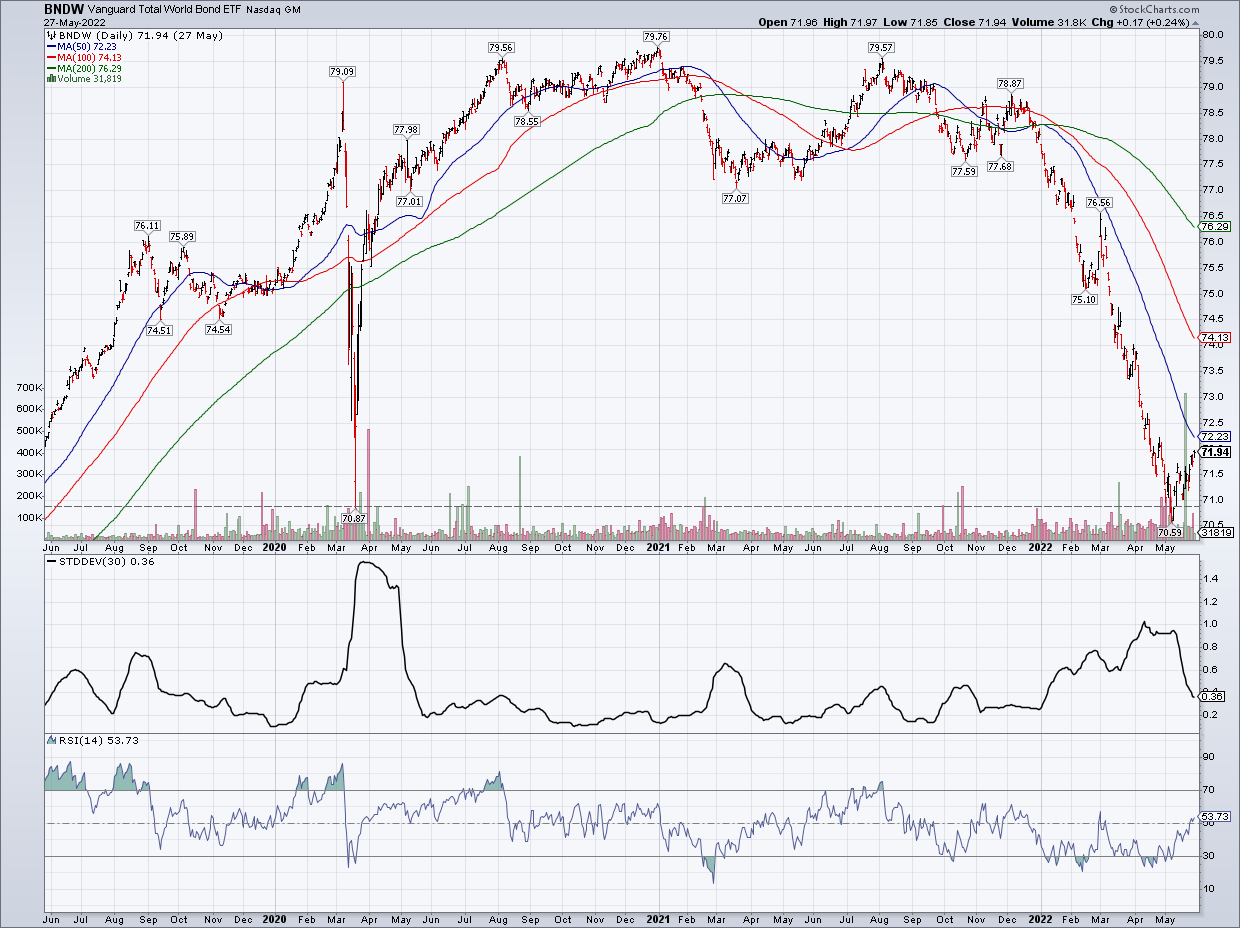
International bonds still risky
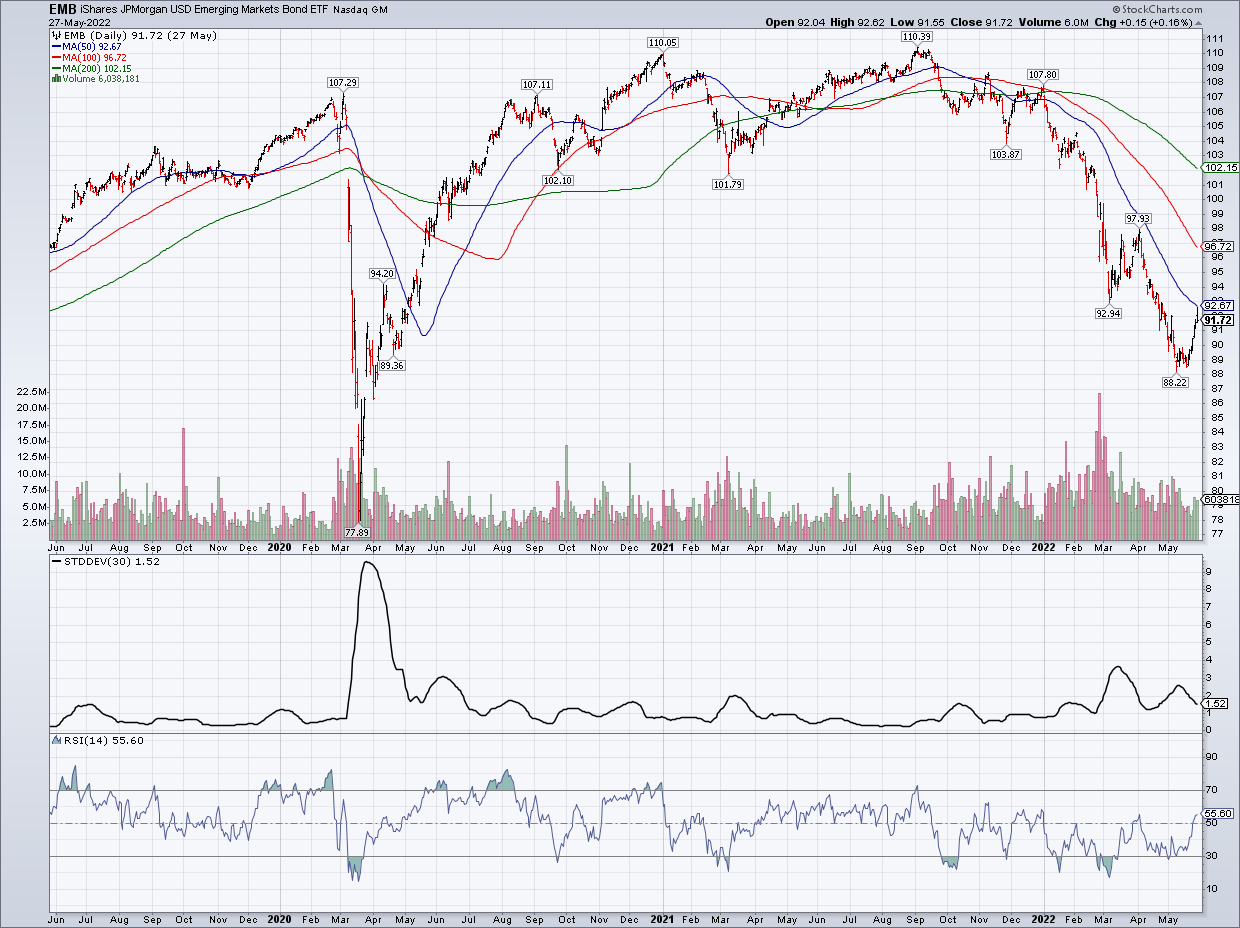
Bond market summary
In general, I saw Treasury bonds, starting with the 1-3 Month, 1-3 Year, GNMA, and MBS categories begin to rally on down days for the stock market a few weeks ago. This was followed by stabilization in the 7-10 year categories. To me this was the bond market saying the economy was running into some headwinds, but the Fed was going to get inflation under control.
The municipal bond market was the biggest concern. It was acting like we were going to see widespread defaults. I could argue we will see some defaults, which could hurt that market overall, but those defaults are a few years out. They snapped back strongly last week. This could have been the result of so many people selling simply because they were down so much for the year and people weren't used to seeing this. The snapback could signal the end of the heavy selling, nothing more.
Corporate bonds are also acting like there is no risk of recession and the selling was overdone. I personally think this is wrong and with these bonds barely back above their 50-day moving average, we could easily see the trend reverse lower once again.
International bonds still appear to be the riskiest bet out there. Despite all my criticisms of the Fed and concerns over our economy, the rest of the world is much worse off.
Here is the bond market table I update every morning.
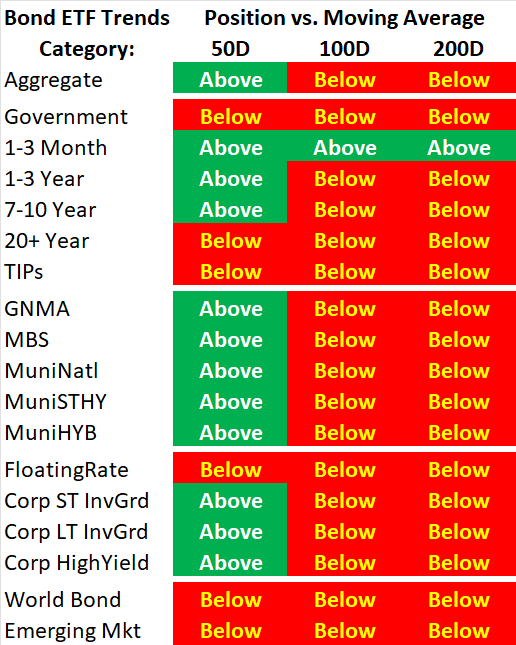
Risks are still high in bonds. Unless the recession risks are completely removed, I would venture to guess the rally in high yields will be short-lived. We did receive a buy signal in our high yield bond trend following system on Friday (meaning Tactical Bond, Cornerstone Bond, and Income Allocator are back invested in high yields). As always, when the model says to buy, we buy, regardless of our opinions. We typically get a reversing sell signal after a 1 1/2 to 2% decline in the investment funds. The current yield is 7%, so the return-risk is quite favorable for this trade. Time will tell how long it lasts.
Stocks not in the clear
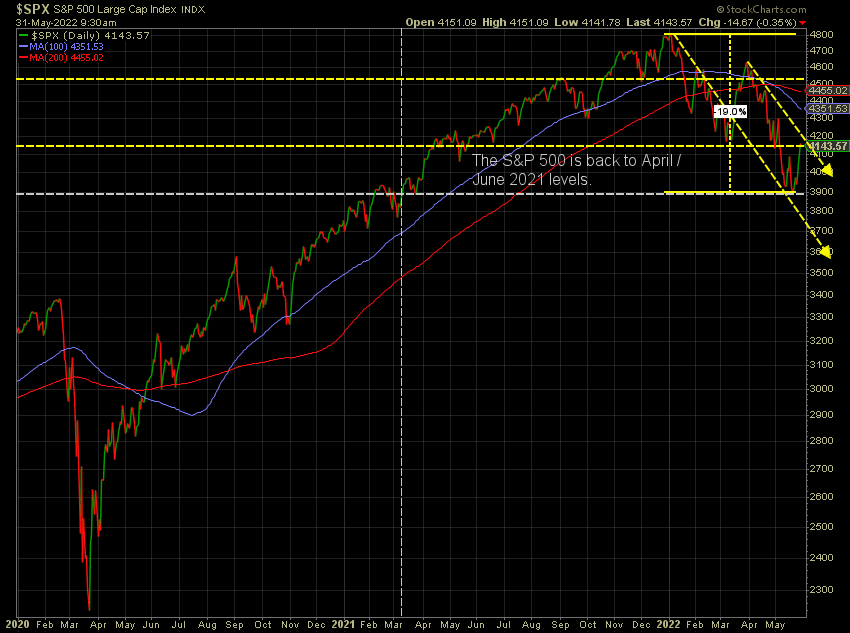
The rally in stocks, while impressive, did not really do much to end the downtrend. Stocks are simply back to the same level they were when the day before the last Fed meeting.
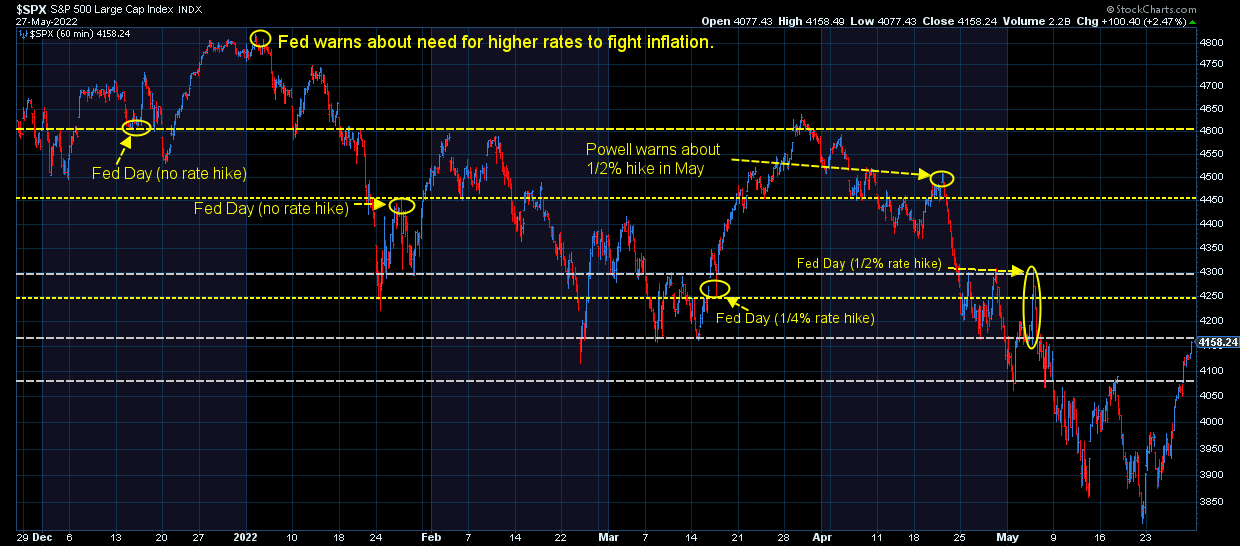
Here's an updated chart with SEM's market moves noted. The new high yield bond buy signal is at a much lower level than when we sold back in late January, but overall, the trend in stocks remains down.
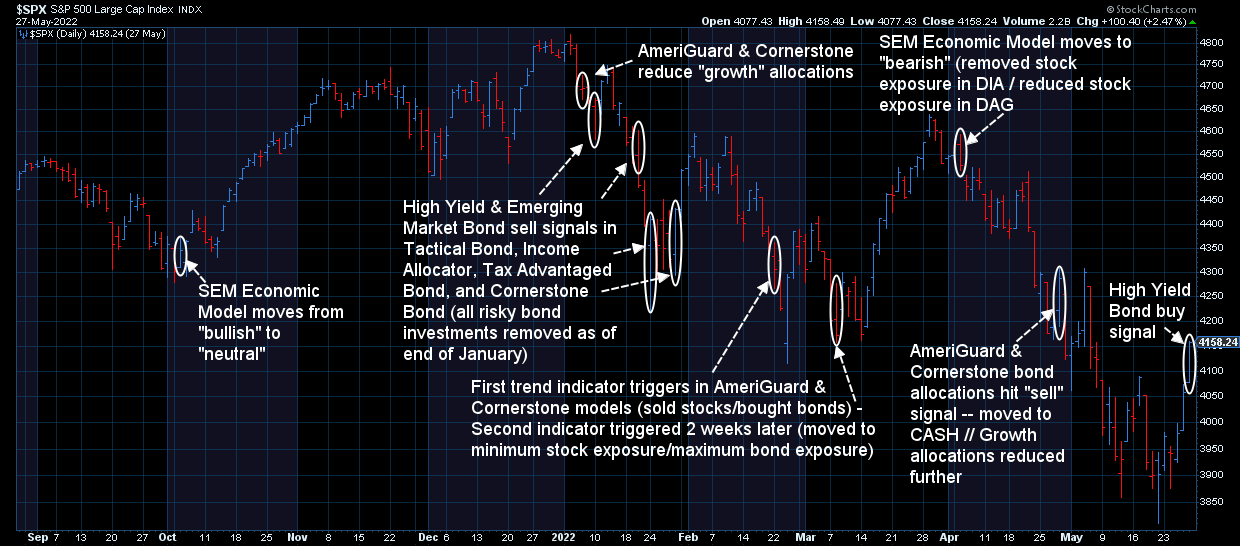
This chart better illustrates the downtrend channel stocks are fighting. From a longer-term perspective, if you are overweight stocks, you have only given up the returns from the past 12-13 months (which were excessively above average and probably not warranted based on the underlying fundamentals of the economy.)
Stocks are not "undervalued"
The argument during the sell-off was stocks were now undervalued. Ignoring recession risks, which are still high according to our models, based on current earnings estimates for the S&P 500, the "forward P/E" (price / expected future earnings) is over 18. The long-term average forward P/E is 15. The long-term average trailing (price / last year's earnings) is 18.
Estimated earnings have barely dropped with the S&P 500 expected to grow earnings 7% this year and 10% next year.
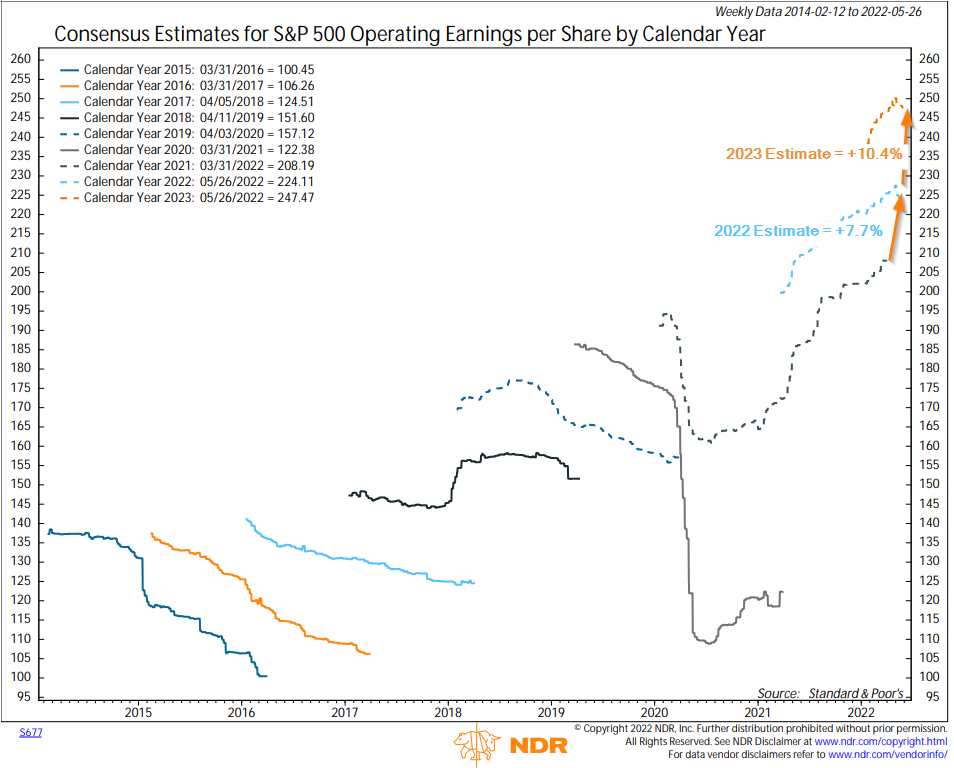
If you're buying stocks today with a time horizon of less than 10 years, you are buying "high" and hoping to sell higher. You also are banking on no recession and no slowdown in earnings. I'm not saying you're wrong, but you are betting in an environment that will be much more difficult than you've been accustomed the last 12 years.
You're fighting the Fed.
You're fighting inflation.
You're fighting declining profit margins.
You're fighting higher interest rates/borrowing costs.
You're fighting the economic cycle.
There are times investing is easy and times investing is not. Right now it's not so easy. We choose to sit out as much as possible and wait for easier times.
Weekly Talking Points
It depends on your time horizon......
- 3-6 months: the next direction is a coin flip. We certainly could see a huge rally that recovers half of the losses so far this year. That is actually normal following a large drop in prices. Conversely, given where we were in terms of valuations and returns that were double the long-term average the past 3 years, we could continue to see prices drop. Either way, the short-term direction could be volatile.
- 6-18 months: economic fundamentals and valuations mean the market is likely going to struggle, especially when you weigh the impacts of inflation. With so much stimulus from Congress that is working its way out of the system and with unprecedented manipulation of the financial markets by the Fed, nobody knows for sure what "fair value" is for stocks and interest rates. Going into COVID our economic model was indicating a slowdown, so unless the economy got BETTER during the last two years, the best case is we will have a slowing economy, which is rarely good for stock prices.
- 18-36 months: There will be some nice rallies that will suck people into believing the worst is over. The only way this will be true is if we've gotten to the other side of the "unwind" of stimulus. A typical bear market last 18-24 months with the market dropping 35-50%. This means over the next 18-36 months we will see the "bottom". Most of the time, when we are at or near the bottom few people will WANT to buy stocks. In all past bear markets we've been met with skepticism and anger when advisors and clients see us jumping back into riskier assets. As I always say, when it feels good to buy you probably are near the top. When it feels awful, you're probably near the bottom.
- 3-7 years: This will all depend on how the STRUCTURAL issues are resolved. We entered COVID with too much debt and not enough investment. We had a massive trade imbalance. We had a demographic imbalance (too many looming retirements and not enough workers or QUALITY jobs to replace them.) During recessions we often see a restructuring of our economy. If we have leadership willing to make the difficult choices, we could see a generational low in the markets that leads to very strong economic (and market growth) for a long, long time. If we continue to use short-term solutions, we will continue to see fits and starts in both economic growth and the markets.
- 7-15 years: We could see 2-4 bull markets over this time frame. Based on market history, the market SHOULD be higher 7-15 years from now, so if your time horizon is this long the only thing you need to do with that portion of your portfolio is to make sure you are in a well-diversified portfolio that aligns with your objectives and overall risk tolerance. Remember, the industries/companies that led us into the last expansion are rarely the ones which lead during the next expansion.
- 15+ years: Based on 150 years of stock market history, stocks should be higher than they are now 15 or more years from now. Keep pouring as much money as possible into a well-diversified portfolio. Max out all available retirement plans. Avoid looking at your account values – you have a long time before you actually need the money. Stick to your plan.
I'd encourage you to read the full article for a deeper discussion.
 Jeff Hybiak, CFA