
With powerful computers always in our hands, and any and all information sources available on any of the screens at our disposal, it's easy to overreact to every piece of information. Whether it is politics, the weather, the latest violence in your region, the economy, or the stock market, we see constant mood swings based on the latest piece of information.
I discussed the bigger picture last week in detail, which you can check out here:

This will also be the focus of our Quarterly Newsletter which should post later this week.
As we start the last quarter of the year, here are some big picture random musings:
- Stocks were overvalued in 2021, they returned to slightly overvalued in 2022, and with the big rally in 2023 are once again tremendously overvalued.
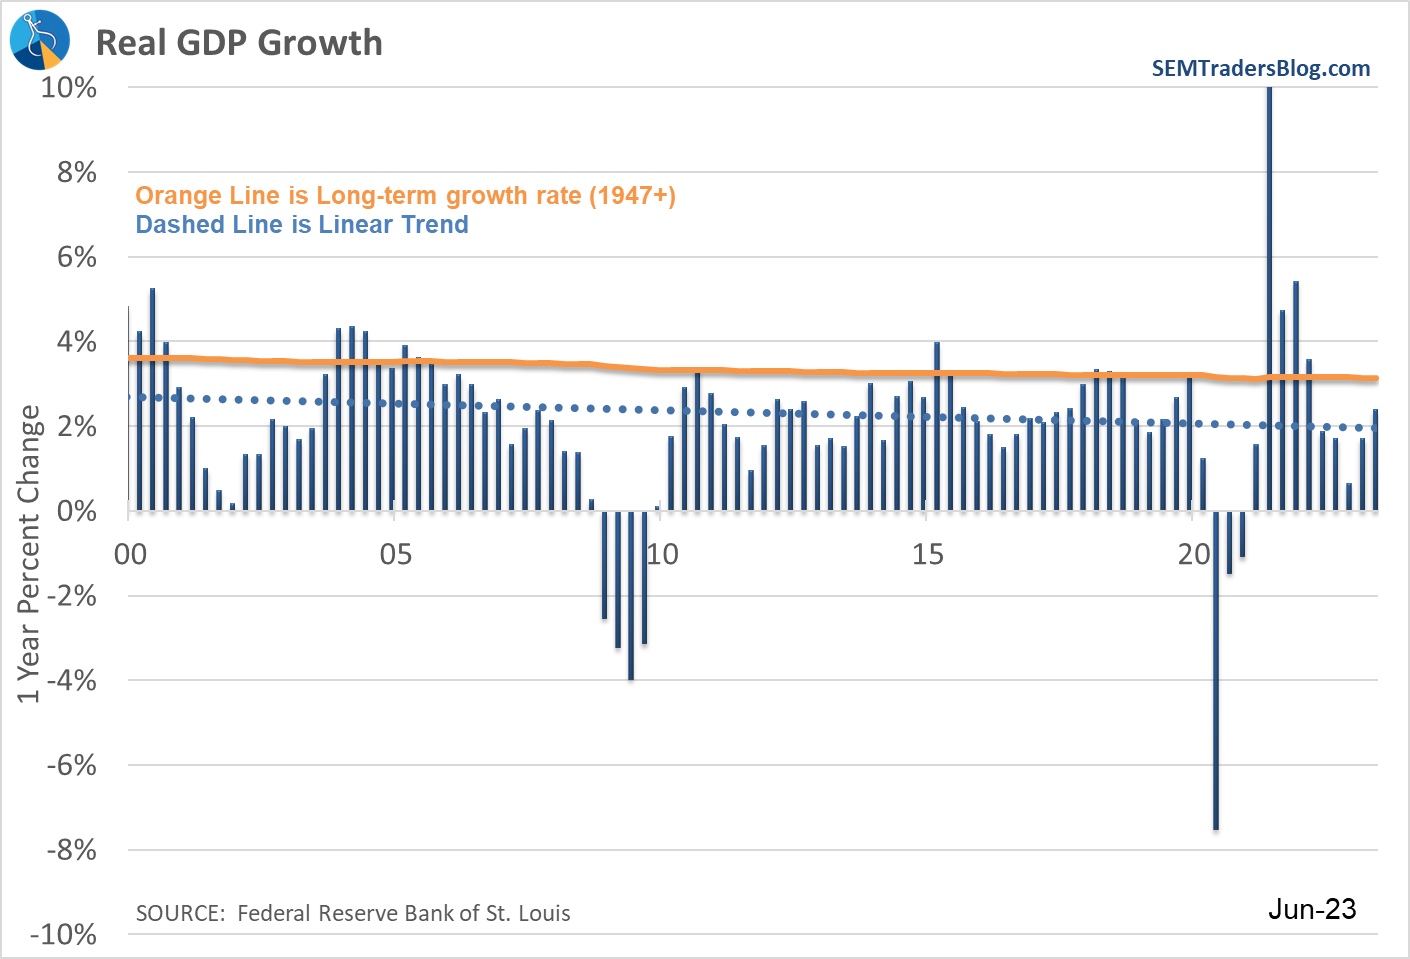
- The economy is slowing down rapidly and even with all of the stimulus dumped into it, barely exceeded the long-term average growth rate.
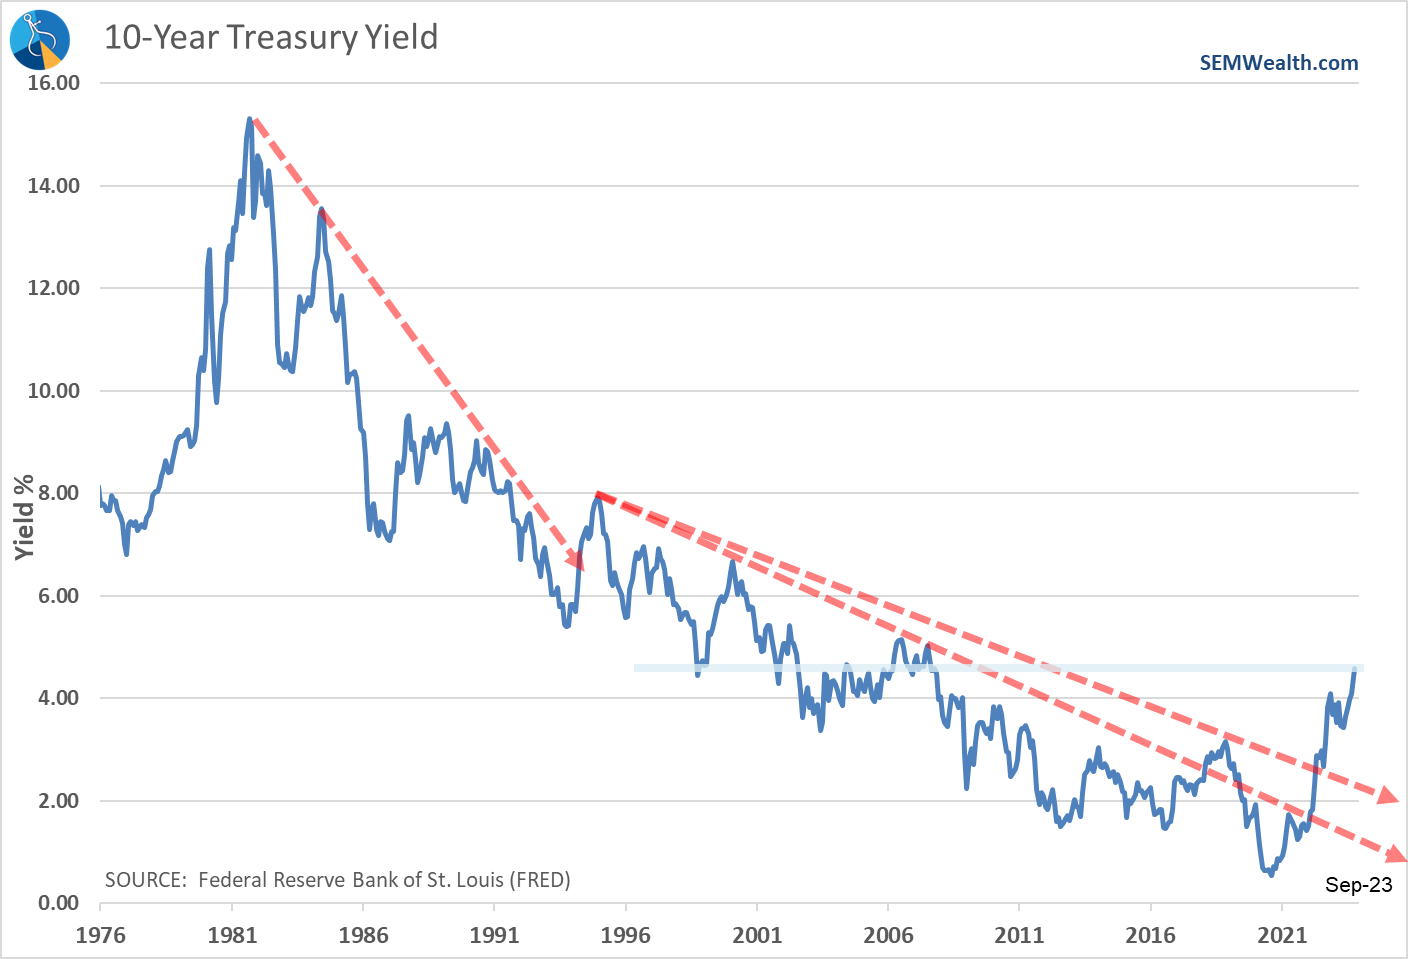
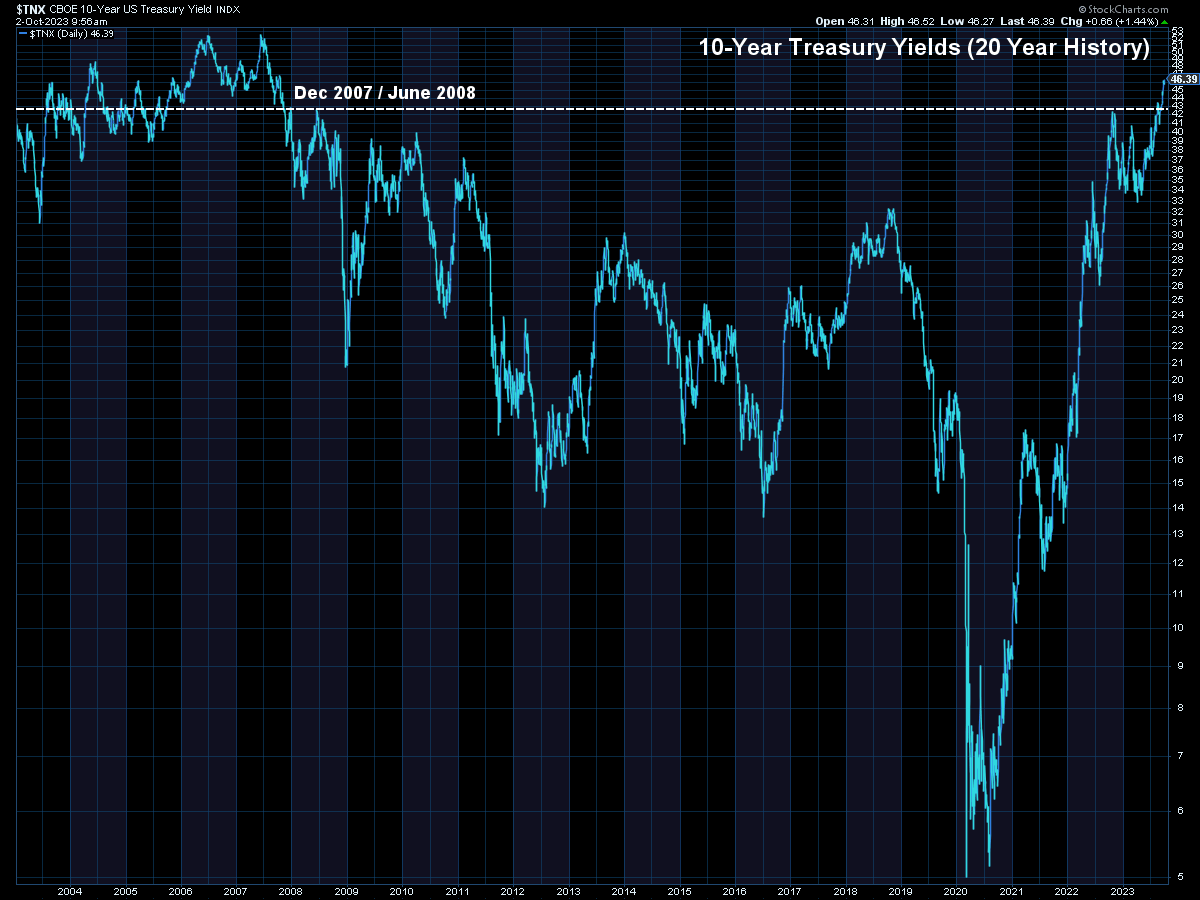
- With interest rates back to the highest levels since 2007, things are going to break; companies are going to default; growth is going to slow; (and big opportunities are going to be created)
- Wall Street analysts expect BETTER than average growth next year, which doesn't match-up to the economic data.
- 20% of Republican leaning voters love former President Trump; 20% of Democratic leaning voters love President Biden; That means 60% of voters are not happy with the choices in 2024 — something has to give on both sides. When it does it will short-term not be positive for the market or economy.
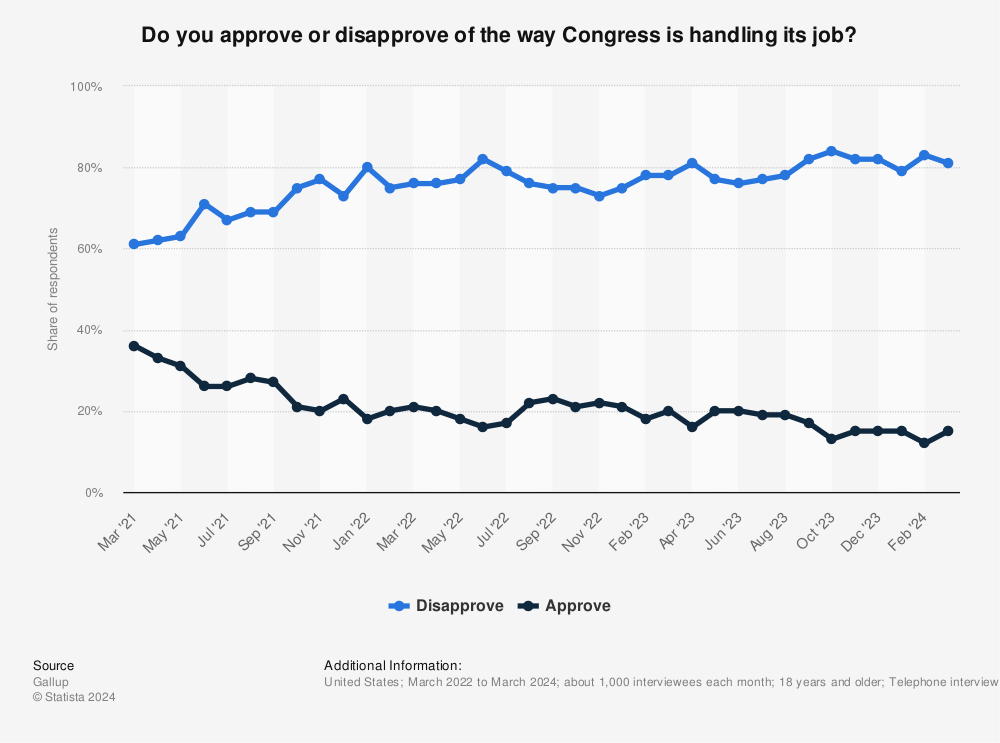
- With the professional can-kickers once again postponing the budget, it is a reminder that Americans highly disprove of the job Congress is doing (yet we continue to vote for the same types of people over and over again.)
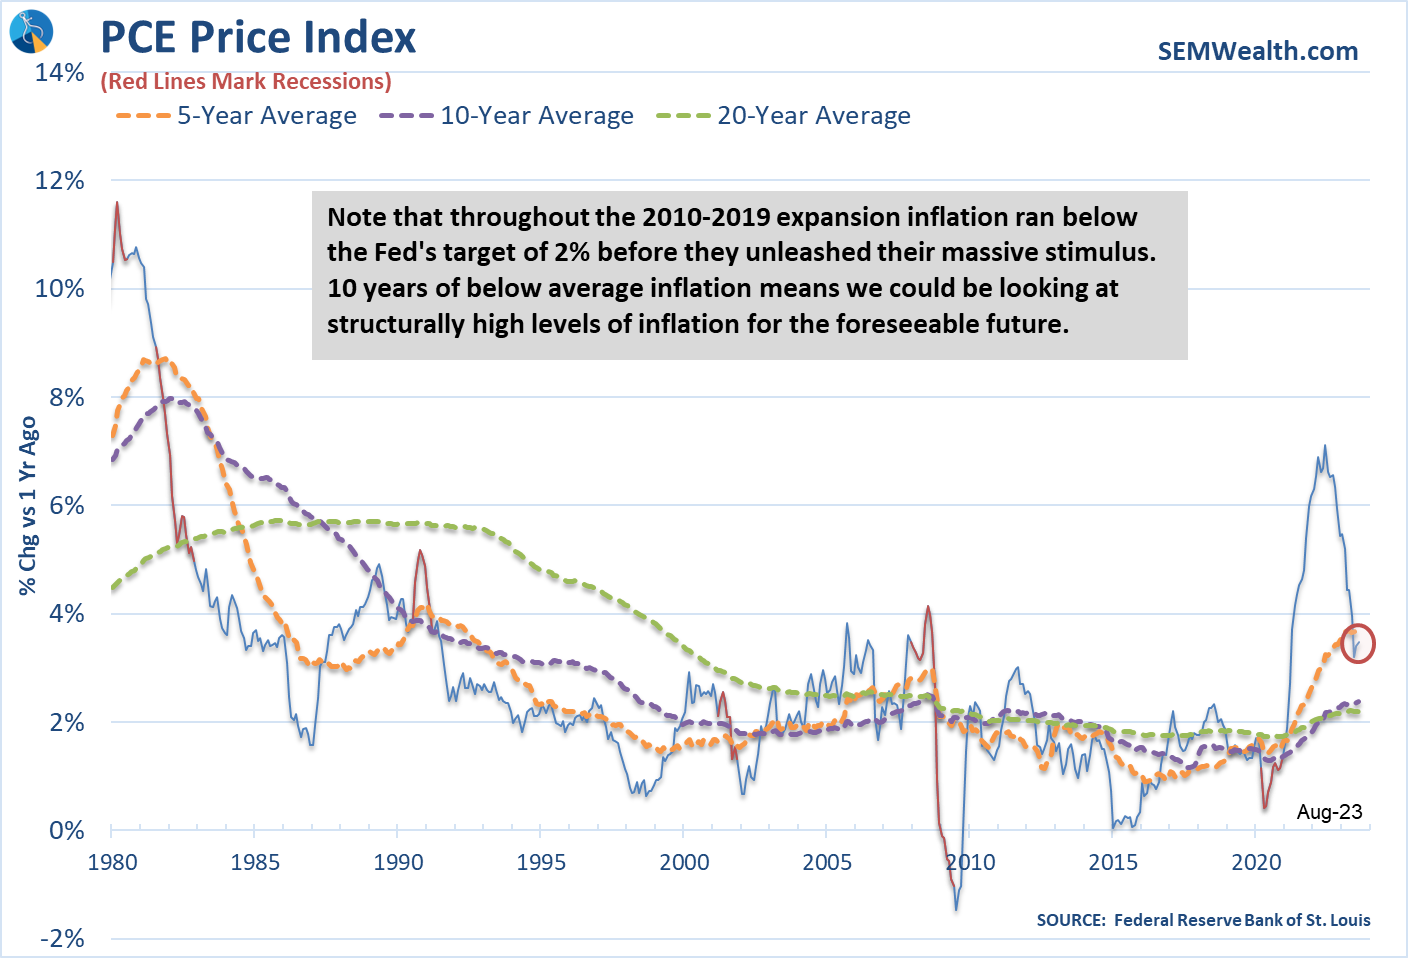
- Inflation is likely to be higher than the Fed's 2% "target", which means interest rates will be higher for longer than many people are expecting.
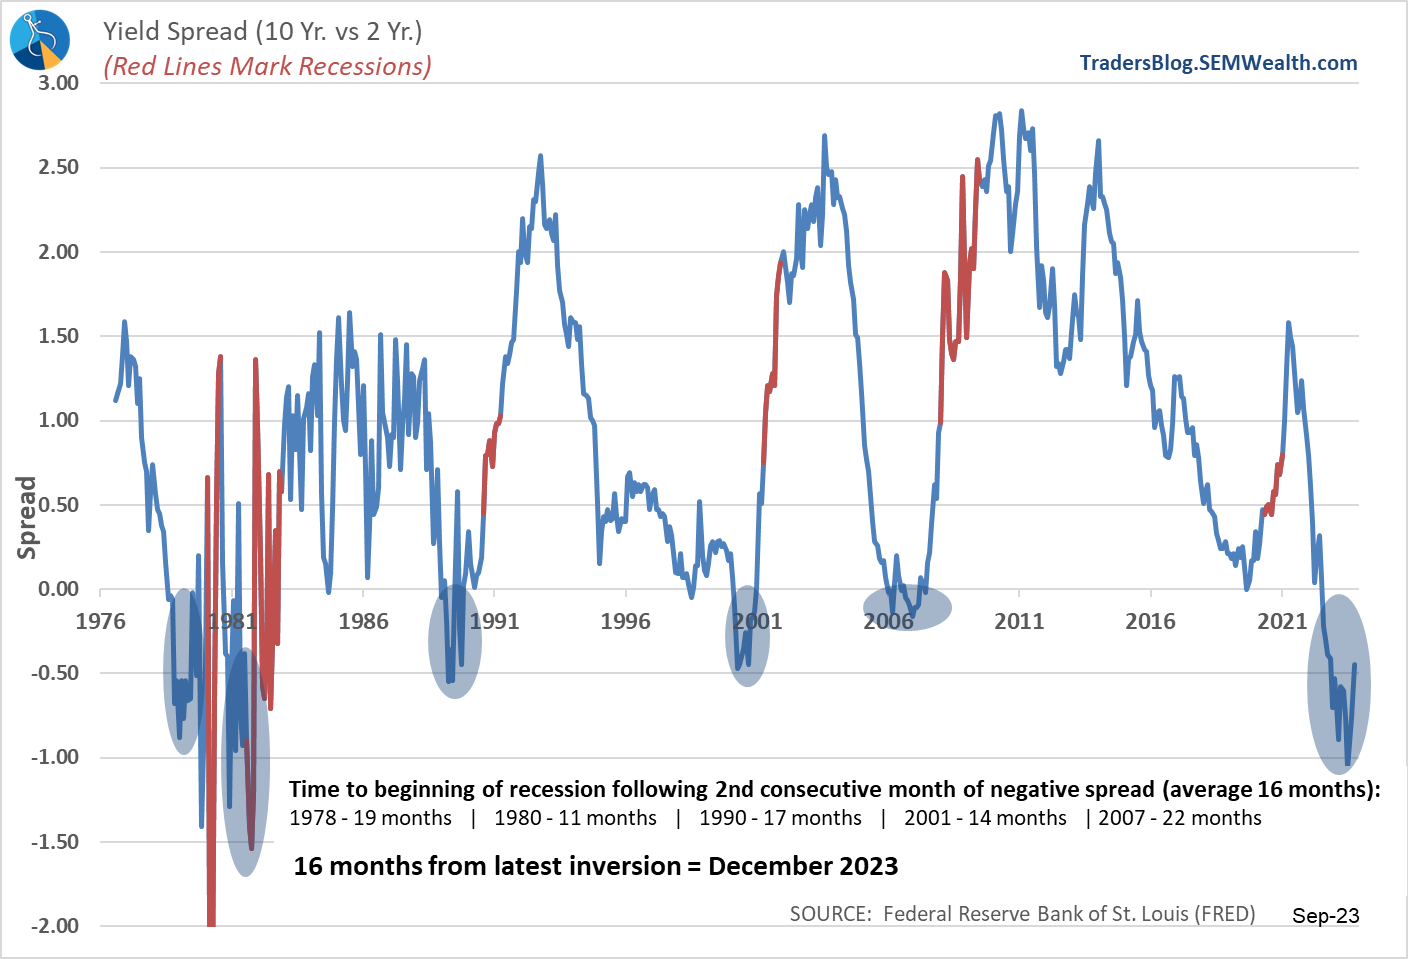
- Most importantly – the Treasury Yield Spread is quite reliable in predicting a recession. The data says there is an average lag of 16 months, which would put the recession start around the end of the year. Also note, the spread "normalizes" BEFORE the recession (red lines on our charts)
Market Charts
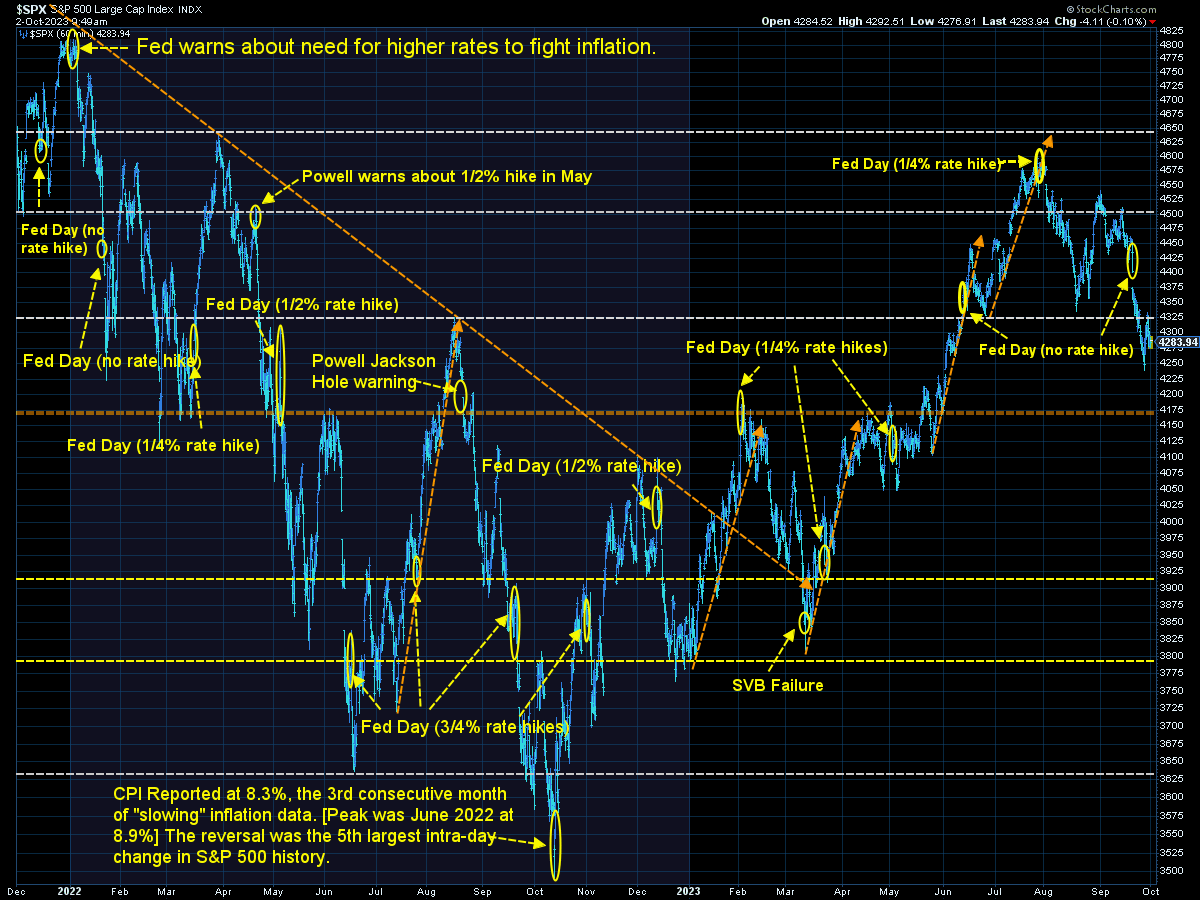
The S&P 500 is now down 6% since the end of July. It failed to hold onto the 'support' area around 4325. This pattern still looks like a topping "head & shoulders" pattern, which now that the shoulders have clearly broken would make a drop down to 4000-4100 quite likely (another 4-7% or 10-13% from the peak). That's not terrible and should be expected in ANY market (10% drops happen on average once a year). From there it will be a question of the underlying fundamentals of the economy and whether it is strong enough to justify a move higher in prices.
The 200-day moving average is down around 4200, which could also serve as an area of "support" where more buyers could step in.
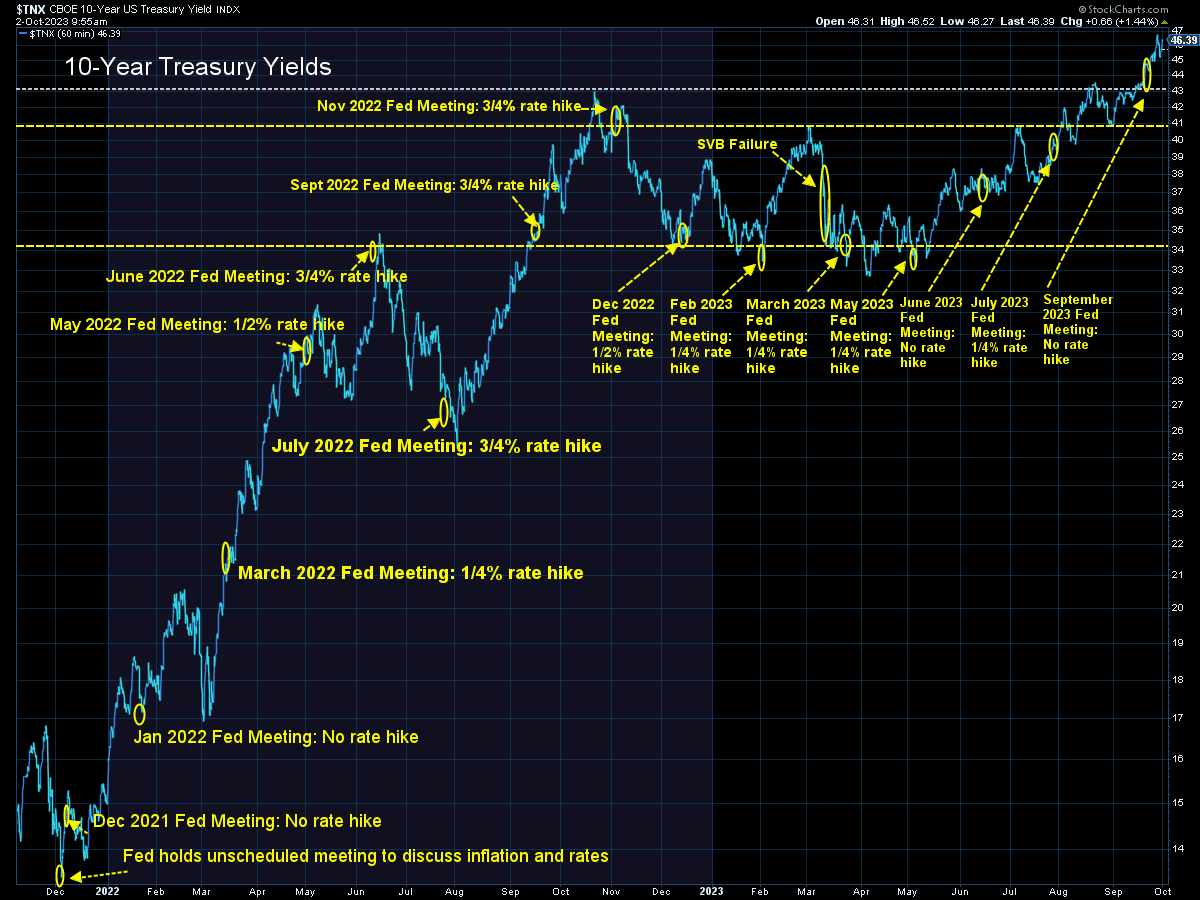
The 10-year Treasury Yield chart is breathtaking. The bond market is clearly not happy with the Fed's latest policy statement.
And to the idiots in Congress (on both sides), in 2007 total debt was $9 Trillion. When Trump took over it was at $19 Trillion (an increase of $10 Trillion). By the time Biden took over it was at $27 Trillion (an increase of $8 Trillion). We currently have $31 Trillion of debt ($4 Trillion more in 3 years). In other words, since the last time interest rates were this high we've increased our debt by $22 Trillion. It took us from 1776 until 2019 to add $22 Trillion of debt, but somehow you used record low interest rates to add 243 years worth of debt in 15 years.
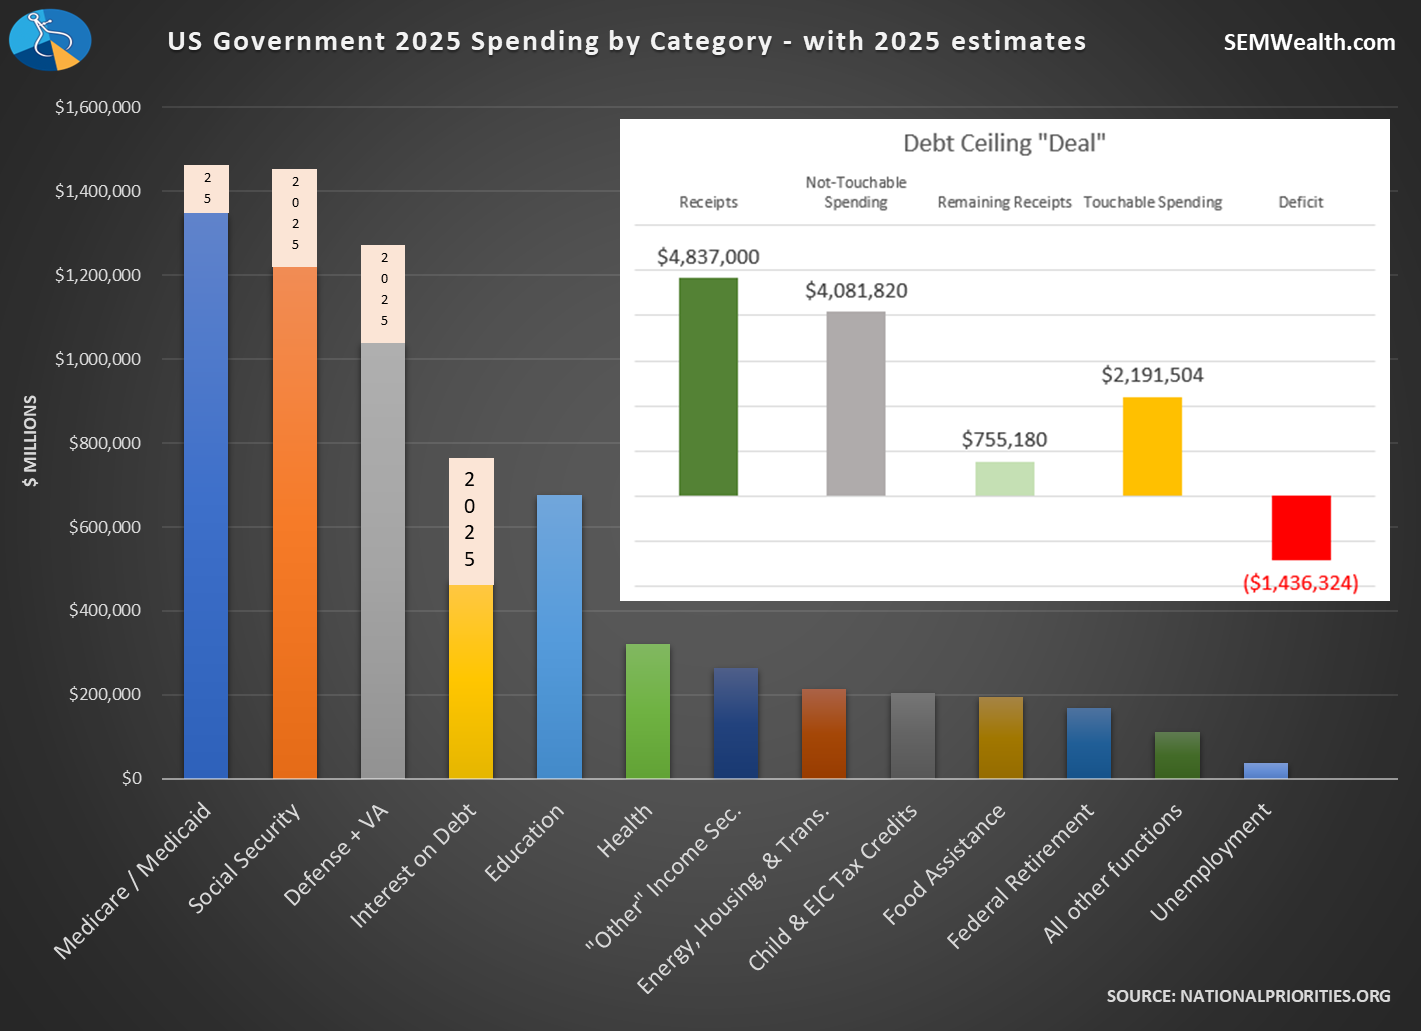
Don't think this will be a problem? Based on current budget projections by 2025 Interest on our debt will be the 4th largest spending category – jumping 66% in just two years!
While the wrangle over "wasteful" spending, the only categories that matter are "untouchable" – Medicare/Medicaid, Social Security, Defense/VA Benefits. Education and Health could certainly be reformed (but nobody has the guts to take on those lobbies either). So instead they threaten to shut down the government over relatively meaningless spending.
I really wish our politicians and voters could understand the concept of the only way we can grow the economy (and why our growth rate has been declining). It will continue to do so until we change our ways.
@finance_nerd There's a simple equation that neither Democrats or Republicans understand when it comes to economic growth and spending. Find out more from Jeff... you might not like what he has to say about Social Security and Medicare. #democrats #republicans #economicgrowth #economy #deficit #governmentshutdown #government #GDP #socialsecurity #medicare #wasteful #productivity #workforce ♬ original sound - Finance Nerd
SEM Model Positioning (New Update)
SEM deploys 3 distinct approaches – Tactical, Dynamic, and Strategic. These systems have been described as 'daily, monthly, quarterly' given how often they may make adjustments. Here is where they each stand.
Tactical (daily): The High Yield Bond system which bought the beginning of April issued all 3 sell signals last week, so as of 9/28/2023 we are completely "risk-off". The money market accounts we are using have a 5%+ annualized yield, so we are happy to sit there as long as possible considering high yield (junk) bonds are only yielding 6 1/2 - 7% currently.
Dynamic (monthly): As we've been since April 2022, our economic model remains "bearish". This doesn't mean we are predicting a recession, but rather a slowdown which means a difficult environment for corporate earnings. Other than the technology and discretionary sector this has been the case.
Strategic (quarterly)*: The core rotation is adjusted quarterly. On August 17 it rotated out of mid-cap growth and into small cap value. It also sold some large cap value to buy some large cap blend and growth. The large cap purchases were in actively managed funds with more diversification than the S&P 500 (banking on the market broadening out beyond the top 5-10 stocks.)
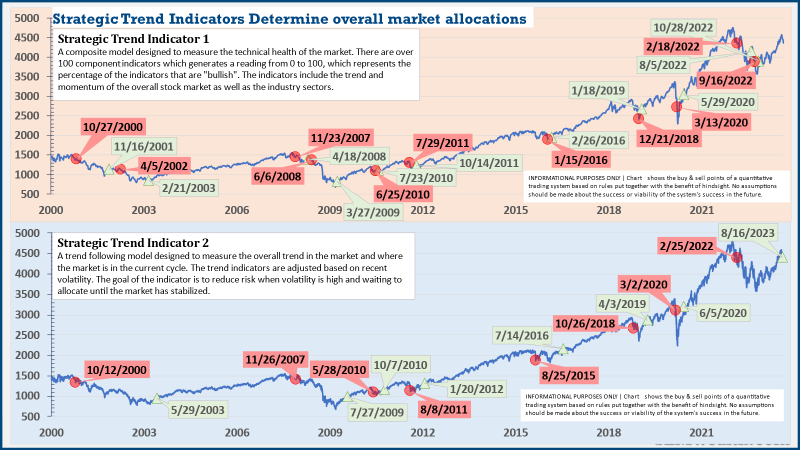
The * in quarterly is for the trend models. These models are watched daily but they trade infrequently based on readings of where each believe we are in the cycle. The second indicator triggered on August 16, brining the strategic models to a fully invested position. We are NOT locked into these for the next quarter. The 'sell-point' for this system is down around 3-4% from here.
This is the beauty of SEM's truly diversified approach. You get 3 distinct investment management styles inside one portfolio. We can customize models to match nearly any objective, risk level, and investment personality.
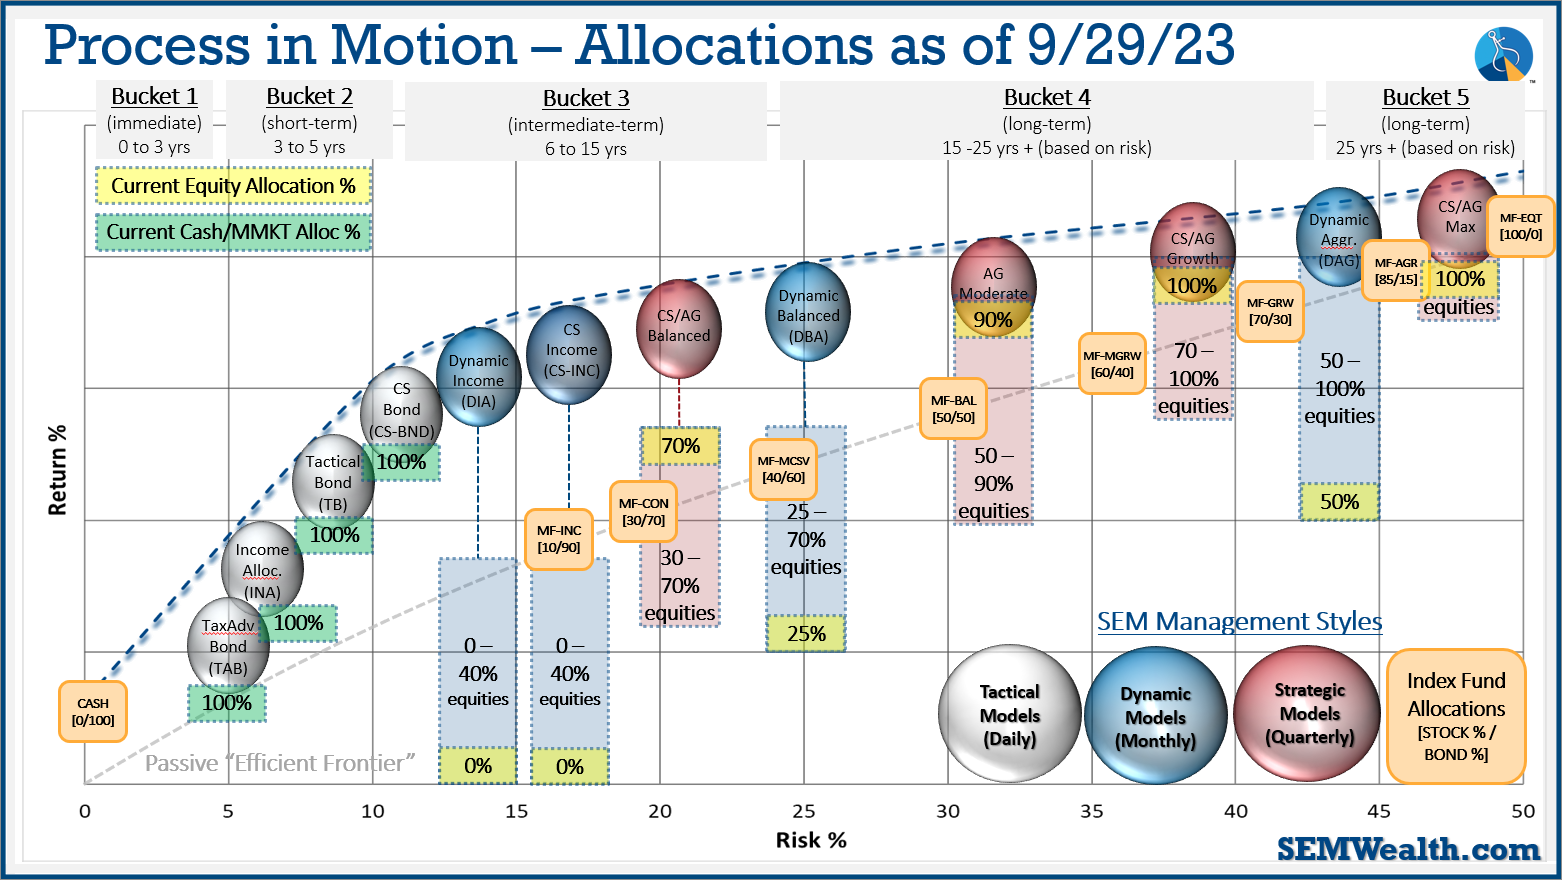
Our "bucket" approach allows for different parts of the portfolio to be positioned differently based on where we are in the market cycle. Whenever we are at a crossroads moment it is especially risky. This requires a disciplined approach which is what SEM brings. There will be much easier times to invest. Our goal is to get there with as much capital in tact to take advantage of that opportunity.


