A lot of data hit last week on both the earnings and the economic front. We have even more data coming this week along with a Fed meeting. Interest rates on 10-year Treasuries crossed 5%. The S&P 500 is now down 10% from its most recent high. Add to that the escalating war in the Middle East and we have a lot of news headlines which are moving markets in large chunks up and down.
Whenever it is this noisy, I've found it's more important to be brief and focus on the very big picture. Last week I outlined the narrative of the markets going into the year and what has caused the sell-off since August.

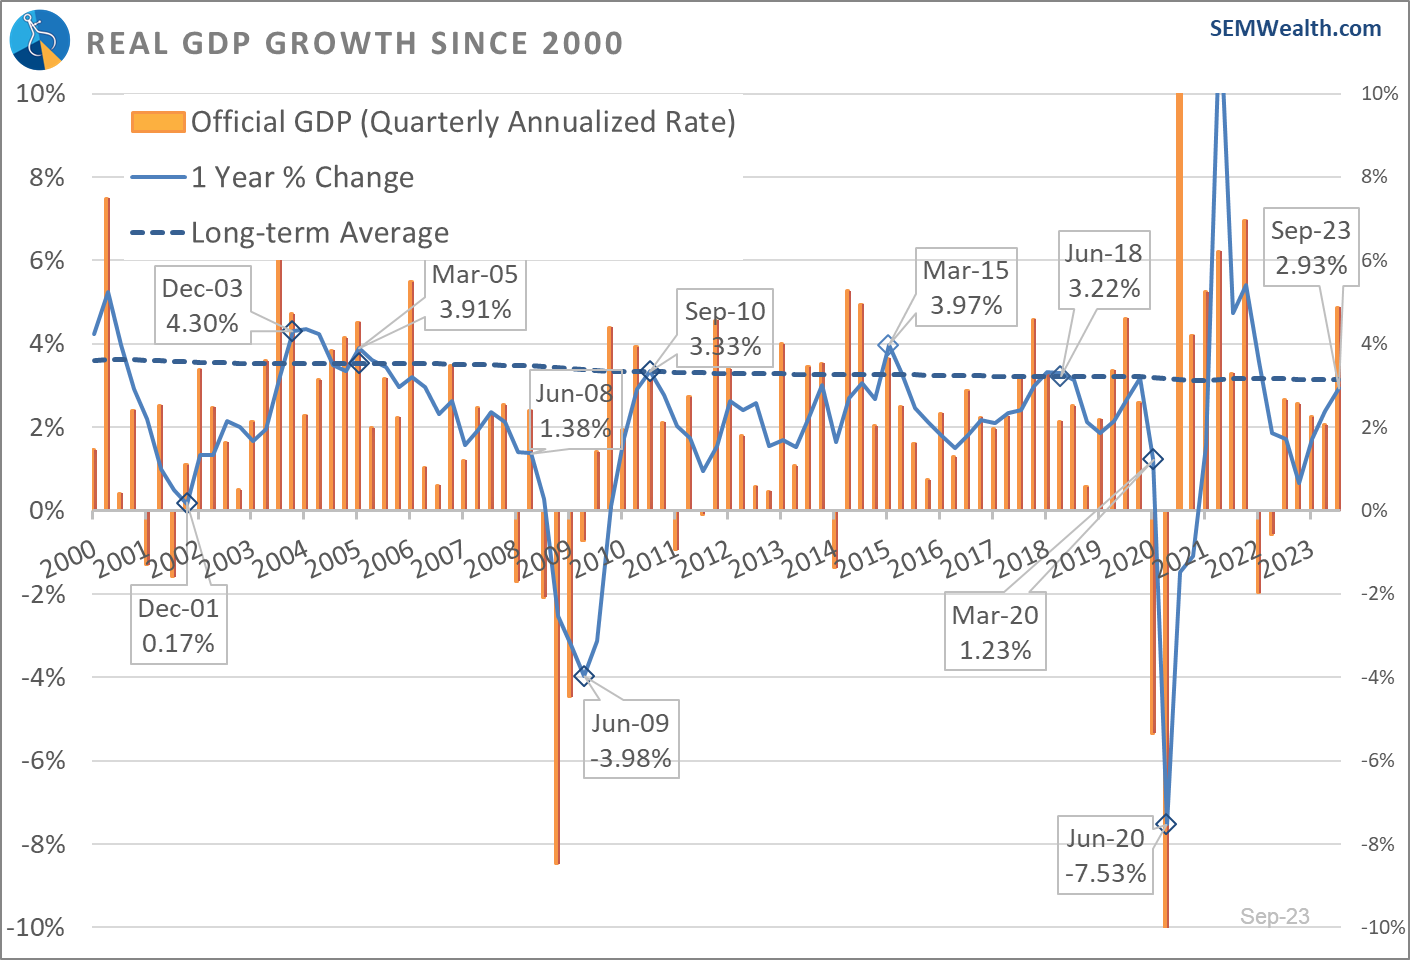
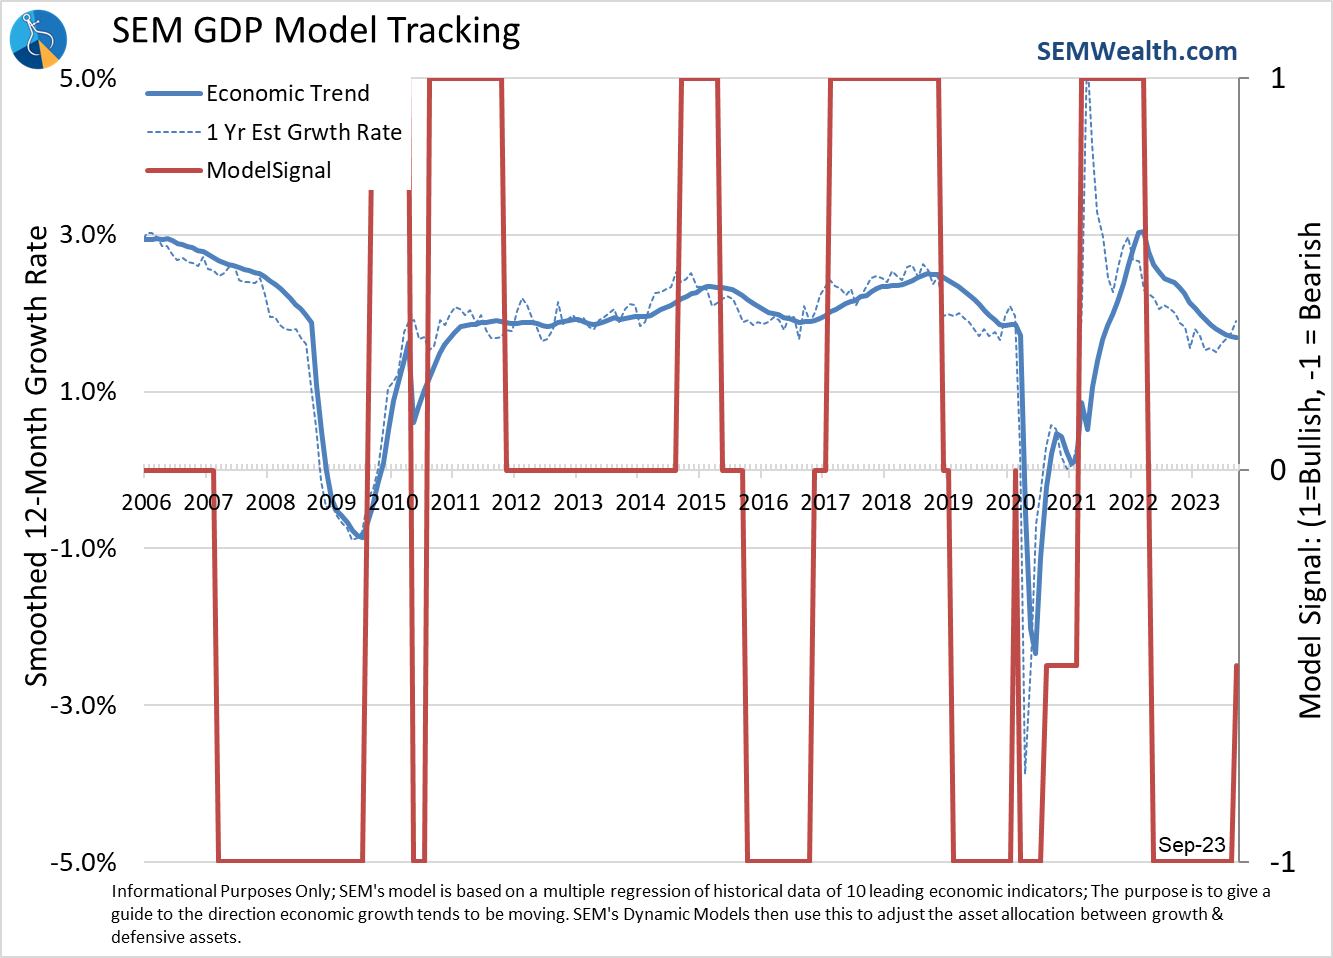
Nothing last week has changed that. While we will post our full economic update next week I did want to discuss last week's GDP data. Big headlines were made with the 'official' 4.88% GDP growth posted for the 3rd quarter. While impressive, I once again need to remind everyone that this is the only financial statistic where the change over the last 3 months is then annualized. When you include seasonal adjustment factors, you get a very noisy number.
This chart is one we bring out to properly frame the headline GDP number versus reality. The orange bars are the 'official' headline numbers. The blue line is what is more important – the % change from a year ago. This removes seasonal adjustment factors and everything else that could skew the 'official' number.
While the 2.93% is certainly impressive, it is yet again BELOW the long-term average growth rate of 3.1%. There are many factors which have led to this nice bounce, but based on the leading indicators as well as the earnings reports posted so far this quarter, this may be a short-term blip.
We will go through each of our leading indicators next week.
Market Charts
The Head & Shoulders Pattern I identified in mid-September has nearly been fulfilled.
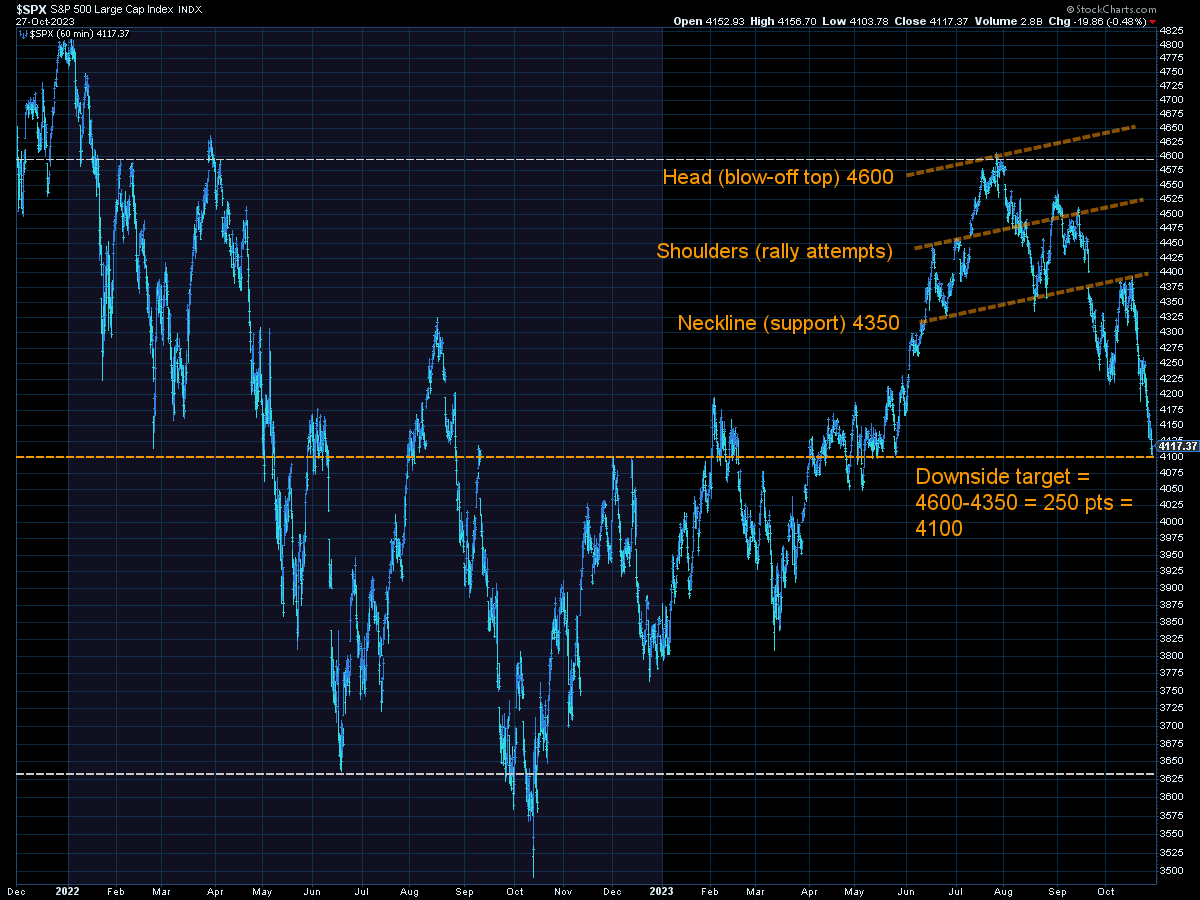
This doesn't necessarily mean the selling is over, but the 'blow-off top' that probably was not justified has been properly removed from the market. This means we could see a short-term bounce. Anything beyond that will come down to the underlying fundamentals (or at least the perception of them).
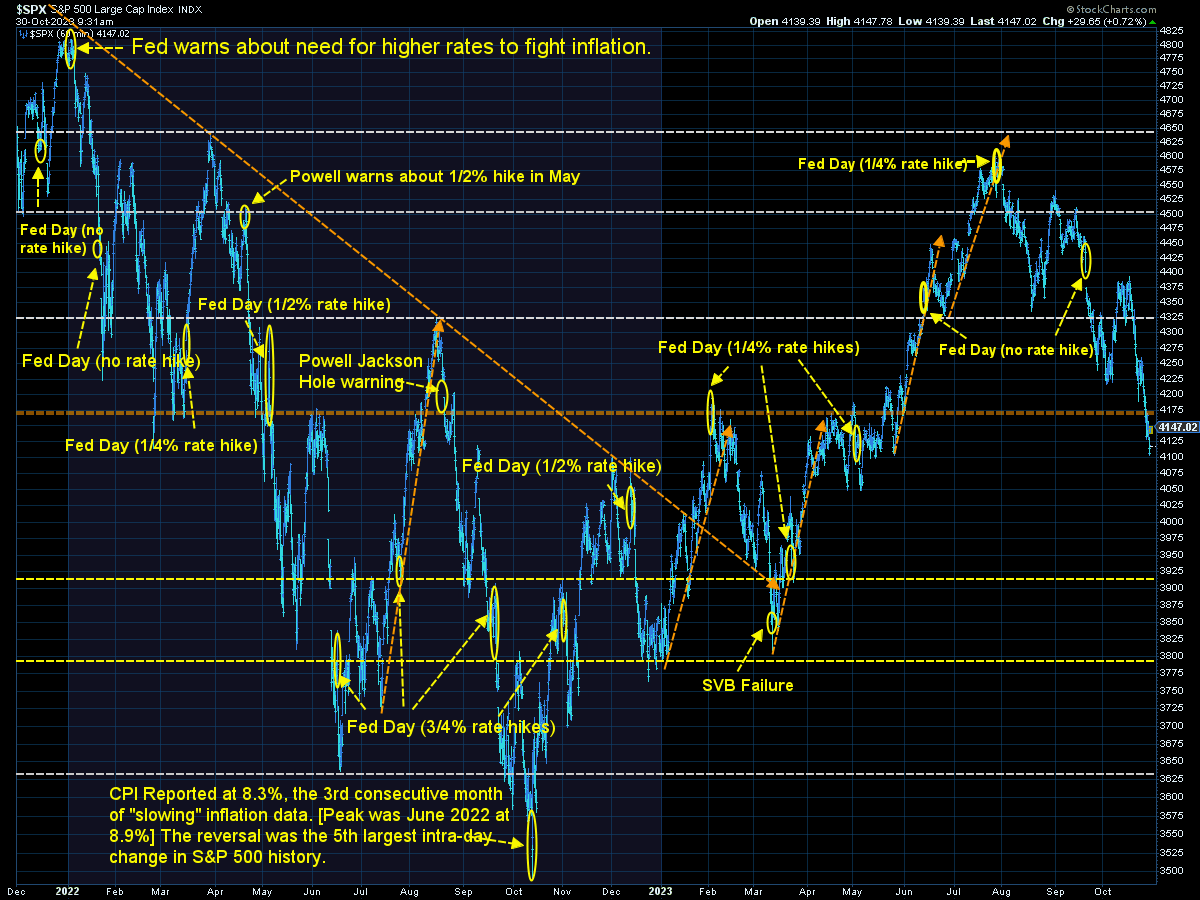
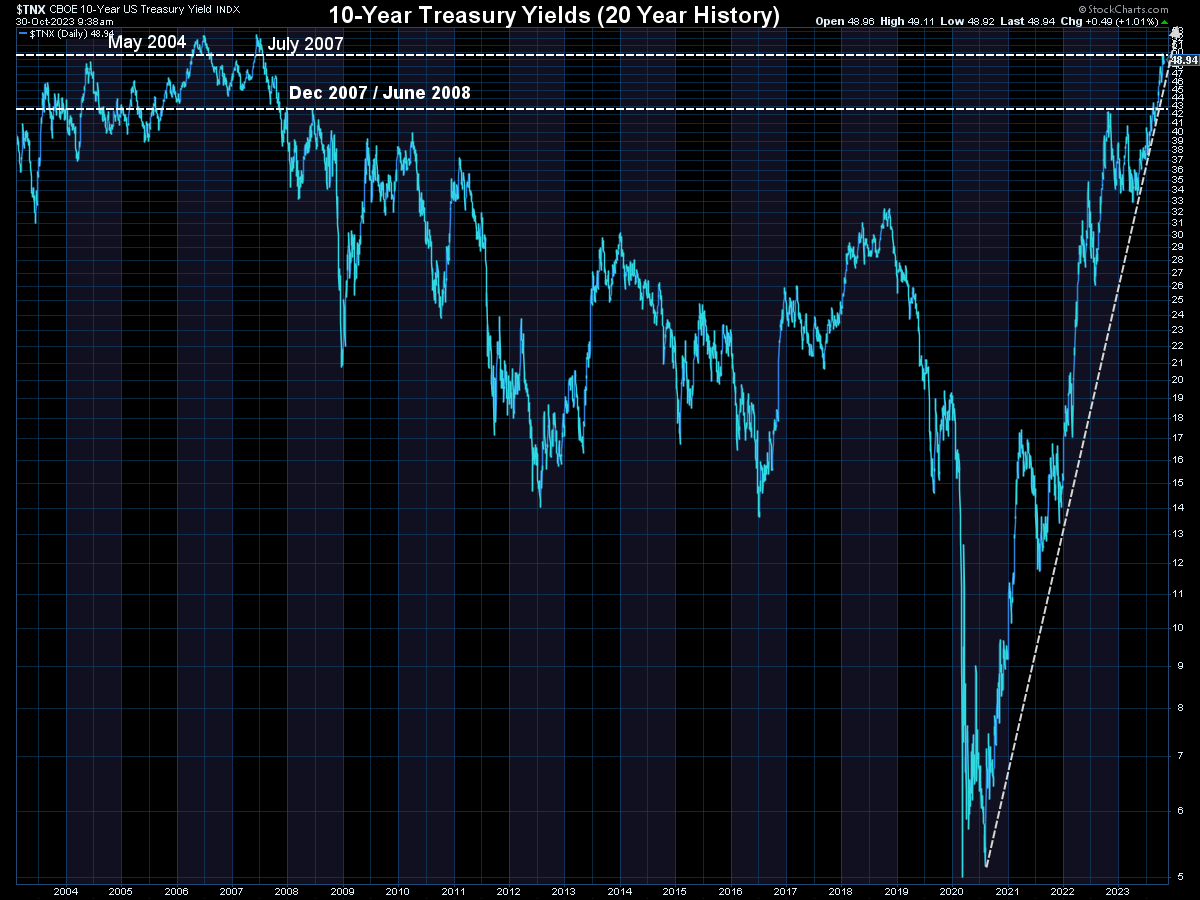
On a longer-term chart, it is easy to see this correction could keep going.
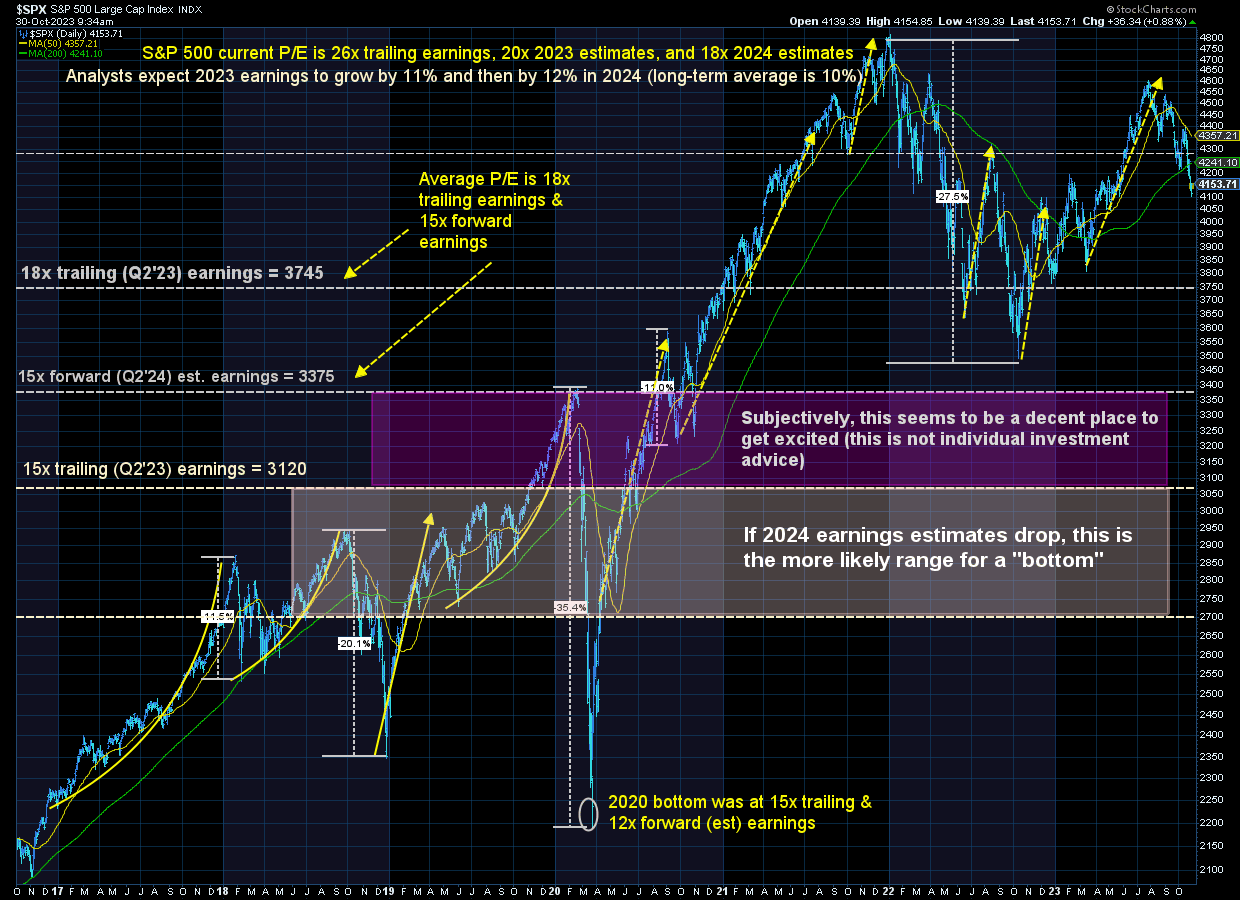
Bond yields are obviously a concern and could be part of the reason stocks are selling off. Not only does a 5% rate on Treasury Bonds start looking attractive relative to stock dividend yields below 2%, but any company using debt to finance their growth will be refinancing at significantly higher rates (as will our government).
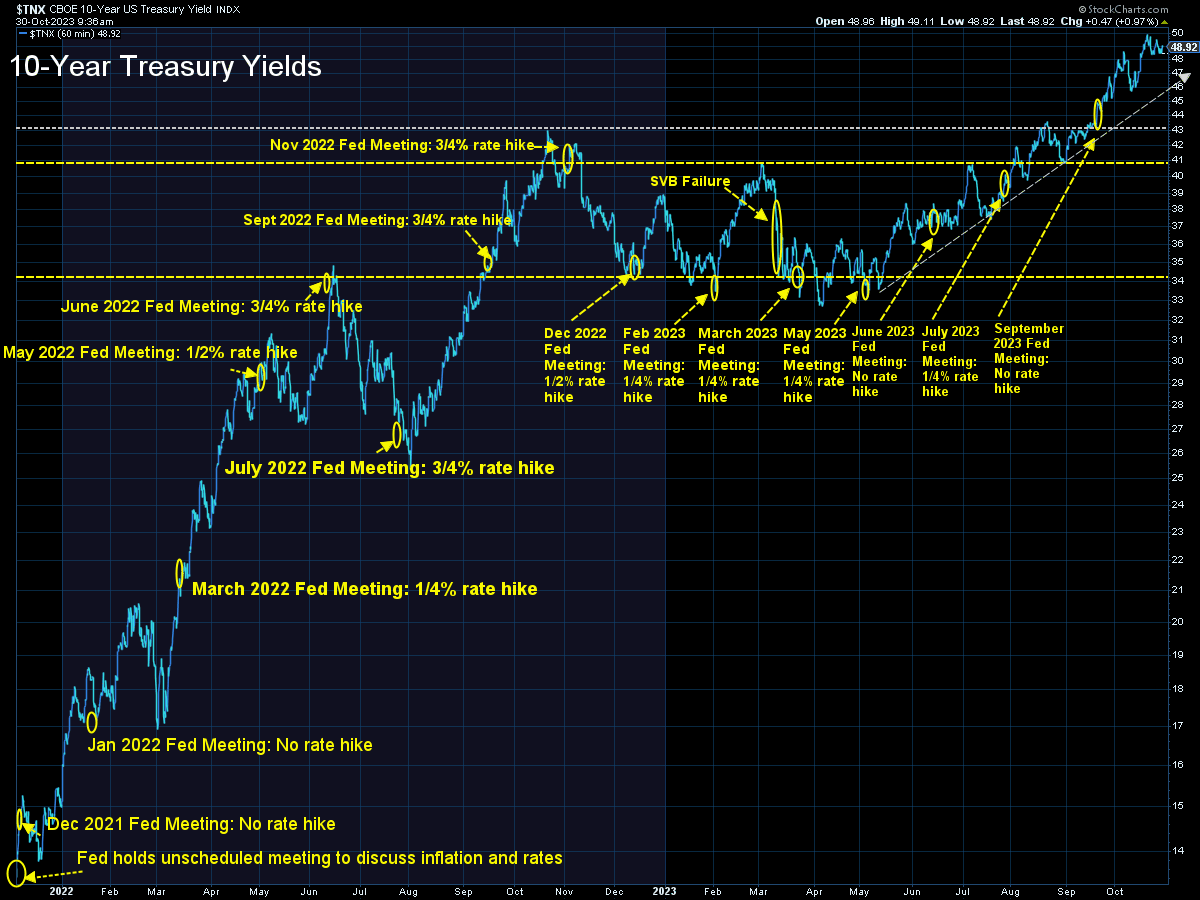
One of the things I've been discussing at every speaking engagement this fall is this – after breaking the economy to fight COVID, then breaking it to fight the recession, then breaking it again to fight the inevitable inflation, it appears the economy is settling back down to where we were in late 2019. At that time our economic model was 'bearish', because the growth rate was slowing significantly.
Ignoring that fact, people forget interest rates were 1.9% on the 10-year back in 2019. All things equal, interest rates will be a significant drag on growth going forward.
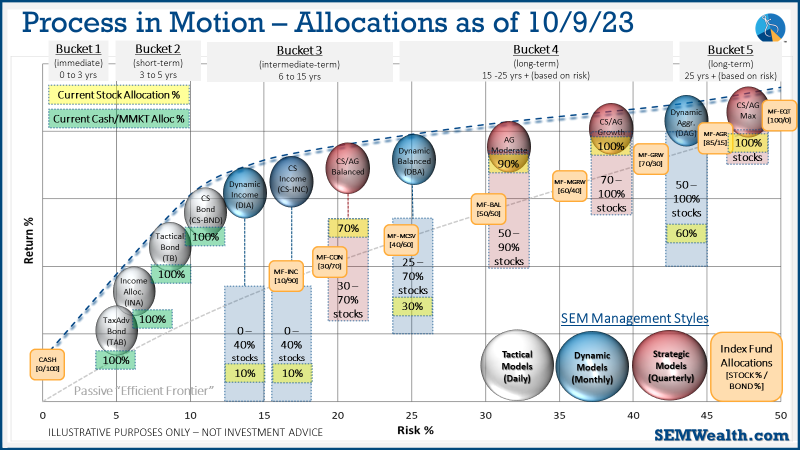
SEM Model Positioning
[no changes from last week, but likely many to come......stay tuned]
SEM deploys 3 distinct approaches – Tactical, Dynamic, and Strategic. These systems have been described as 'daily, monthly, quarterly' given how often they may make adjustments. Here is where they each stand.
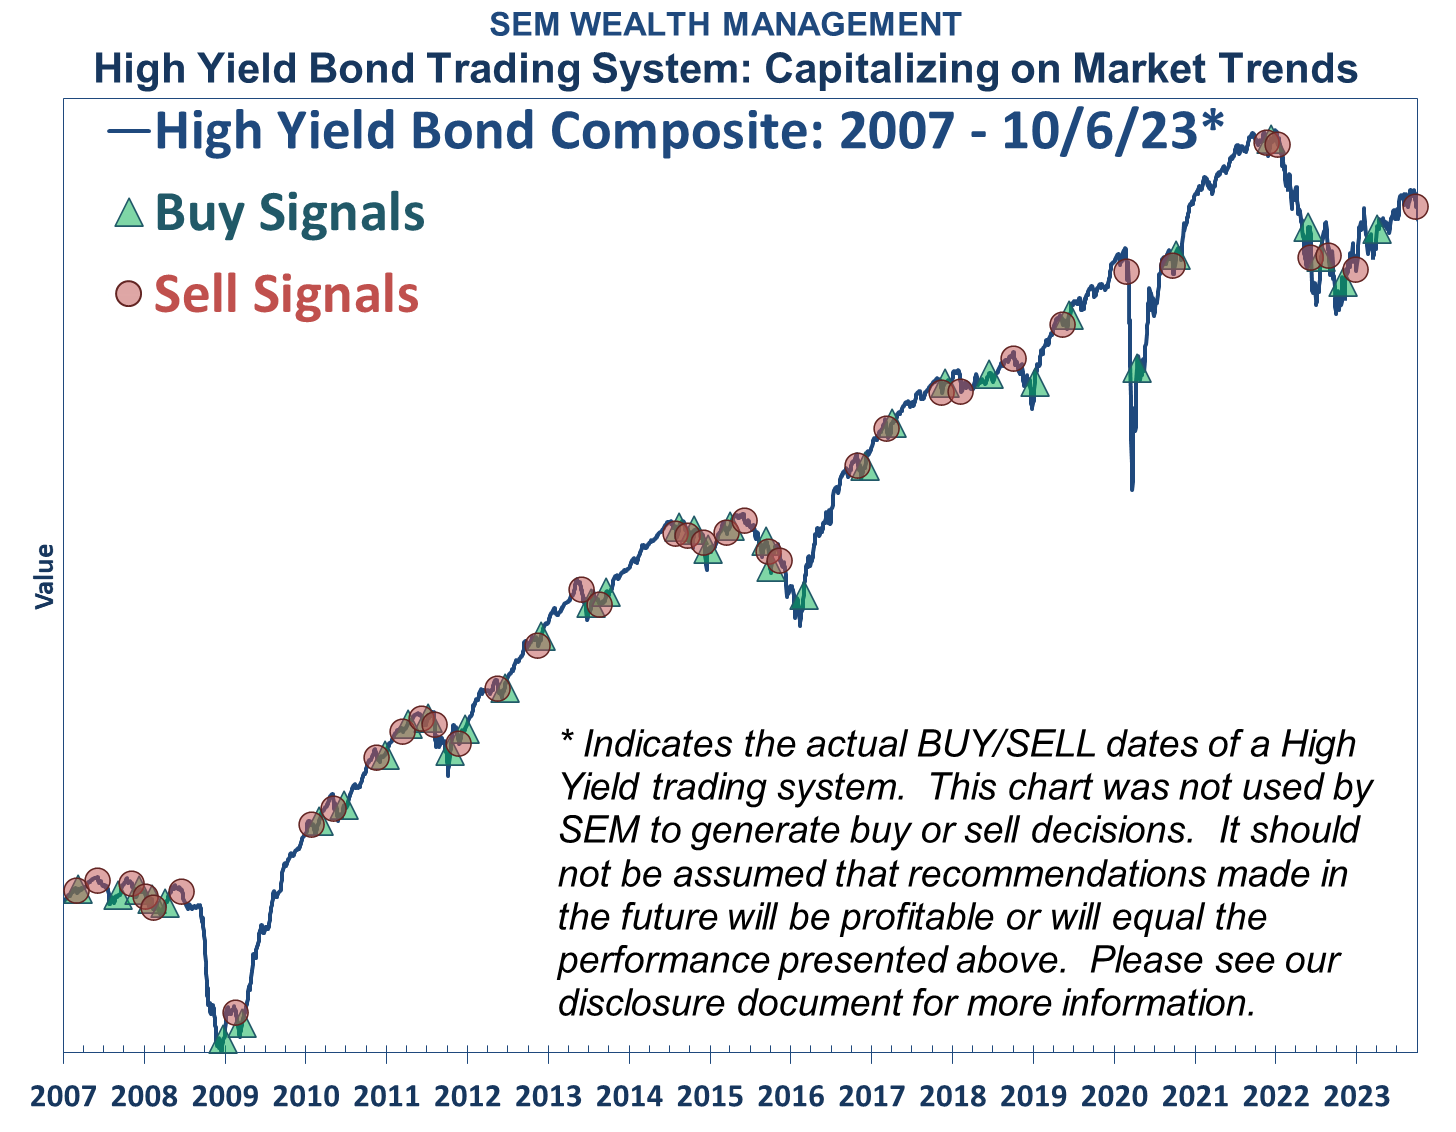
Tactical (daily): The High Yield Bond system which bought the beginning of April issued all 3 sell signals last week, so as of 9/28/2023 we are completely "risk-off". The money market accounts we are using have a 5%+ annualized yield, so we are happy to sit there as long as possible considering high yield (junk) bonds are only yielding 6 1/2 - 7% currently.
Dynamic (monthly): At the beginning of October the model moved slightly off the "bearish" signal we've had since April 2022. This means a small position in dividend stocks (Dynamic Income) and small cap stocks (Dynamic Aggressive Growth). Other than that, the models remain 'bearish'.
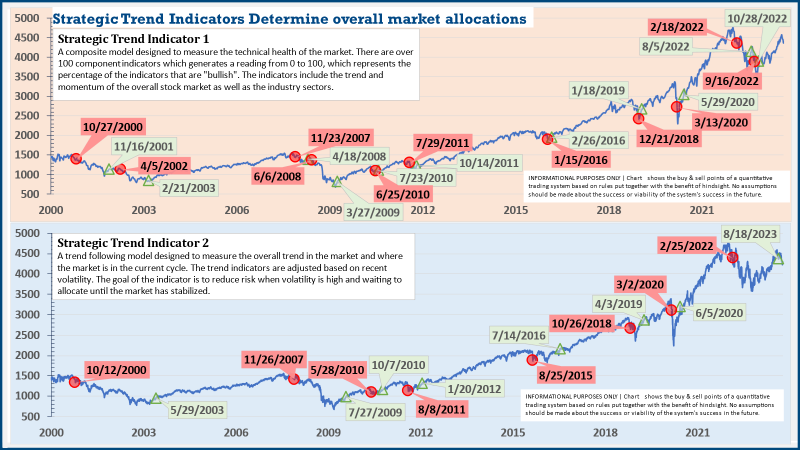
Strategic (quarterly)*:
BOTH Core Systems are very likely to sell this week.
The core rotation is adjusted quarterly. On August 17 it rotated out of mid-cap growth and into small cap value. It also sold some large cap value to buy some large cap blend and growth. The large cap purchases were in actively managed funds with more diversification than the S&P 500 (banking on the market broadening out beyond the top 5-10 stocks.)
The * in quarterly is for the trend models. These models are watched daily but they trade infrequently based on readings of where each believe we are in the cycle. The second indicator triggered on August 16, brining the strategic models to a fully invested position. We are NOT locked into these for the next quarter. The 'sell-point' for this system is down around 3-4% from here.
Overall, this is how our various models stock up: