If you've been following the markets as long as I have nothing really surprises you. The biggest thing I've learned is the market does not always makes sense depending on what data or framework you are using. The 'consensus' focus may be different than what you believe matters most. This doesn't mean you aren't 'right' or won't be proven 'right', but sometimes you just have to let the current 'thinking' play out.
There have been plenty of times in our 30+ year history where the market gets 'excited' when the economic data is 'weak'. More often than not the 'weak' economy eventually ends up being bad for the stock market, but you just have to be patient and let it play out. This is another reason SEM deploys three distinct management styles – Tactical, Dynamic, & Strategic. As further protection during these disconnected markets is to utilize multiple trading strategies inside of each management style. (Summarized at the bottom of each weekly blog)
This week's Musings is going to be a long one. There are A LOT of things moving which have impacted many of our models. I tried to add headings to make it easier to digest. Here we go.......................
Economic Summary
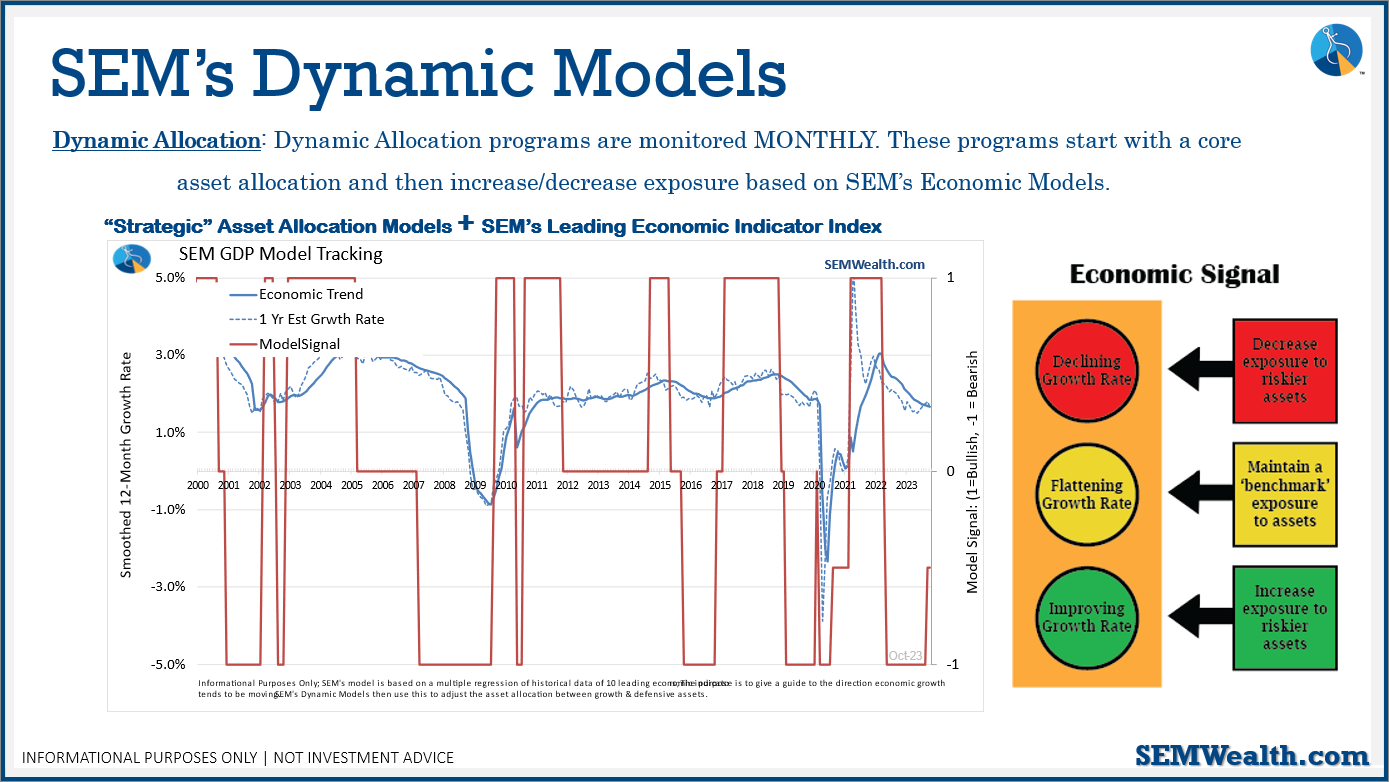
Let's start with our economic dashboard. While all indicators are best used in combination with the other ones, these indicators are ranked from the highest 'predictive' ability down to the lowest to give us a better sense of what we should be focusing on.
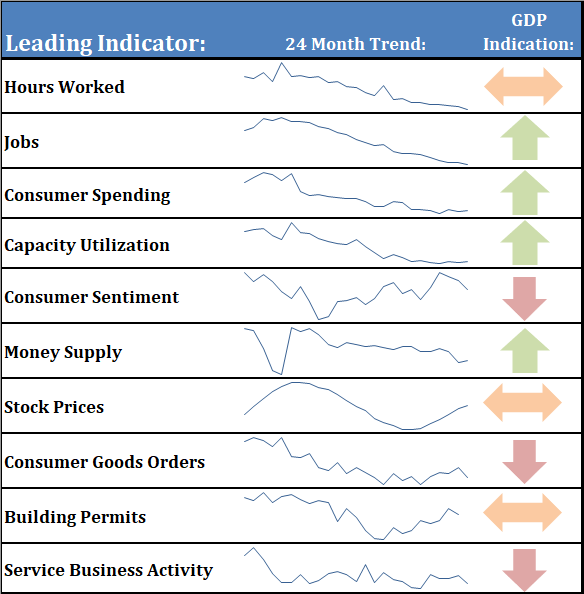
You could summarize the economy like this:
- Jobs & Consumer Spending continue to hold up the economy with a boost from the Federal Reserve slowing down their tightening. We also are seeing a longer-term boost from 'reshoring' some of the manufacturing/storage of our supply chain.
- Cracks are emerging with employers cutting hours, earnings growth decelerating, & home building slowing down.
- Consumers are not optimistic, which is leading to a sharp slowdown in 'big ticket' purchases. At the same time service businesses are seeing a big slowdown in activity.
Now any of the above can change. Additional weakness in the labor market combined with weak consumer sentiment could throw consumer spending into the 'negative' category which makes the chances of a recession much more likely. Conversely, if the Fed is truly done AND we don't see any sort of financial stress we could see optimism emerge. My opinion is the former is much more likely than the latter.
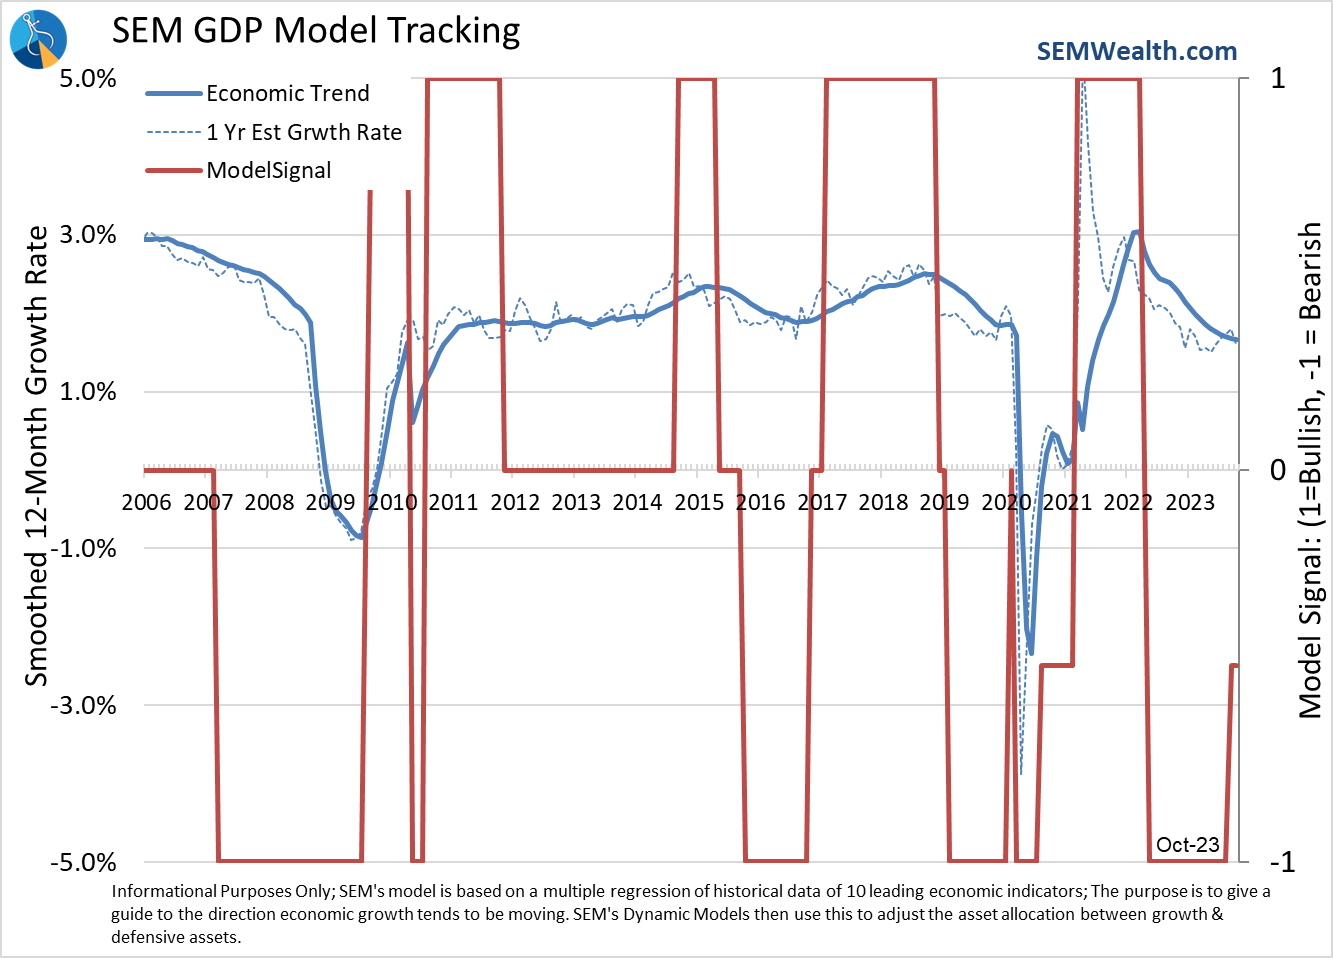
Our economic model slightly improved last month, leading to a 'half' signal which led to us dipping our toe into some risk assets. That half signal is hanging on by a thread this month.
Indicator Charts
The last two months we've had so much else to discuss I ended up not going through each indicator. The same could be said for today, but I know we have a lot of new readers to the blog following my fall speaking tour, so I'll breeze through each of our leading indicators here:
Jobs – still strong, but slowing rapidly
The number of jobs and the unemployment rate are actually a 'coincidence' indicator. This means jobs are usually declining DURING a recession. We aren't there yet, but getting closer.
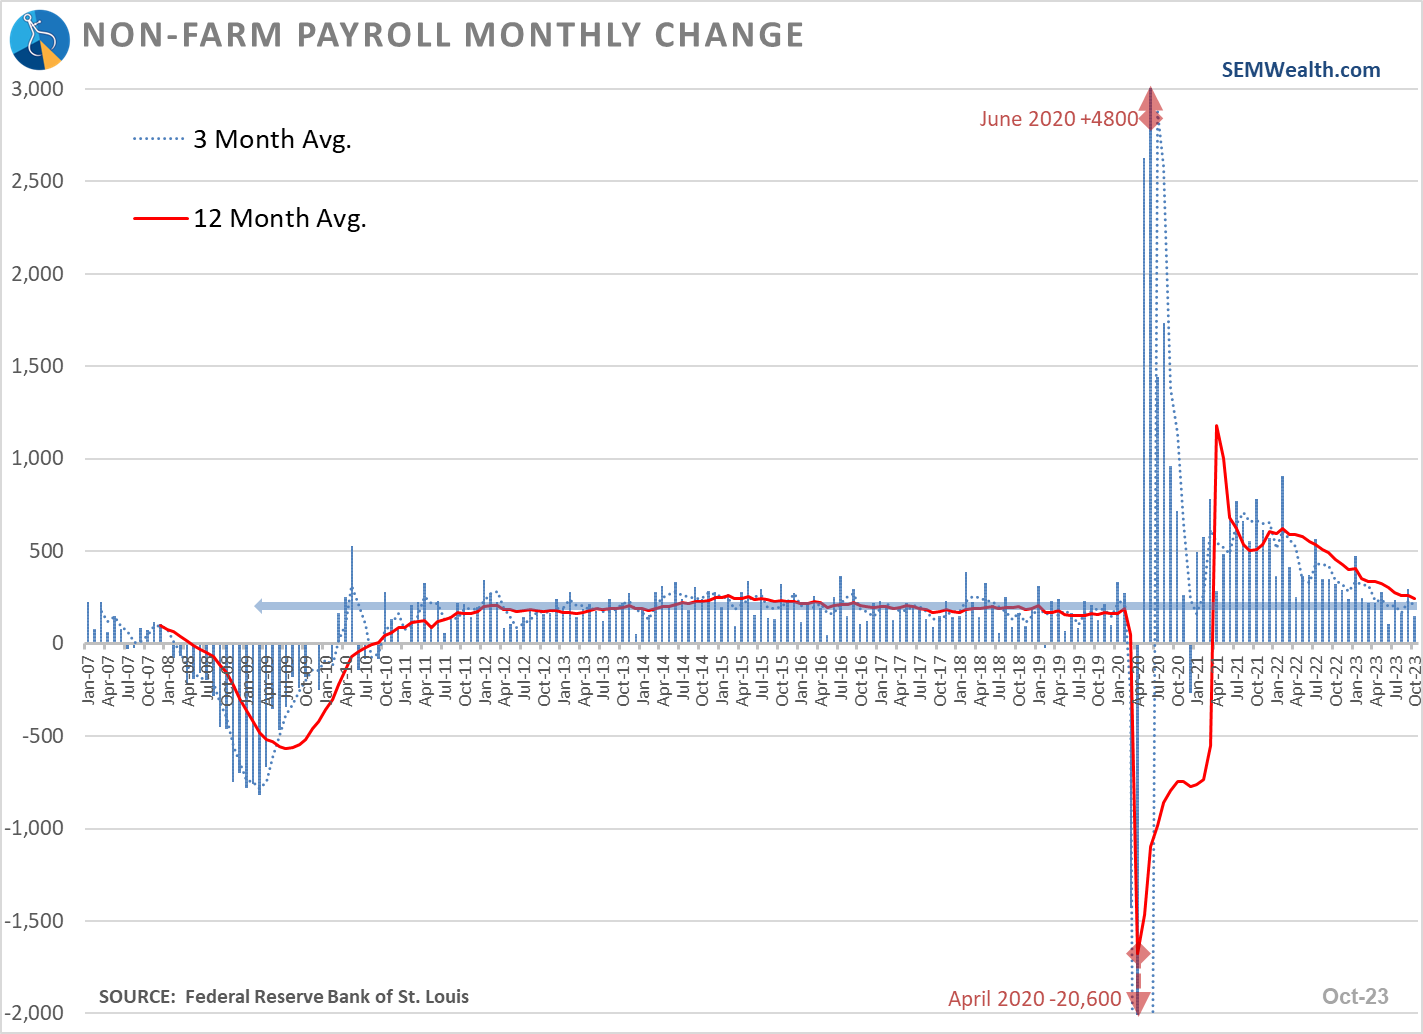
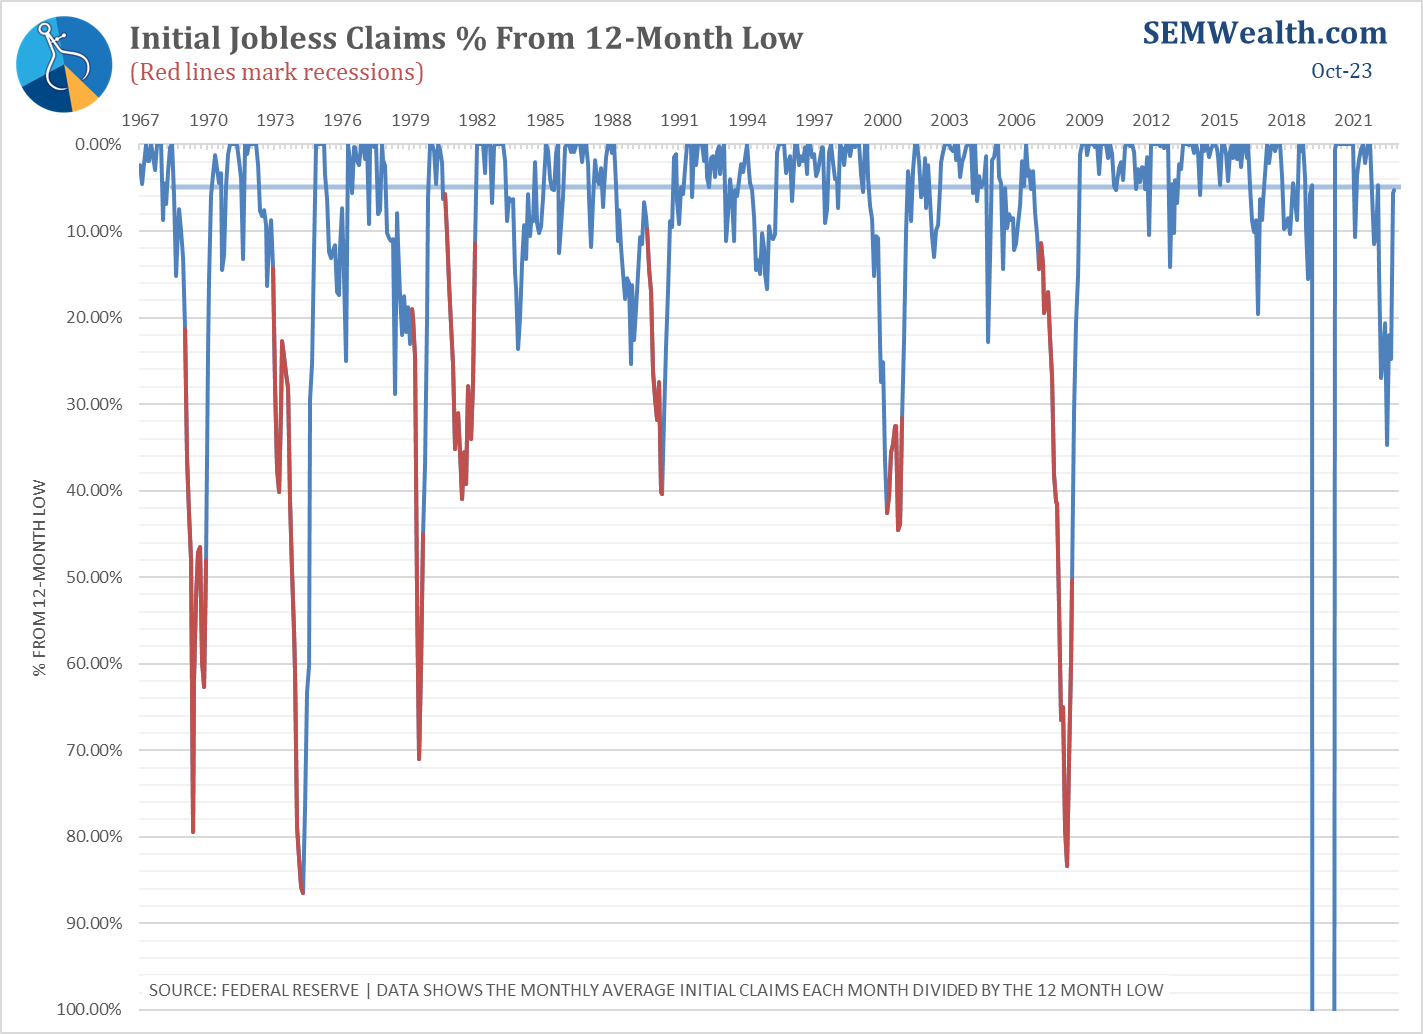
A better indicator is the % from the Low for Initial Jobless Claims. It has been 'less bad' the last month or so, but claims are still higher than they were a year ago.
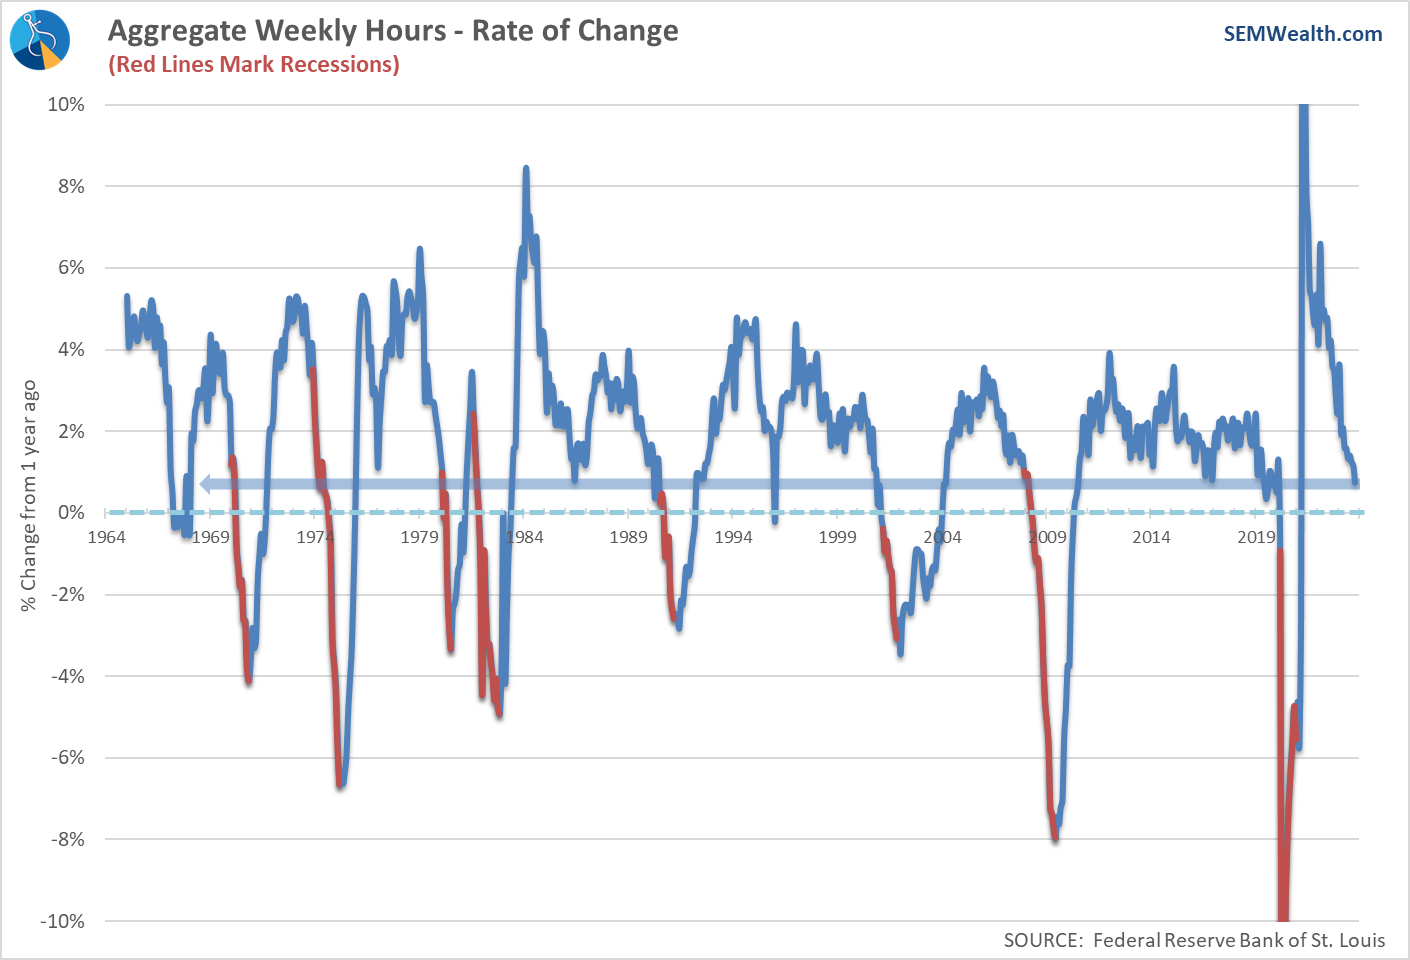
More importantly Hours Worked, a strong leading indicator for not only the labor market, but also the economy overall, is slowing rapidly as well. It's still positive, but heading in the wrong direction.
Consumers Still Spending....for Now
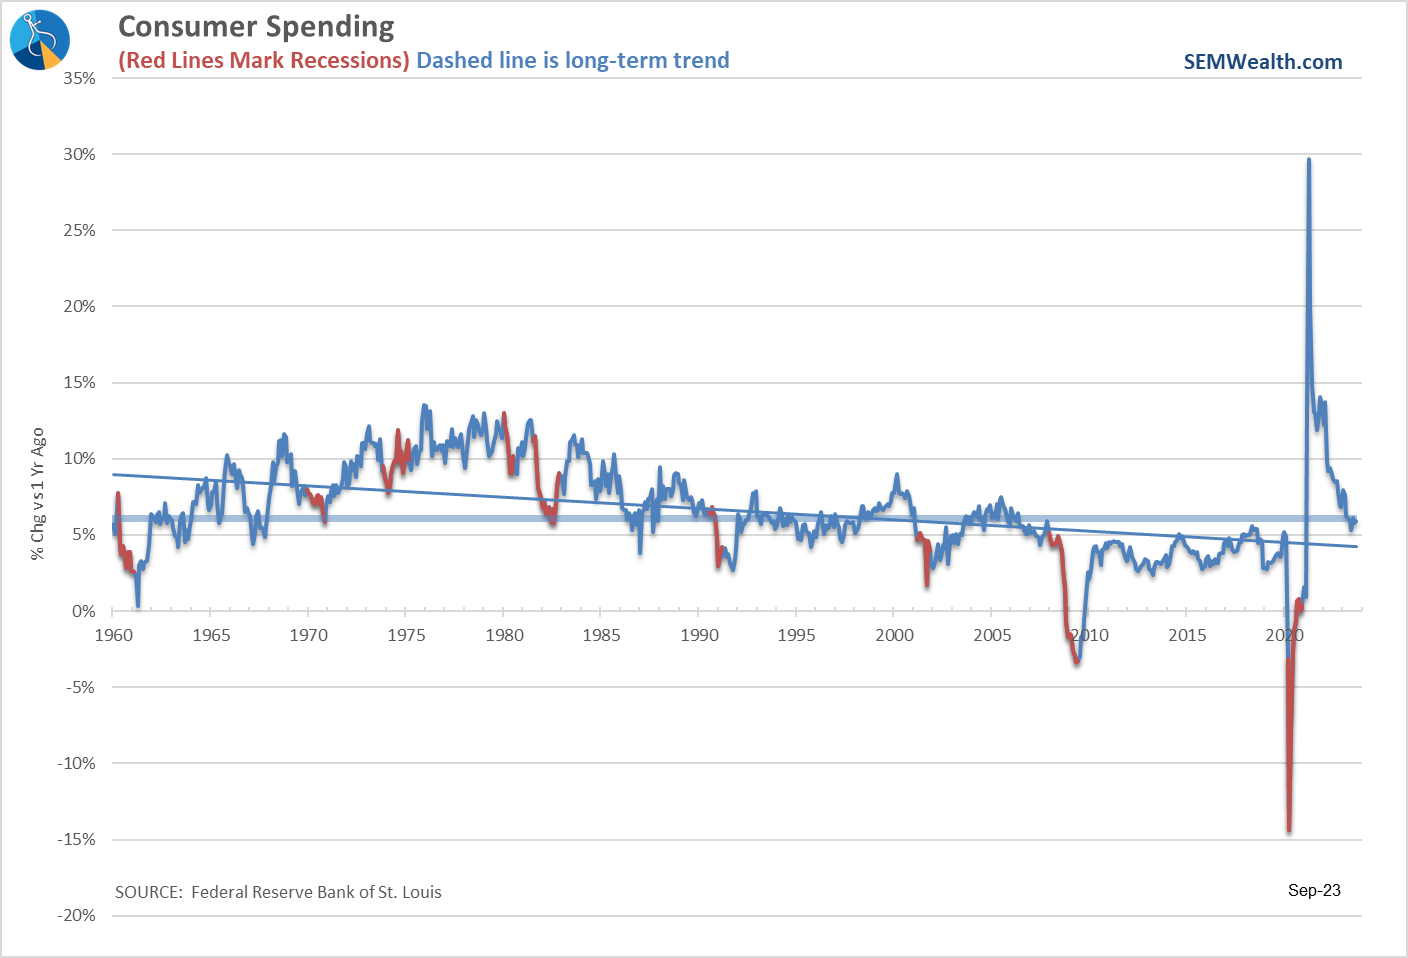
Throughout the recovery, consumers with excess money thanks to Congress and the Fed have blown past all rational predictions of when they would stop. There is plenty of evidence the average American's finances are getting much tighter. We are starting to see delinquencies in auto loans, credit cards, and mortgages increasing to levels not seen since before the financial crisis. For now, though, the overall spending level is still boosting GDP nicely. Even at this slower growth rate the annualized change in spending continues to exceed anything we witnessed since 2006.
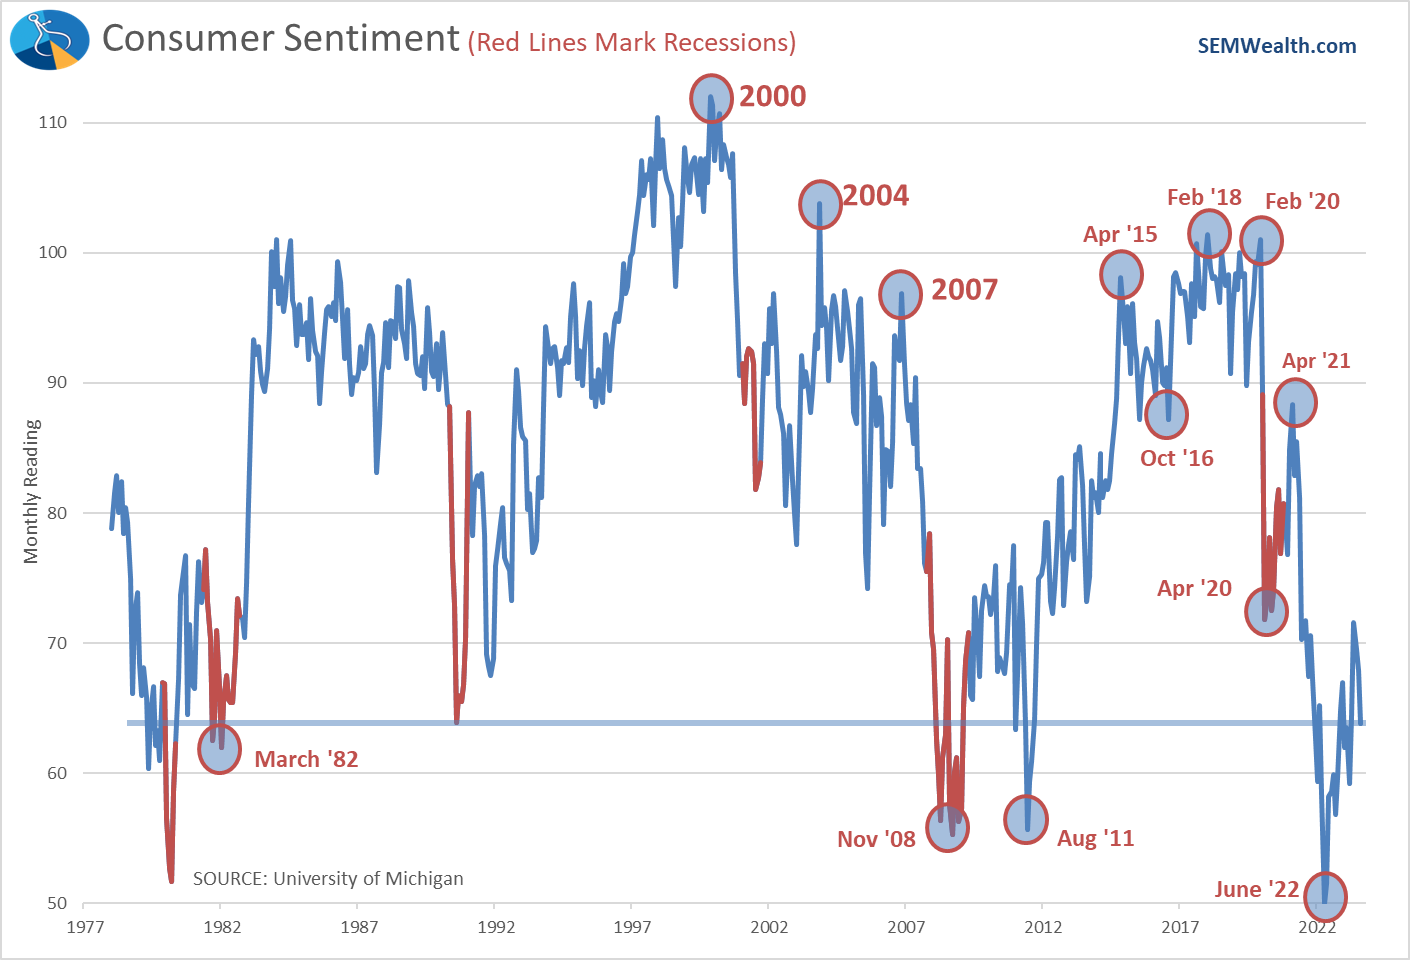
That said, consumers do not 'feel' very good about the economy with sentiment once again falling and sitting at recessionary levels.
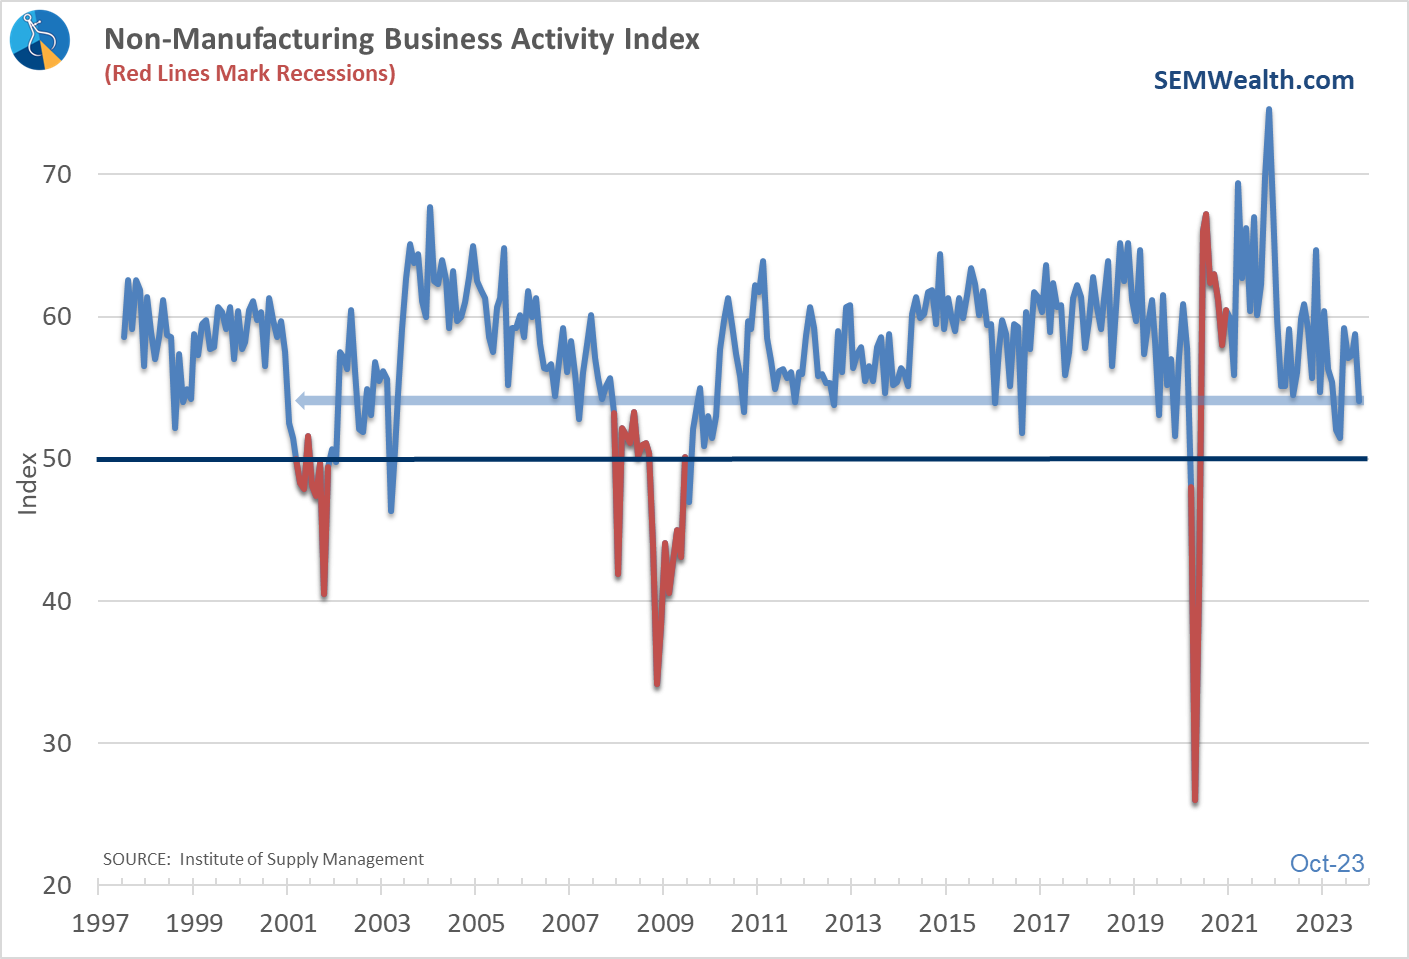
We've also seen Service Business activity slowing down recently which is never a good sign.
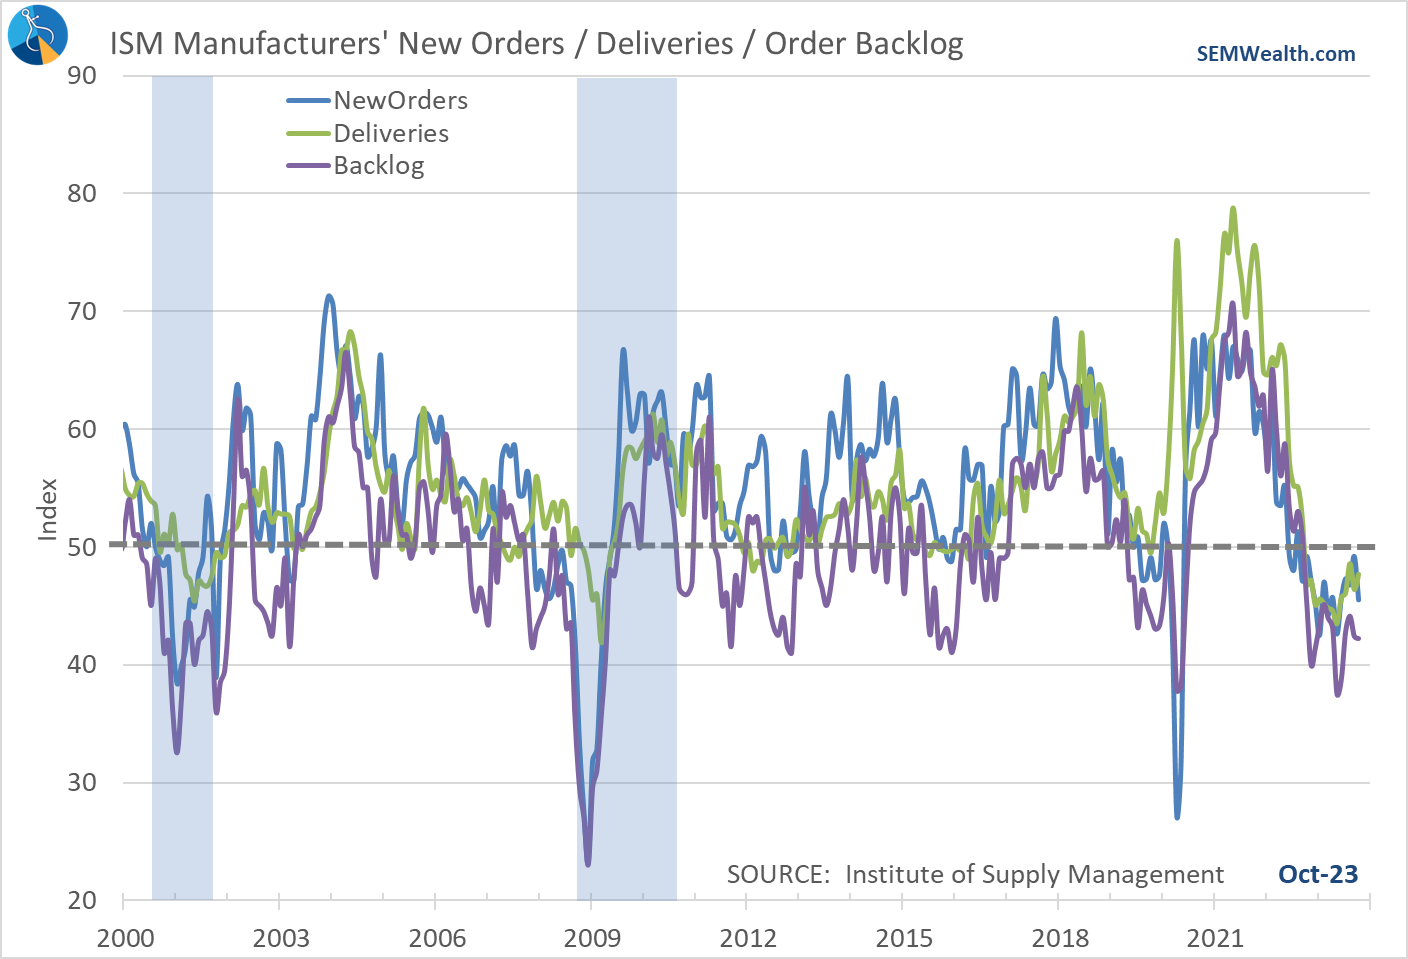
Similarly, consumer spending on big ticket items continues to be weak. These leading indicators of manufacturing activity show continued contraction in consumer goods orders, which tends to be an indication of a slowing economy.
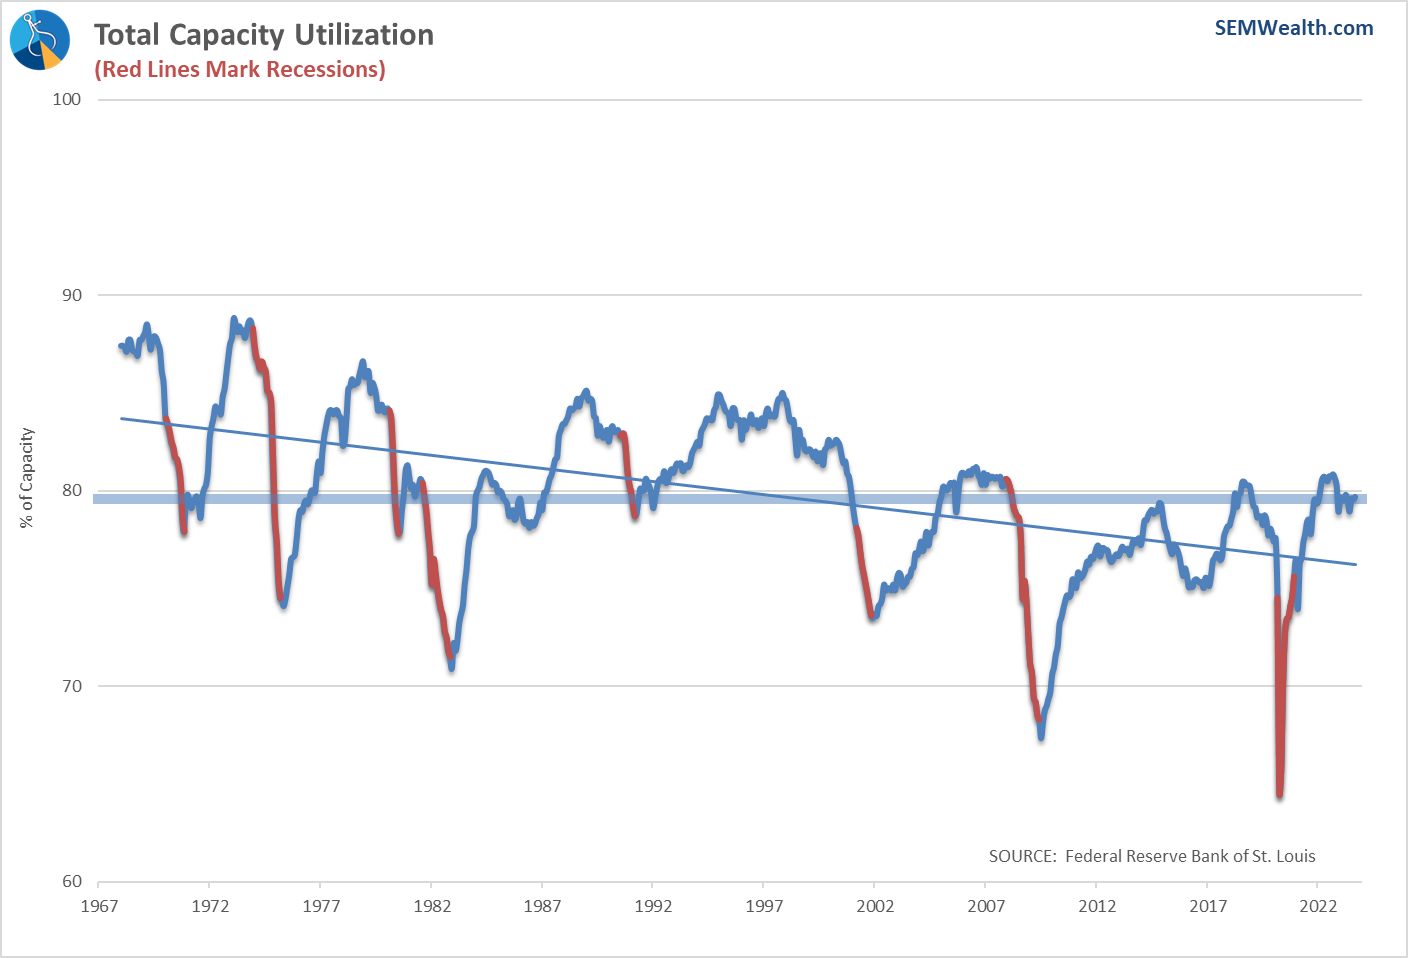
Investment Spending is Slowing Again
I've said several times one of the 'benefits' of COVID is realizing we cannot rely on one region for every area of our supply chain. This led to a resurgence in manufacturing in the US. This also showed up in the Capacity Utilization data. A few months ago we hit a level not seen since before the financial crisis, but that has since slowed down.
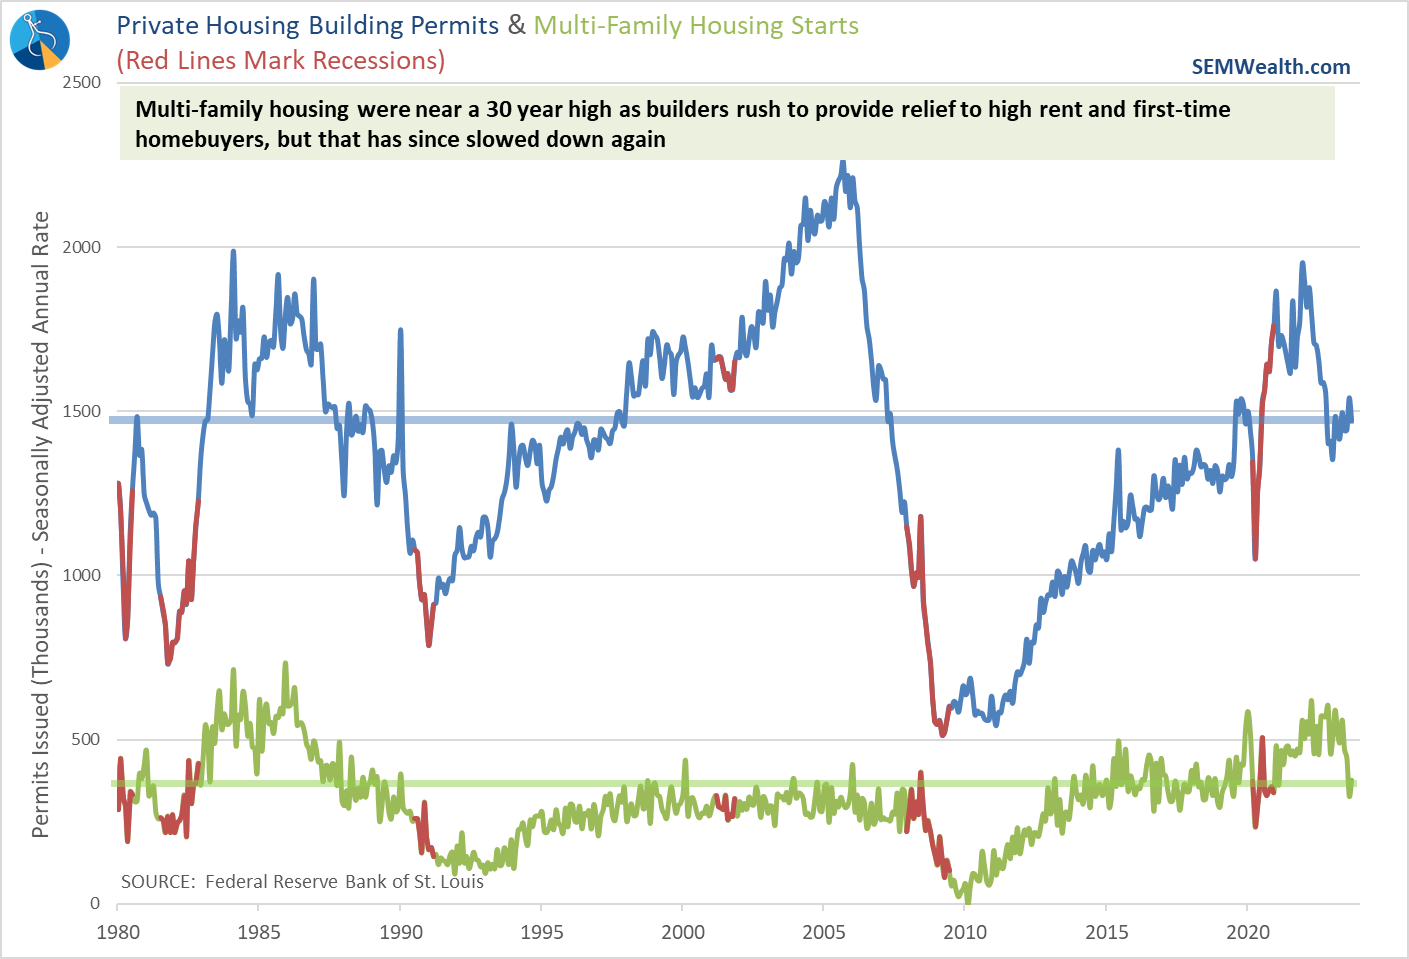
COVID also led to a housing boom. While interest rates have not hit housing activity as hard as most of us thought it would we are starting to see signs the demand for new homes is slowing with building permits continuing to slow, especially in the much needed multi-family sector.
The Fed's Balancing Act
The Fed stimulated way too much when they didn't need to. They then kept stimulating way too long as the economy roared out of the pandemic. They then panicked and hiked rates way too fast to fight inflation. They haven't really tightened the money supply, simply grew it at a slower rate.
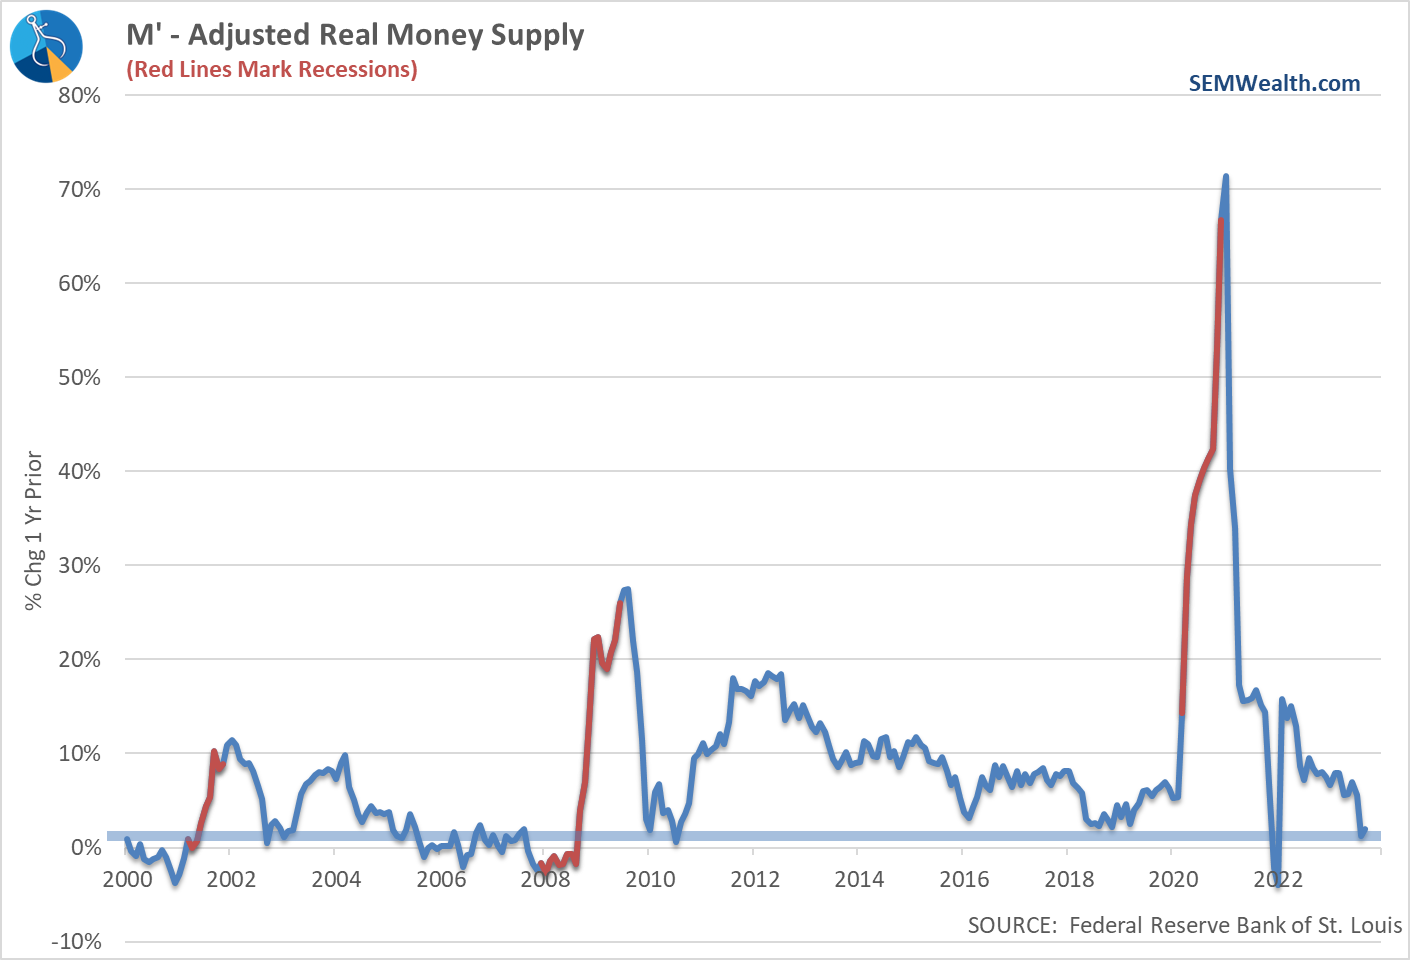
They've also been trying to unwind their balance sheet, but this has not been easy.
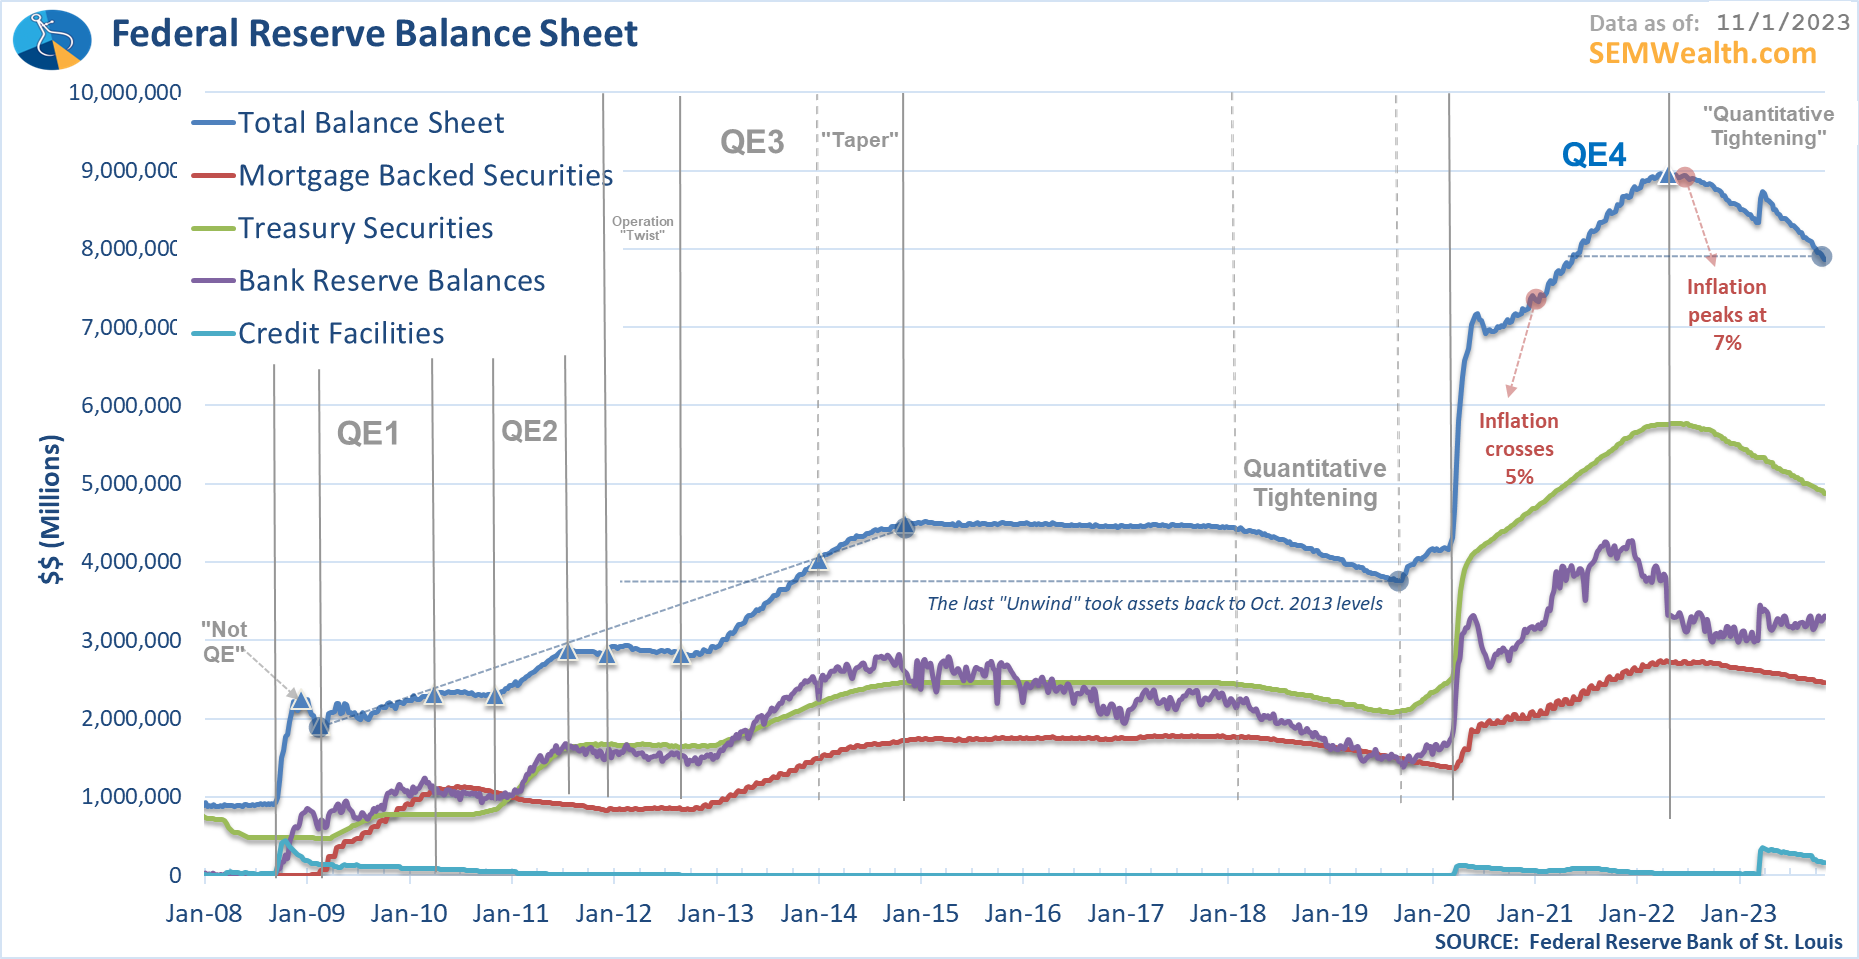
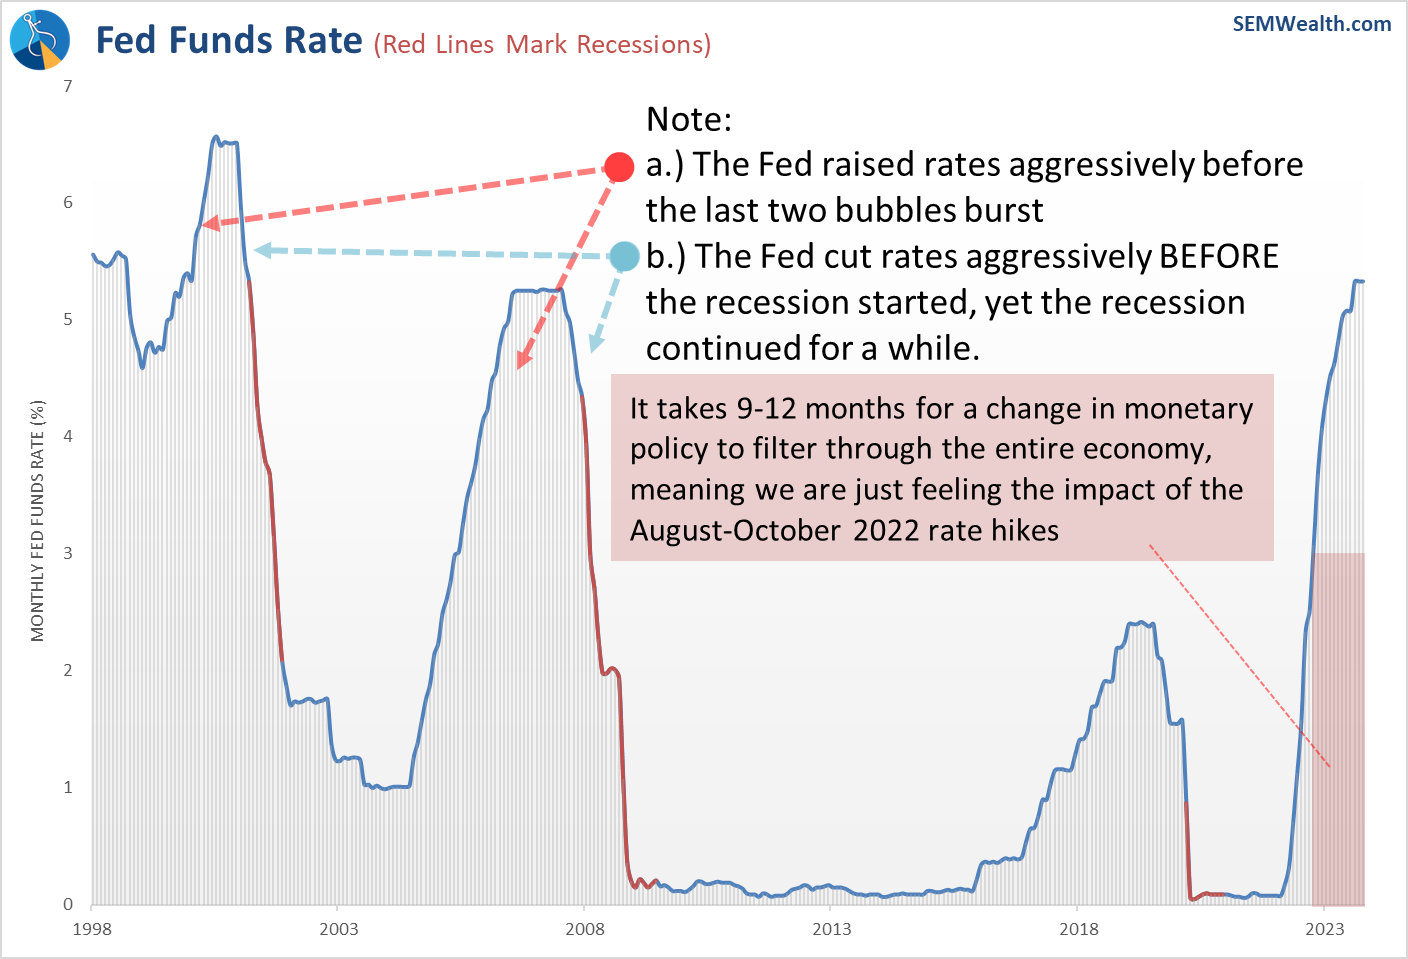
The bigger issue of course is the delay in the impact of higher rates. We still have 1/3 of the rate hikes that have yet to filter through the economy along with the big jump in Treasury yields the past 6 months.
Speaking of interest rates........
Tempted by Cash or CDs?
A few weeks back we discussed the nice set-up for longer-term investors willing to take on some risk to generate significantly higher returns using BONDS. We understand not everyone has that long of a time horizon or can handle the type of risk Treasury Bonds have if for whatever reasons bond yields go up. You can view that article here:

Last week the so-called "Bond King" Jeffrey Gundlach of Doubleline was asked about his prediction for bonds going forward. (Click here for the full article)
Here are some quotes from the article:
“I think rates are going to fall as we move into a recession in the first part of next year. I don’t like cash because I think your interest rate, which is very attractive presently, may decline quite substantially next year.”
“I would rather be in something that’s about two to three years. T-Bill and Chill—you can buy the six-month T-Bill and get 5.5%. The rate is no longer going higher, it’s now starting to potentially decline, so I don’t think you want to be in cash.”
The bond market is predicting the Fed will cut rates by 0.5% next year, but Gundlach said that's “one thing I think will not happen.”
“If the economy rolls over as I expect, the Fed is not going to cut rates 50 basis points, they’re going to cut rates 200 basis points. That’s what’s wrong with the cash strategy.”
Trend Change?
While we do not factor other opinions into any of our investment models or decisions, we do take comfort when our strategy closely matches the recommendations of somebody with a strong track record of managing risk in difficult markets.
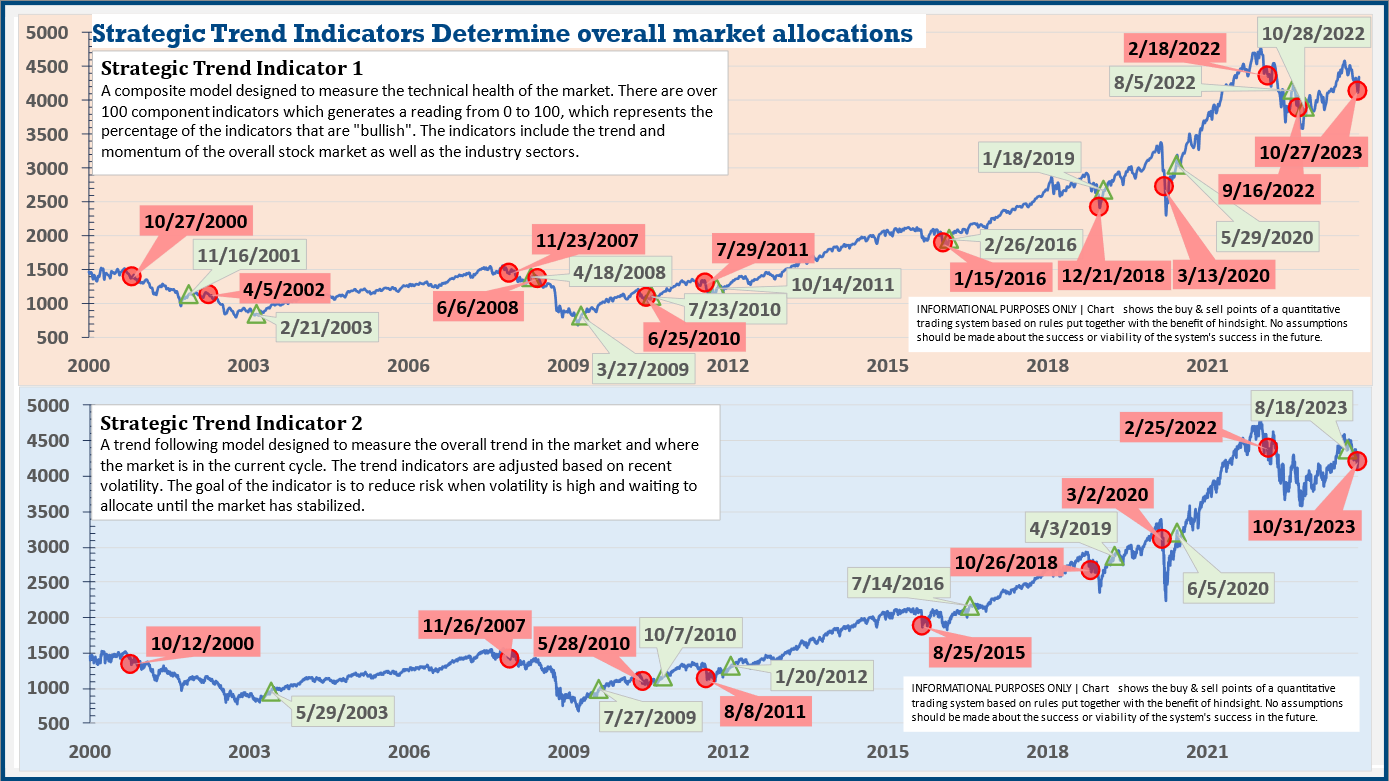
This week, both trend indicators inside AmeriGuard (Balanced, Moderate, & Growth) and Cornerstone (Balanced & Growth) triggered sell signals. Of course this was just before the Fed somehow unleashed a celebration that the economy is cooling (which means inflation is cooling and the Fed thus should not have to raise rates any time soon.)
Both of the trend indicators use different components to generate the signal. We use two of them because we know all trading systems have times they do not work. The chart below shows all of the real-time trades plotted on the S&P 500 index. Some are great signals (missing a big chunk of the downside or getting in near the bottom), others result in a 'loss' (missing some of the upside), and others are a 'wash' (change direction around the same point).
We won't know until we get a few weeks or months in if the actual trend has changed. These systems all have the ability to change back to the upside if the data changes. What we do know is when the economy is slowing, earnings growth rates are decelerating, and interest rates are significantly higher than they were a year ago it typically is not an easy environment for the stock market.

Time for Bonds?
Whenever we get a 'sell' signal in the trend indicators above the question is where to put the cash. There are various indicators which look at potential returns/risk, the current trends, and the correlation of the various bond sectors. The last sell signal we spent most of the time in short-term bonds or money market accounts. This time
Interestingly enough, so far since the "sell", the bond funds we have invested in have nearly kept pace with the stock market, so in the very short-term we haven't missed any upside. A lot can change going forward, but as we noted back in mid-October, the return/risk for bonds is significantly more attractive than stocks at these yield/valuation levels.
Last week the 10-year Treasury Yield broke the uptrend line started back in May.
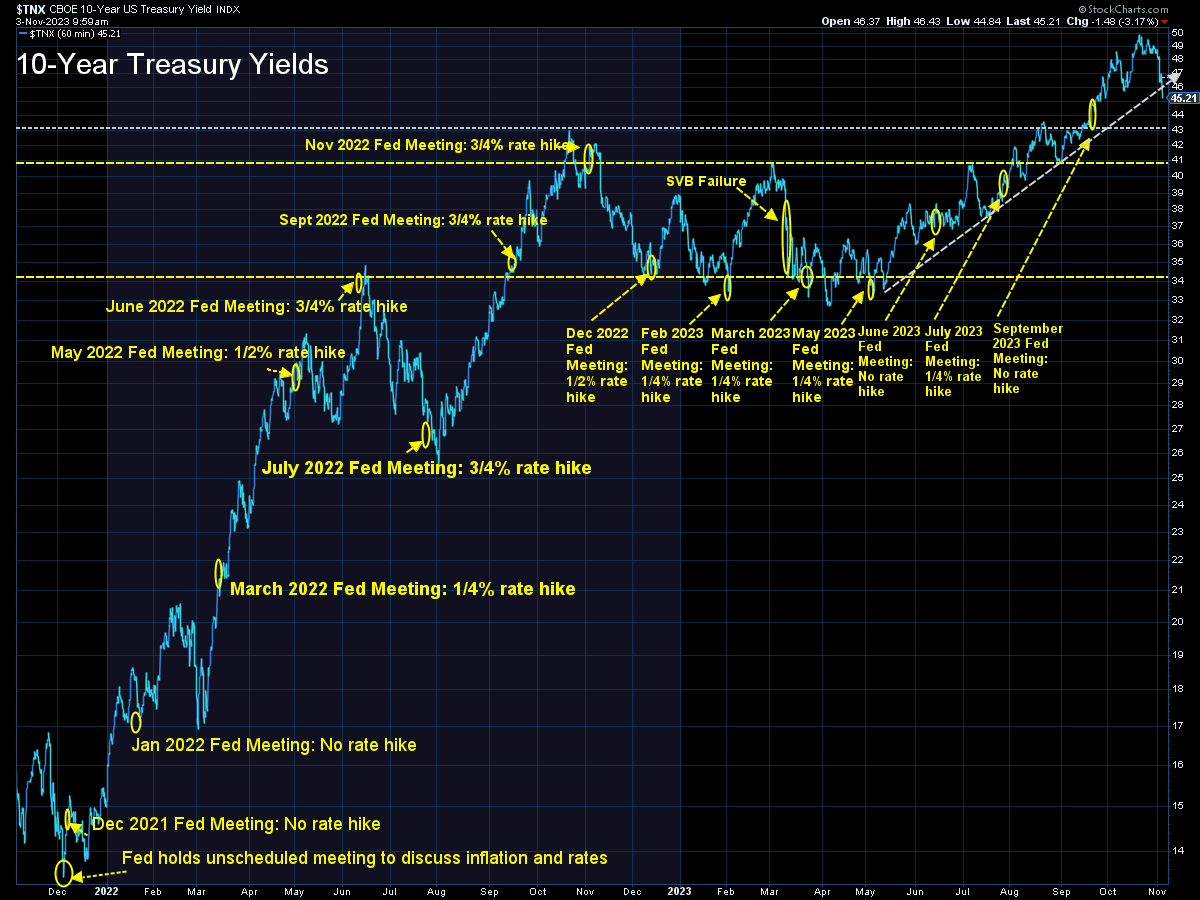
You also have to squint to see it, but even the very steep uptrend line in yields was broken last week.
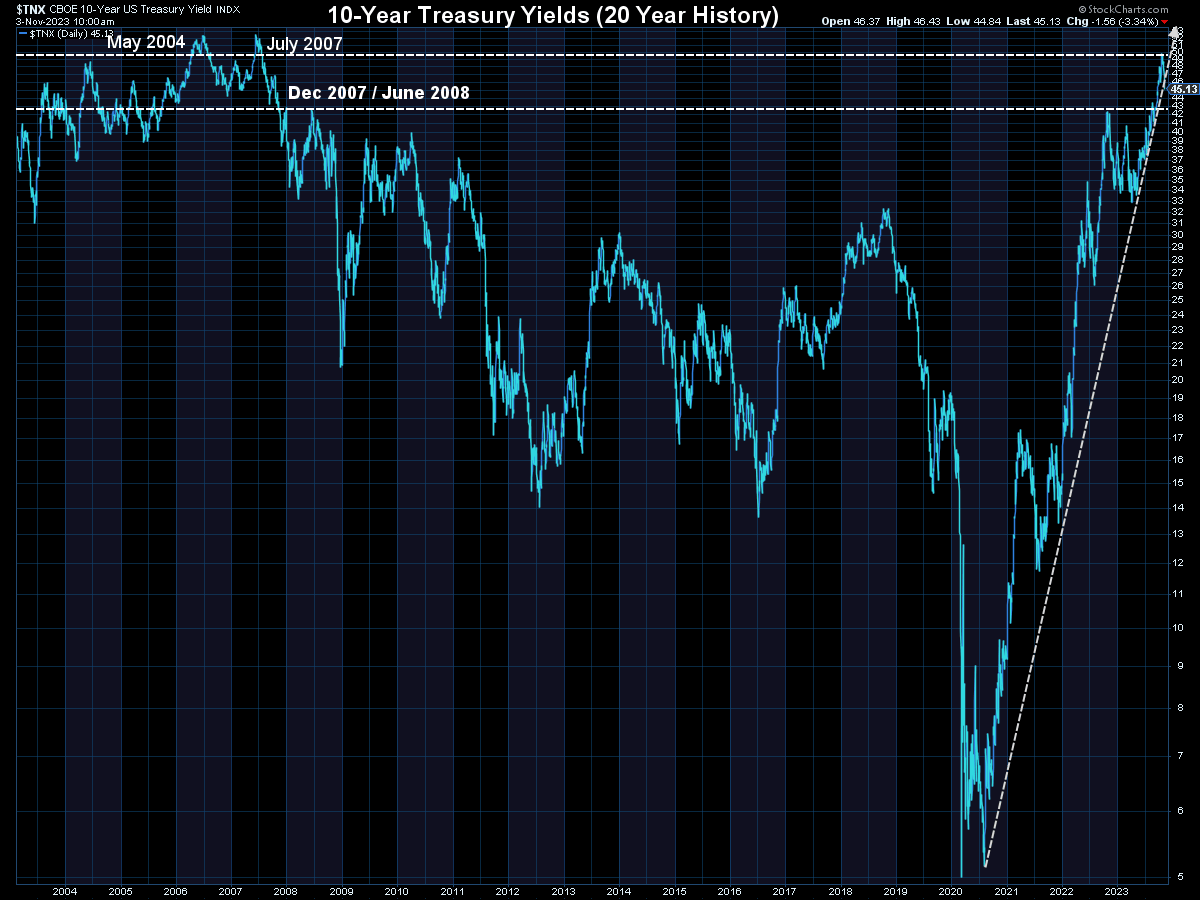
Subjectively, I like this positioning. Logically, short-term the thing which could cause interest rates to spike higher is an uptrend in the pace of inflation. Based on our economic model and anecdotal evidence, economic growth is slowing and thus inflationary pressure should be easing. This means that Treasury bonds should return to their role as a buffer during a bear market/recession. If rates come down, the potential returns in Treasury Bonds are significant.
Speaking of Bonds
Here is what I love about SEM and most people miss because they are used to most investment managers following the same investment strategies from top to bottom – one system/strategy could get 'bearish' the same week another gets 'bullish'. The current perception from the markets is the Fed is 'done', which means we won't have a recession, which means the sky is the limit for anything that is considered risky.
While I think that perception is wrong, here is what else I love about SEM – our decisions are not based on anyone's opinions, including our own. If a well-tested system generates a buy signal we buy. This is what happened on Friday in our high yield bond trend following models inside of Tactical Bond, Income Allocator, and Cornerstone Bond.
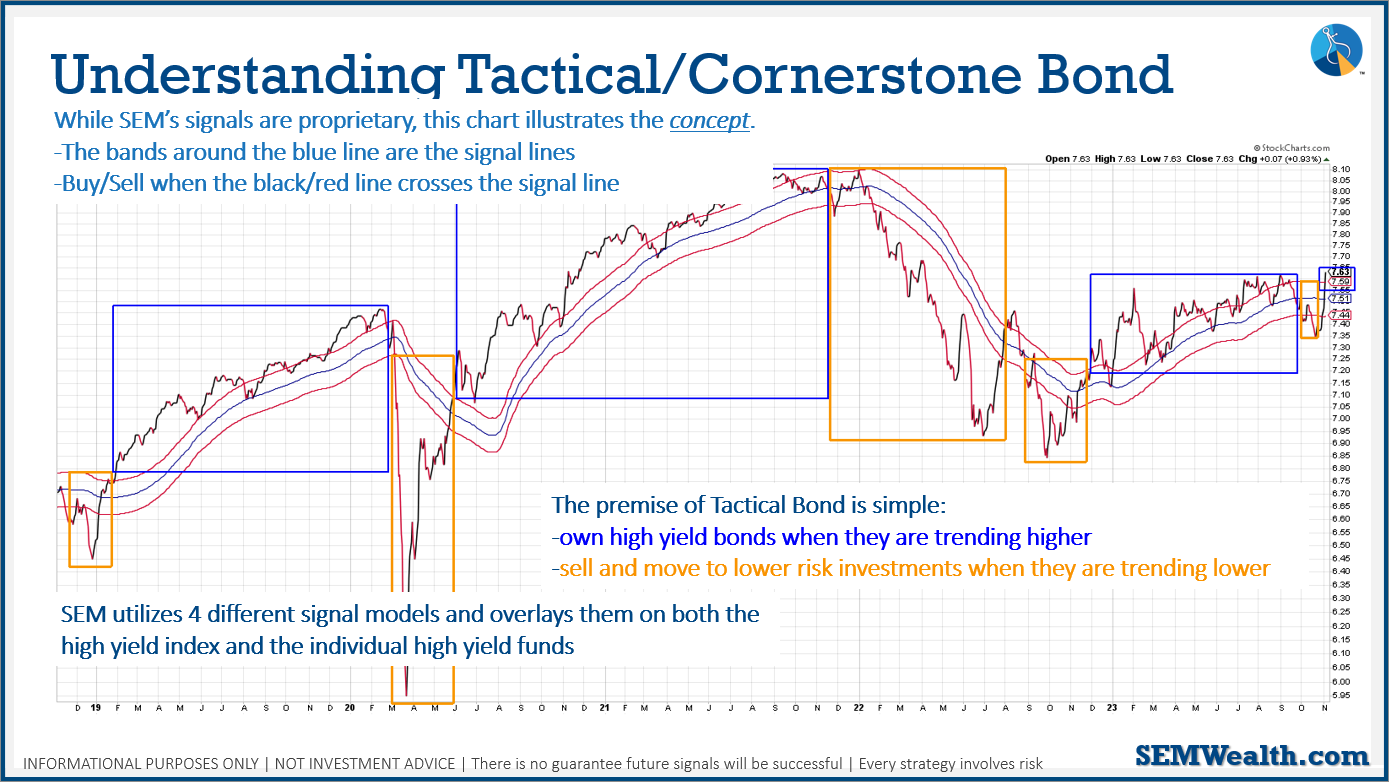
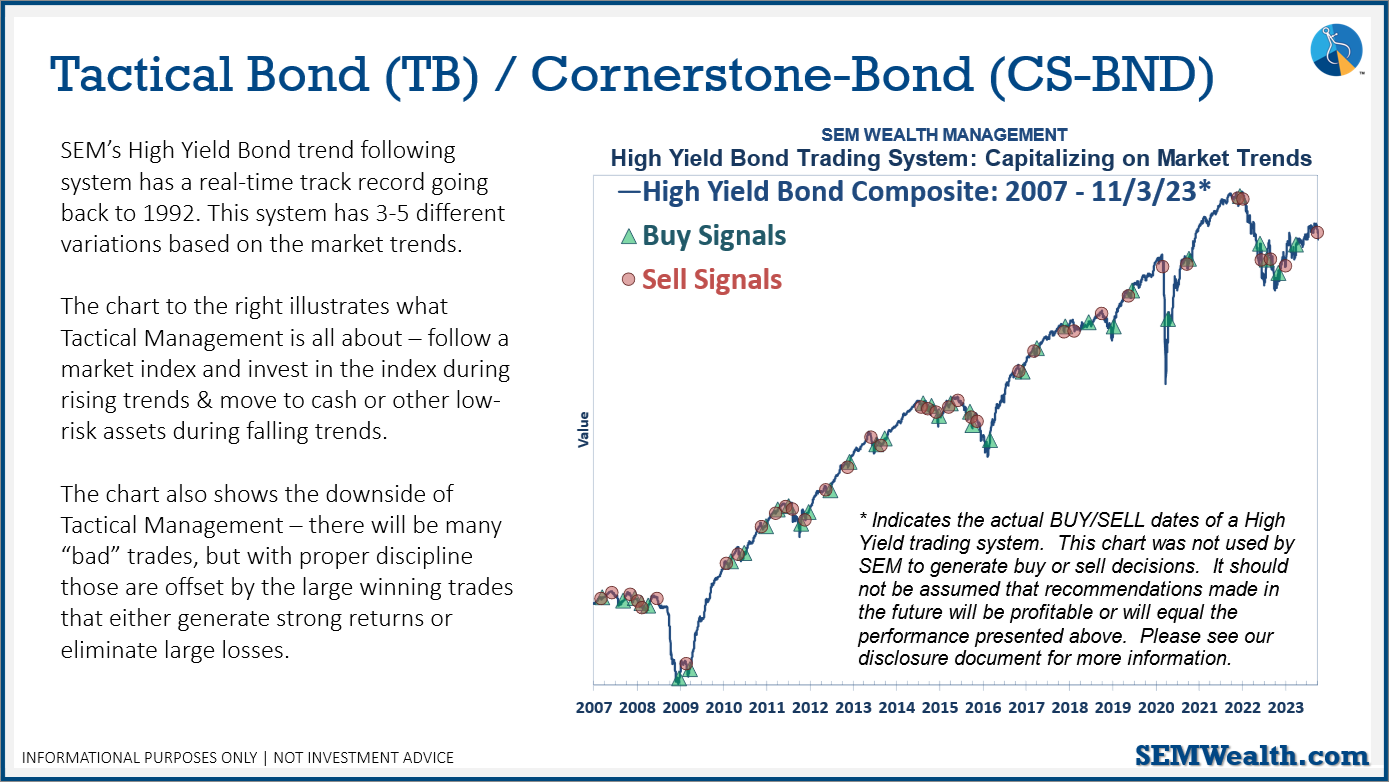
I like to use this chart to illustrate the concept of high yield bond. Basically, we are monitoring the trend of the overall high yield (junk) bond market. We use 'bands' to allow for some volatility with the goal of holding on for the big uptrends (when returns are often comparable to the stock market) and avoiding the large downtrends (when losses are comparable to the stock market).
Sometimes something causes the market to reverse quickly (such as the assumption the Fed is 'done' raising rates which means no more economic pressure. While I think that is the wrong assumption (and our economic model agrees), when the model says to buy we buy.
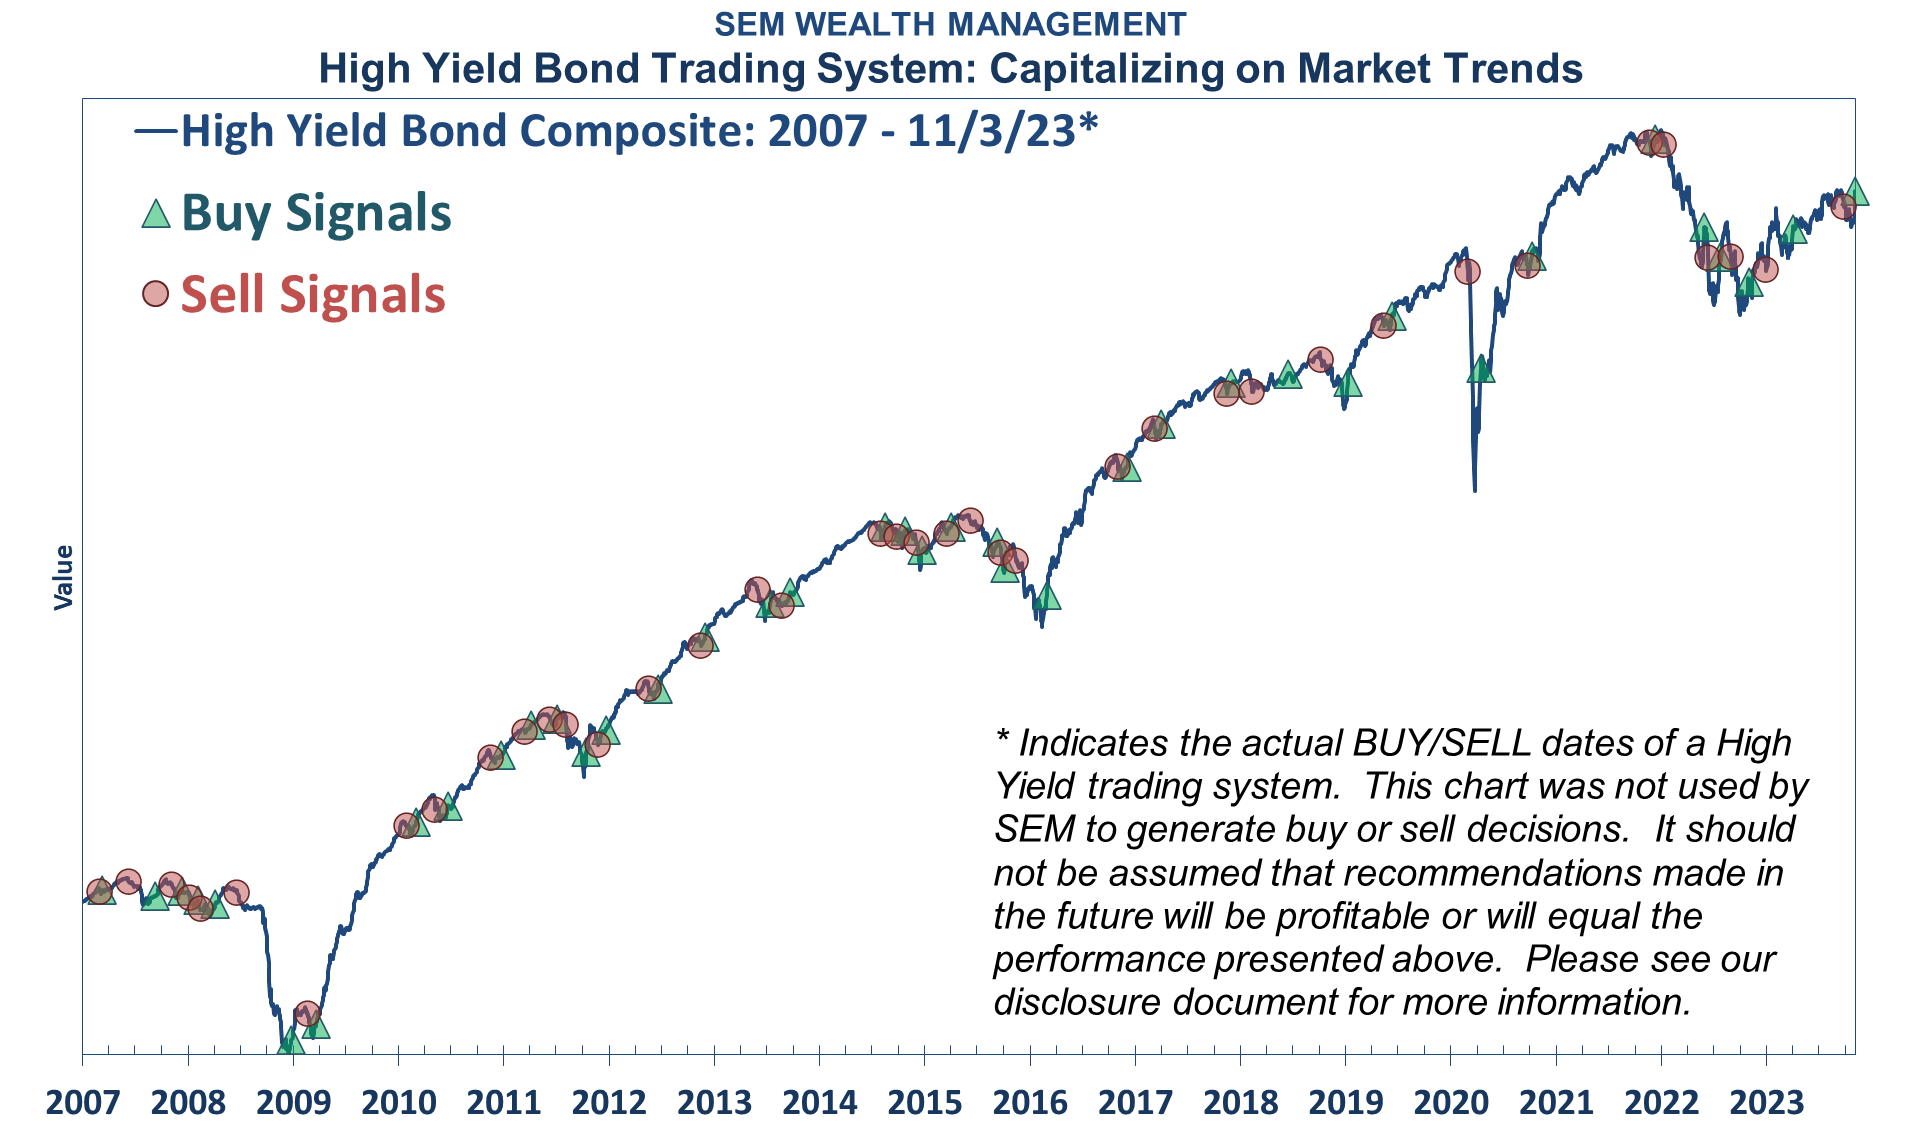
We've used this chart for over 25 years to point out two things:
1.) Tactical Bond has historically done an exceptional job capturing the major uptrends and missing the major downtrends.
2.) There will be times where the market 'whipsaws' our system and with hindsight you could say "why make any trades at all"?
The answer to question #2 is easy – because we never know which trade will turn into point #1.
We are on quite a few "platforms" where we do not have relationships with the end advisor or client. While we never like to sell performance, these platforms do allow us to compare our performance to others. I challenge anybody to find a low risk, fixed income model, with a longer real-time track record and the type of return/risk ratios we've experienced with Tactical Bond. There are some who at times may have better numbers short-term, but the longevity and consistency of Tactical Bond makes this a valuable core component for most portfolios.
Market Charts
We already posted several bond charts above, so let's take a quick look at the stock market short and longer-term charts.
The big rally last week fueled by the Fed's no decision was impressive. The big question is whether or not it brings in money off the sidelines or if it is used as an excuse to take more risk off the table.
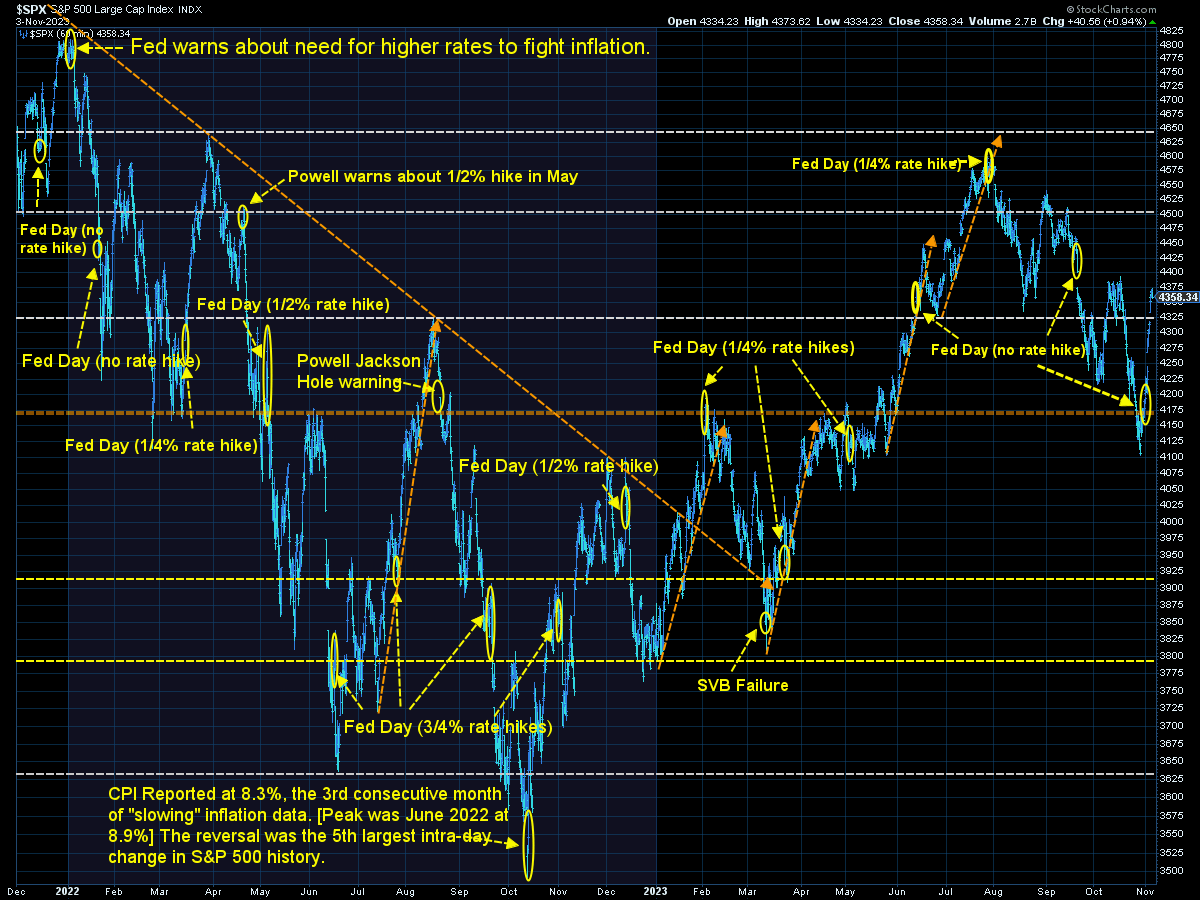
The "Head & Shoulders" pattern we've been discussing is back into play, with the breakdown point around 4400 the key pivot point. Often times after a big breakdown the market will return to that point. More often than not it is used as a selling opportunity for everyone who wished they'd sold last time it was there.
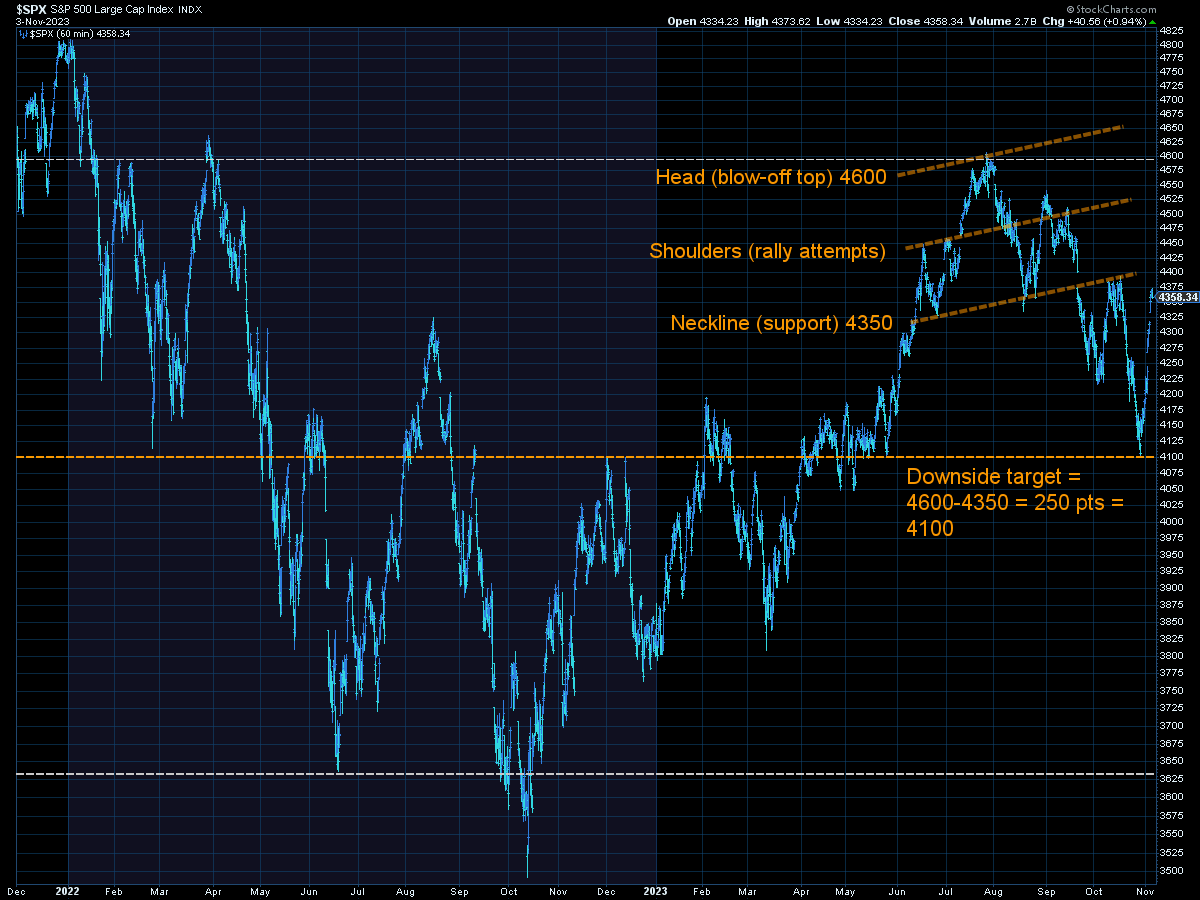
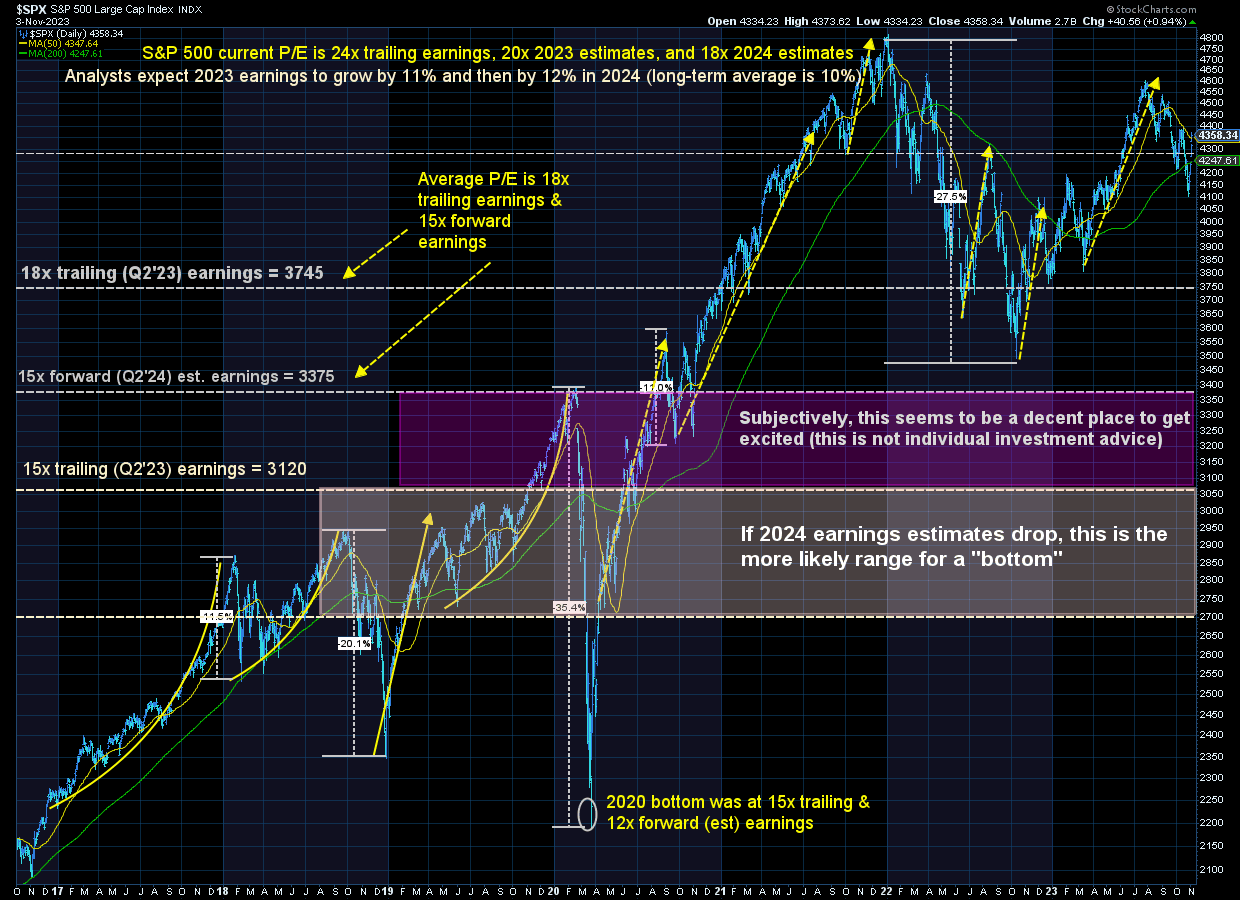
Taking a step back, stocks still remain significantly overvalued. With bond yields still above 4.5% on the 10-year and over 5% short-term along with slowing growth, it is very difficult to argue stocks are at an attractive entry point.
SEM Model Positioning
[big changes last week, all discussed above. Summary positions listed below]
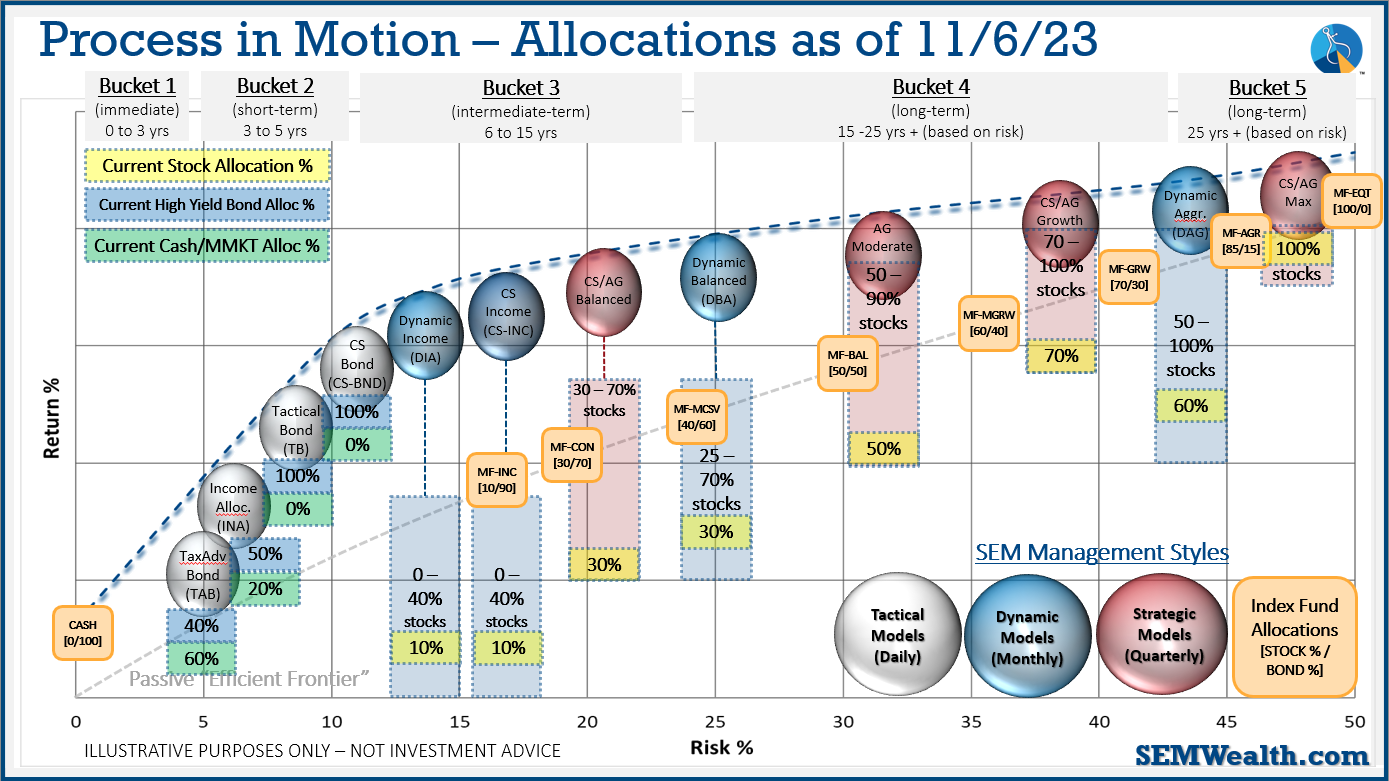
SEM deploys 3 distinct approaches – Tactical, Dynamic, and Strategic. These systems have been described as 'daily, monthly, quarterly' given how often they may make adjustments. Here is where they each stand.
Tactical (daily): The High Yield Bond system bought the beginning of April and issued all 3 sell signals 9/28/2023. All 3 systems were back on buy signals by the close on 11/3/2023. The bond funds we are invested in are a bit more 'conservative' than the overall index, but still yielding between 7.5 -8.5% annually.
Dynamic (monthly): At the beginning of October the model moved slightly off the "bearish" signal we've had since April 2022. This means a small position in dividend stocks (Dynamic Income) and small cap stocks (Dynamic Aggressive Growth). Other than that, the models remain 'bearish' and is closer to going back to fully 'bearish' than it is to moving to 'neutral'.
Strategic (quarterly)*:
BOTH Trend Systems sold the week of 10/30/2023.
The core rotation is adjusted quarterly. On August 17 it rotated out of mid-cap growth and into small cap value. It also sold some large cap value to buy some large cap blend and growth. The large cap purchases were in actively managed funds with more diversification than the S&P 500 (banking on the market broadening out beyond the top 5-10 stocks.) With the trend system sells on 10/30/23, large cap growth and large cap blend were reduced, creating more of a balanced portfolio between small-mid-large cap.
The * in quarterly is for the trend models. These models are watched daily but they trade infrequently based on readings of where each believe we are in the cycle. The second indicator triggered on August 16, brining the strategic models to a fully invested position. We are NOT locked into these for the next quarter. The 'sell-point' for this system is down around 3-4% from here.
Overall, this is how our various models stock up: