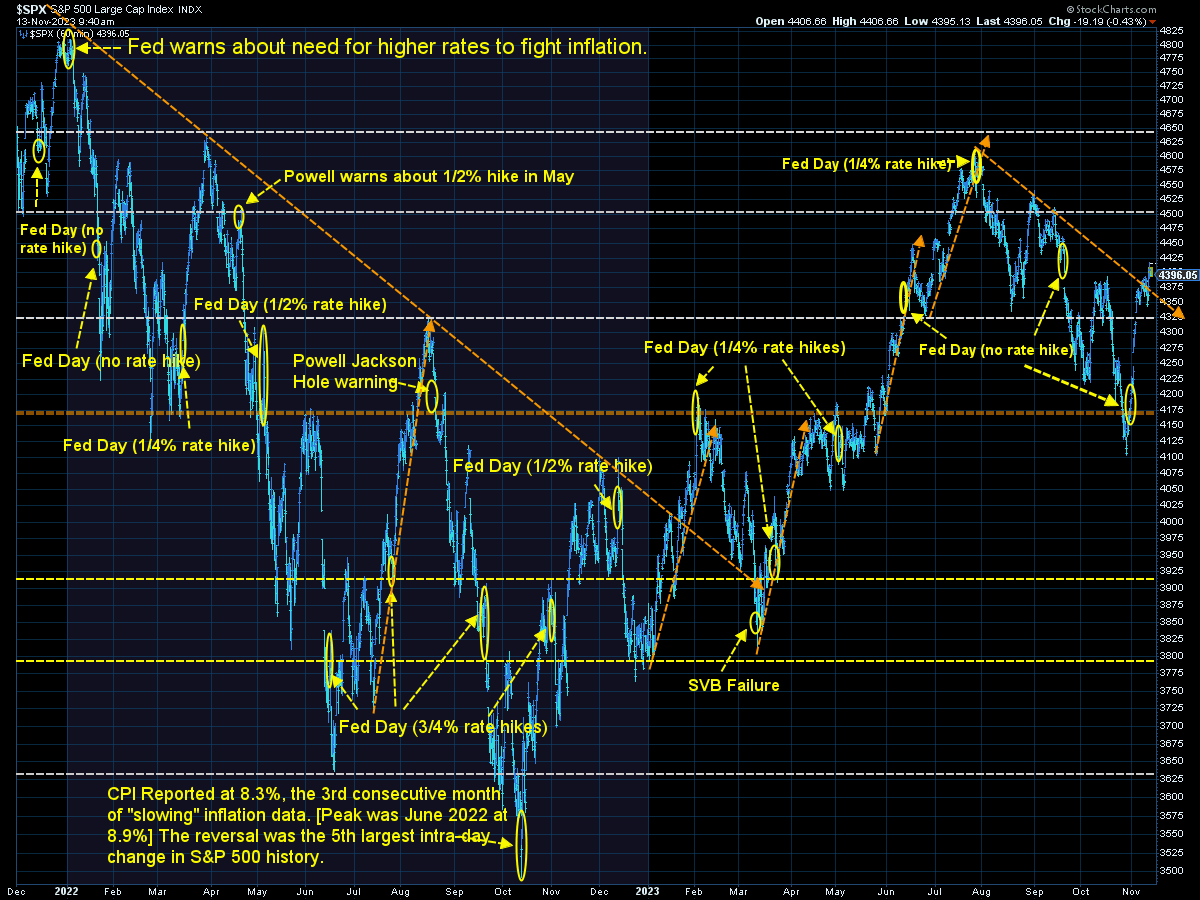
Despite a weak earnings season where growth rates slowed for the 3rd consecutive quarter and CEOs warned about an even bigger slowdown, stocks have staged an impressive rally the past two weeks. The rally has been driven with the hope the Federal Reserve is not only done raising rates but will be cutting rates next year. Apparently, those buying stocks on this hope forget the Fed doesn't cut interest rates until we are heading towards or already in a recession. That would be bad news for stocks, but the market always seems to be surprised when that happens.
This rally in the mega-cap stocks has pulled the "market" higher, which is hiding some big underlying weakness in the average stock. That is usually bad news for the intermediate-term.
Here's something to keep in mind – the reason S&P 500 or any 'market cap weighted' index fund is "cheap" and "tax efficient" is those funds NEVER rebalance back to a target. This means when bubbles form the index will participate in both the both the mania and the inevitable bursting of the bubble.
The way I like to think of it is this – investment advisors are fiduciaries of their clients assets. Imagine you are managing money for an endowment and had to defend your asset allocation in front of the board every quarter. If you said, "we have 25% of your assets in 7 technology stocks." You would be fired on the spot.
If you're invested in a 'low cost' and 'tax efficient' index fund tracking the S&P 500 or "Total Stock Market" index, that's exactly what you are doing. I like looking at this chart to illustrate the returns of the various Morningstar Style Boxes (Large-Mid-Small-Value-Blend-Growth). I drew a line across the Mid-Cap Blend which is the mid-point of the actual TOTAL stock market (not the index fund). Over the last 10 years it has been below the mid-point 4 times and the exact mid-point twice.
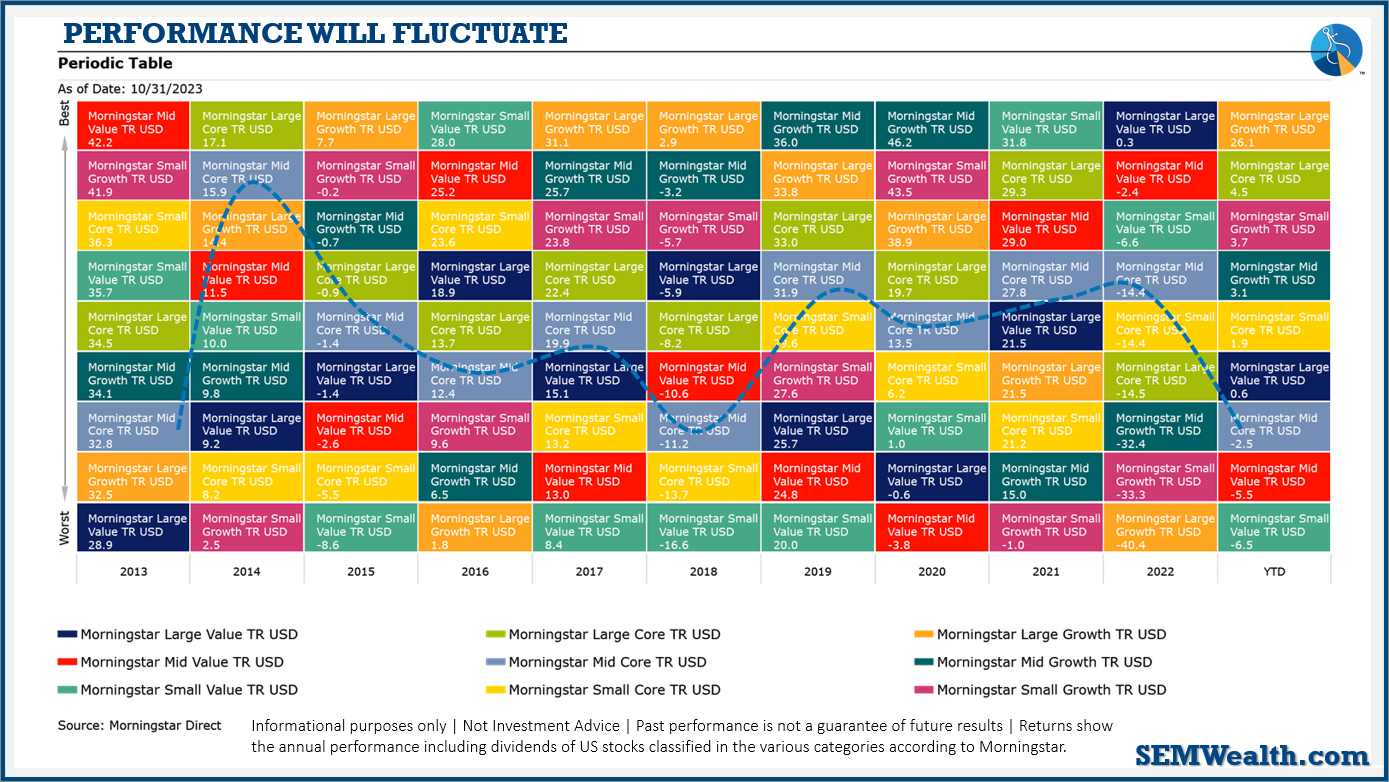
While it appears "Large Cap Growth" is the "best" place to be, that is a more recent phenomenon.
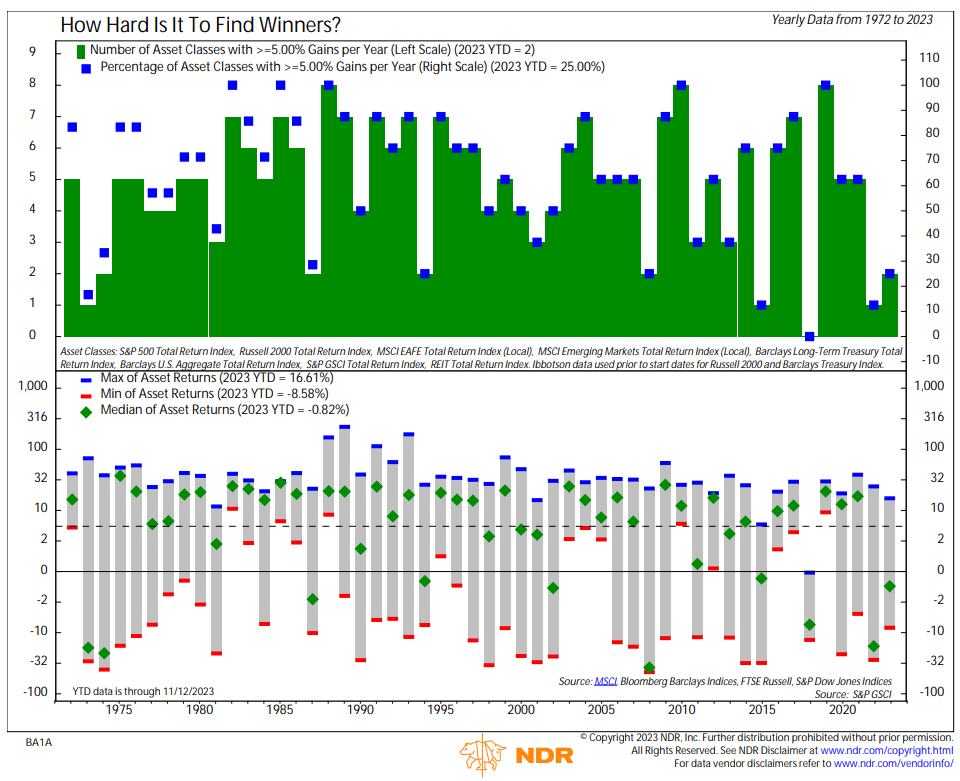
Even more interesting, this chart from Ned Davis Research illustrates how the handful of mega-cap growth stocks has skewed the returns of the S&P 500. This is the just 10th time since 1970 where there were more asset classes negative than positive.
As fiduciaries and students of market history we know markets will fluctuate and there will be times where mania's catch hold. During these times any sort of diversification hurts, but over the long run a disciplined strategy has proven to smooth returns which allows investors to have a much better long-term experience.
Speaking of students of history. This week I'll be teaching a group of Finance students at Liberty University. The topic this week is 'risk measurement & performance evaluation'. One of the things I try to bring when I do this is the real-world application of text book concepts. The 'art' behind our science is determining what data to use when creating future forecasts as well as when measuring investment performance and risk.
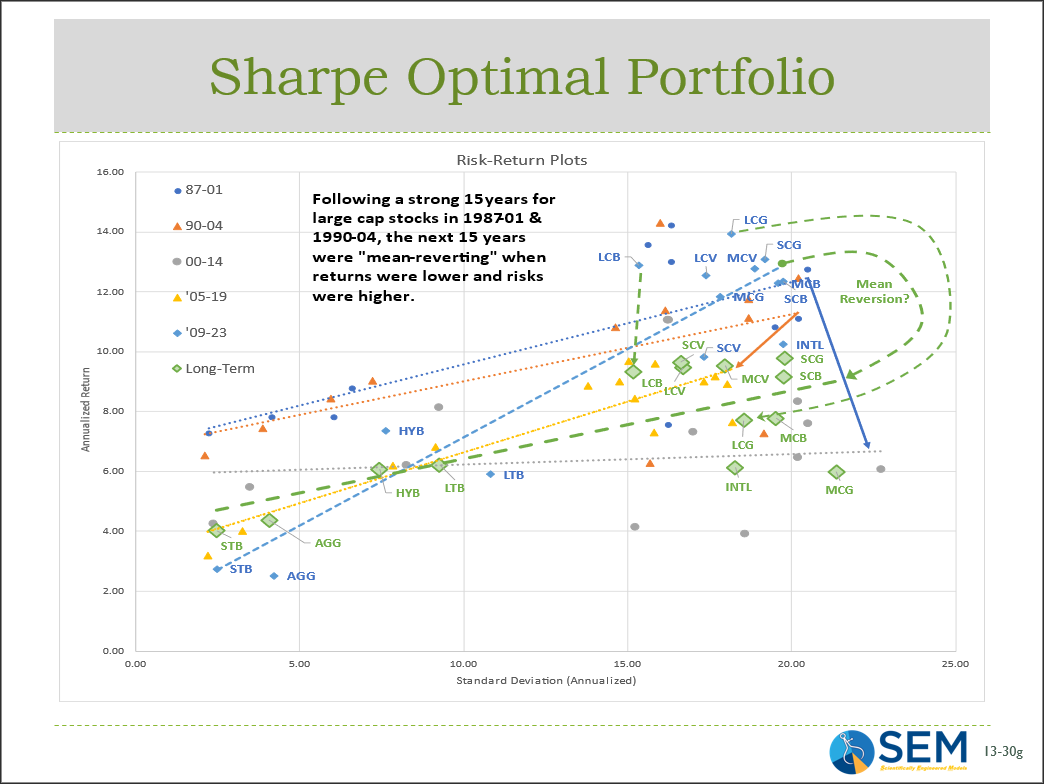
While I don't have time to go over the hour and a half lecture, here's my ending slide in asking the question – what time period do you use when evaluating portfolios and creating new ones? What we've seen throughout history is periods of above average returns are typically met with periods of below average returns. The last 15 years have been extremely strong for large cap growth stocks and weaker for nearly every other category. Does risk management and portfolio allocation not matter any more or are we about to enter a 15-year period where the 'best' asset classes turn into the 'worst'?
This slide shows the return and risks of the main asset classes over various periods going back to 1987. The green line is the long-term average. The sharp upward sloping line is the last 15 years where bond returns were very low and large cap stock returns were very high. Is it different time? Probably not.
Market Charts
On the short-term chart, the outlook depends on how you look at it. On the positive side the downtrend started in early-August appears to be broken.
On the negative side, the rally has simply taken the S&P 500 back to the 'shoulders' of the 'head & shoulders' pattern I've been tracking. While we hit the downside target around 4100, it is typical for the market to rally back to the breakdown point before reversing lower again.
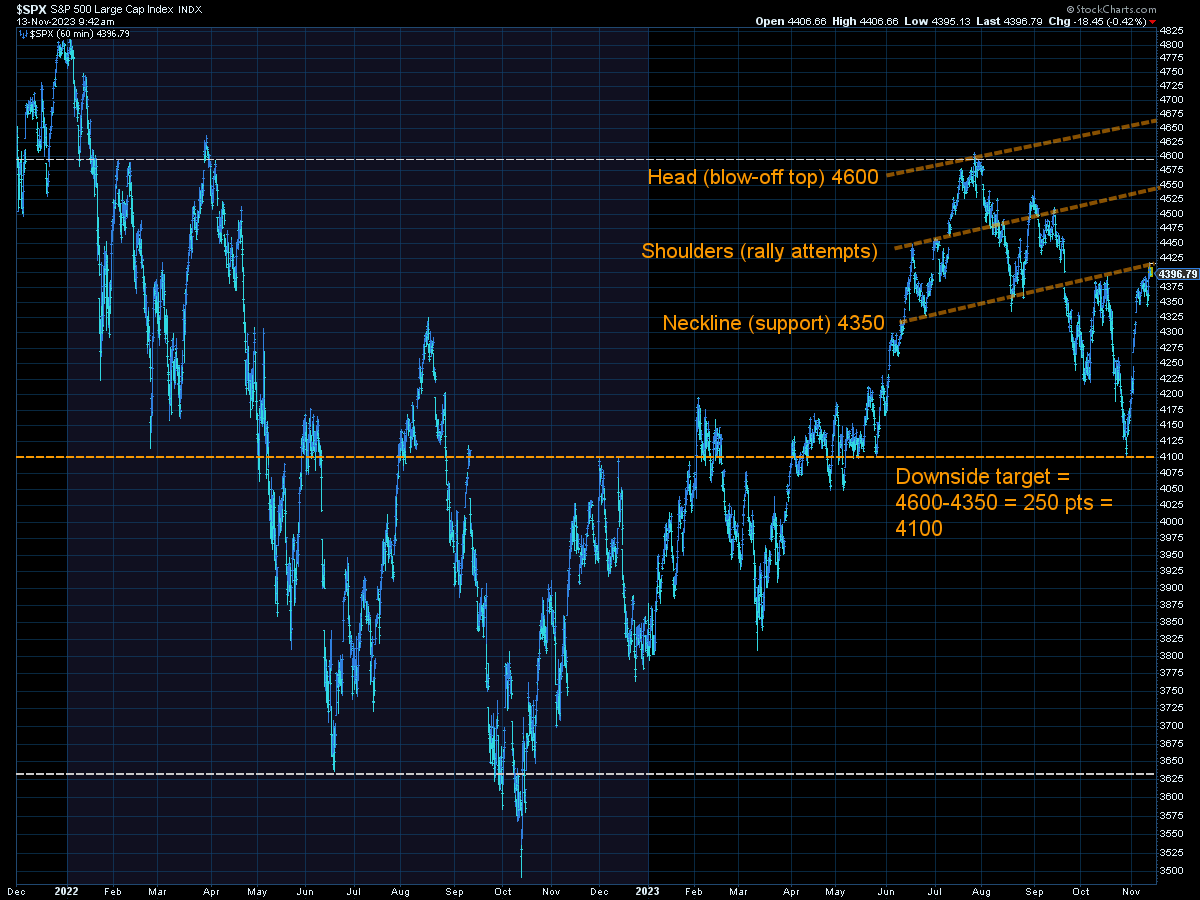
4400 is likely to be a round number pivot point where a strong move above could bring out buyers and the inability to hold could bring out sellers.
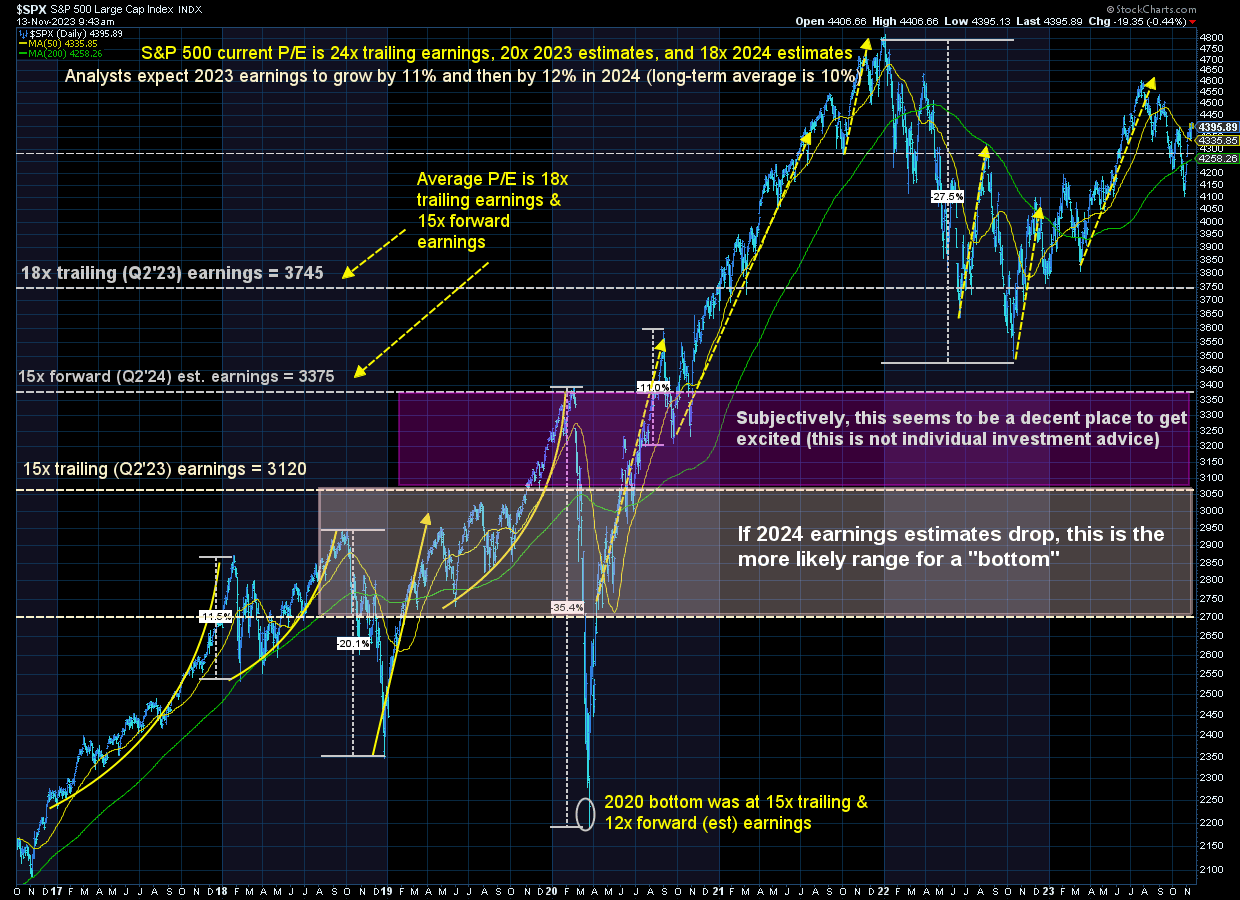
Longer-term, it's hard to be excited about stocks until we get a big correction.
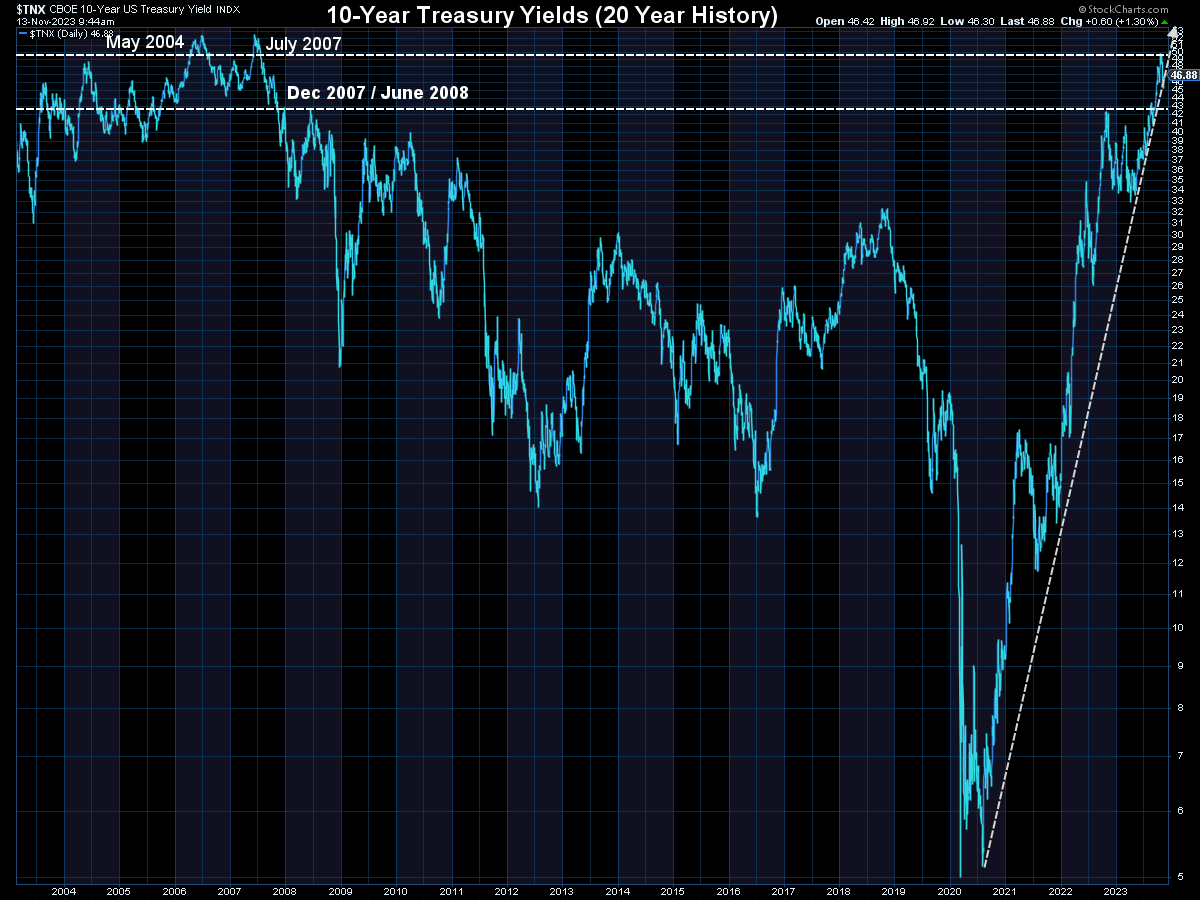
The more important charts are in the bond market. The stock market rallied on the drop in interest rates. Like the stock market they have gone back up to the "breakdown" point, which is normal. 4.7% on the 10-year appears to be the "pivot" where bigger moves could occur above and below that number.
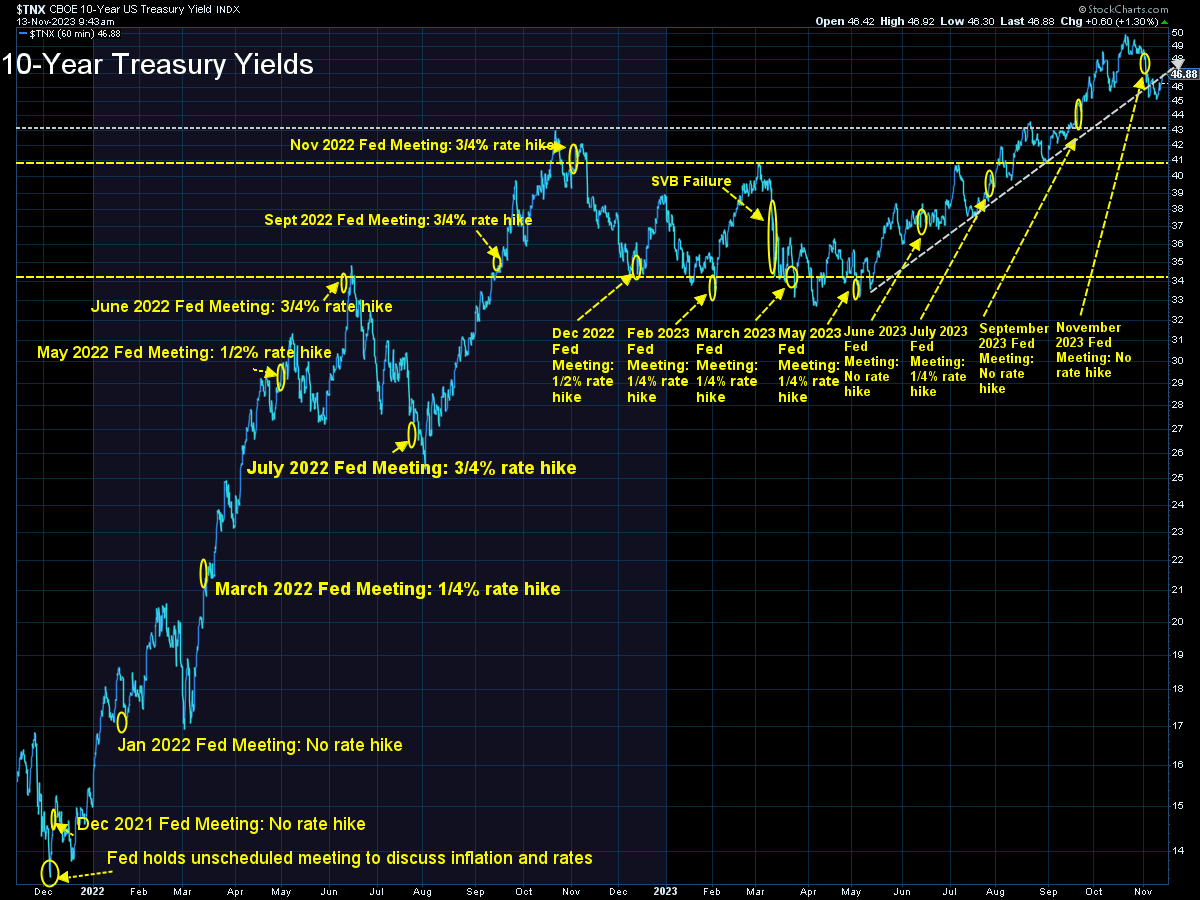
Longer-term, the very big uptrend appears to be in place (barely). Subjectively I believe if our economic model is right about the slowdown in the economy, inflation should slow and bond yields should (temporarily) move lower. This will also eventually be bad news for stocks.
Tuesday we get the latest CPI data. As sensitive as everyone seems to be to interest rates a stronger than expected reading could push yields higher by a large margin and drive stocks lower. Conversely, if we get a surprisingly weak number we could see a resumption of the 2 week rally as we head into the seasonally strong Thanksgiving week.
SEM Model Positioning
[there were several shifts the week of 10/30 - click here for the details]
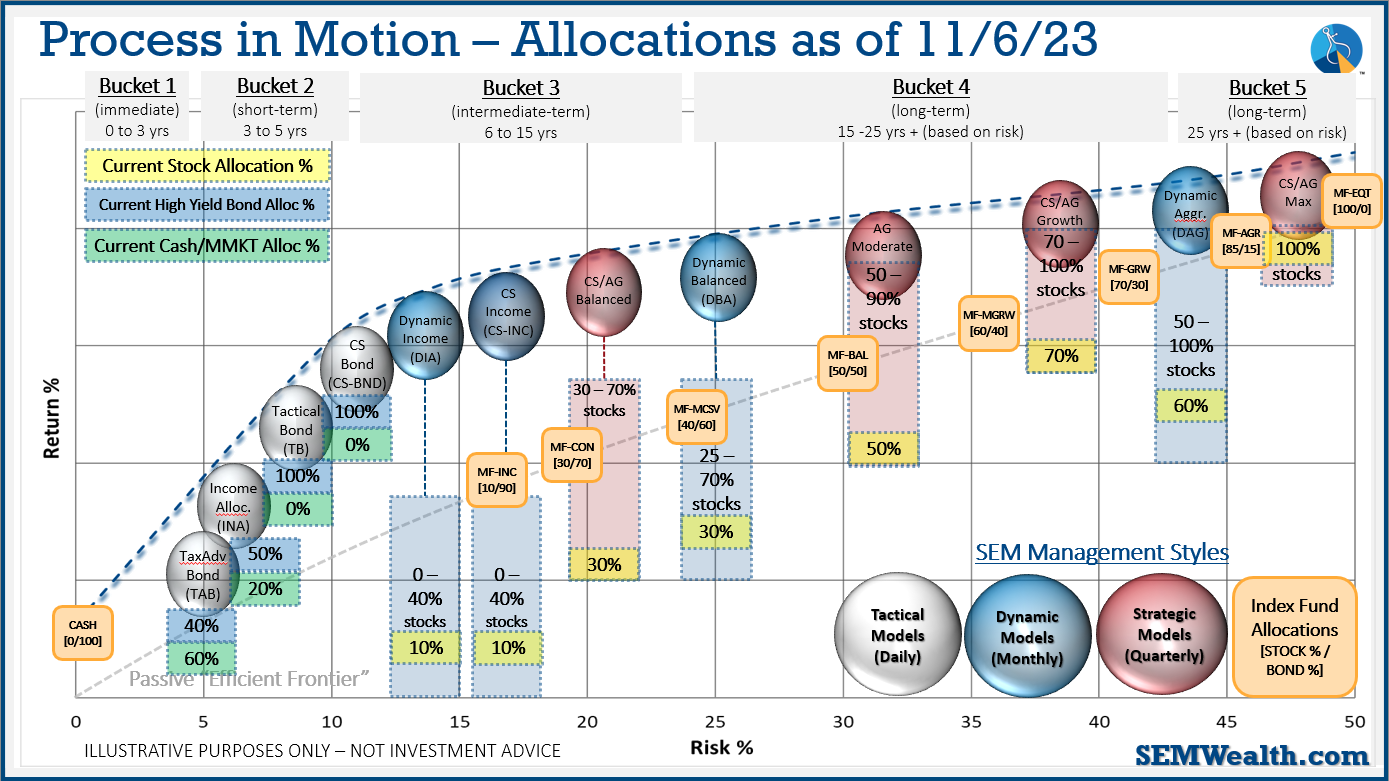
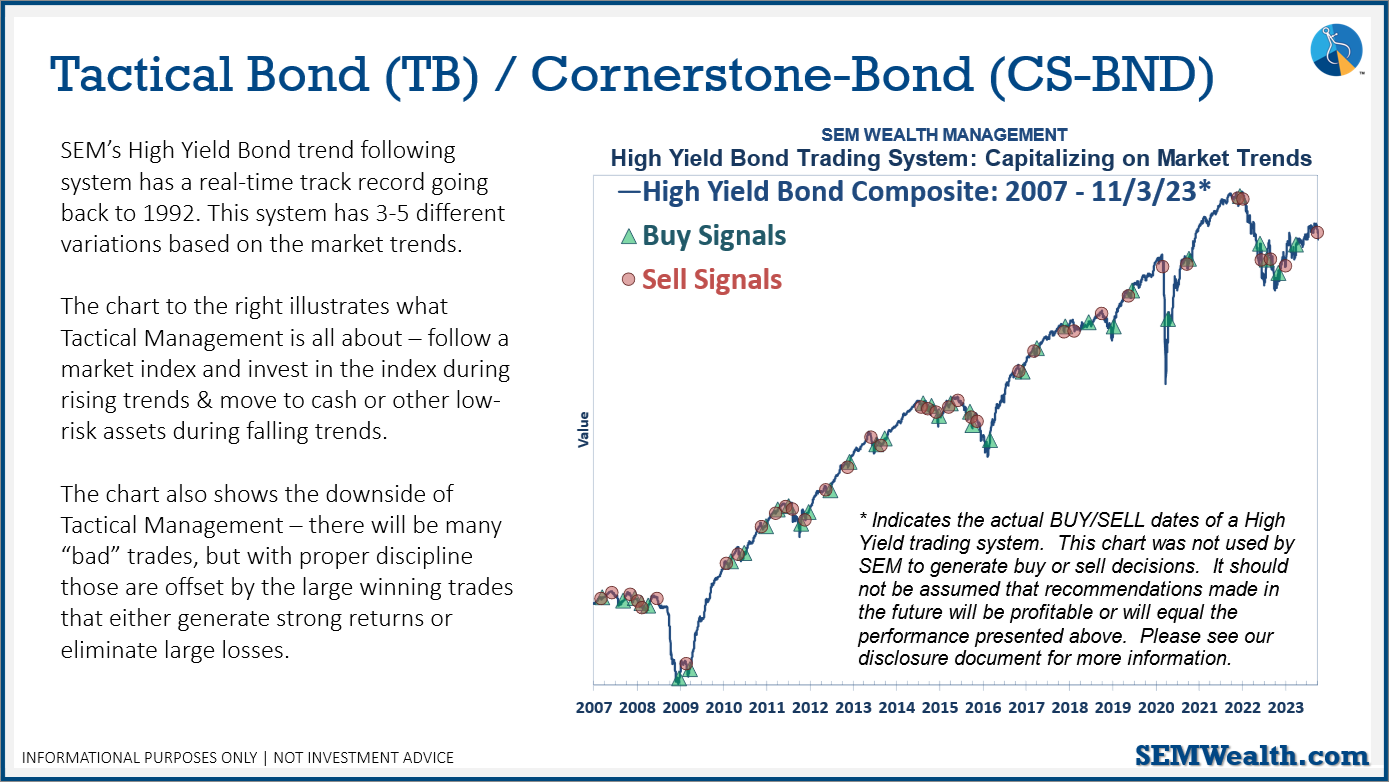
SEM deploys 3 distinct approaches – Tactical, Dynamic, and Strategic. These systems have been described as 'daily, monthly, quarterly' given how often they may make adjustments. Here is where they each stand.
Tactical (daily): The High Yield Bond system bought the beginning of April and issued all 3 sell signals 9/28/2023. All 3 systems were back on buy signals by the close on 11/3/2023. The bond funds we are invested in are a bit more 'conservative' than the overall index, but still yielding between 7.5 -8.5% annually.
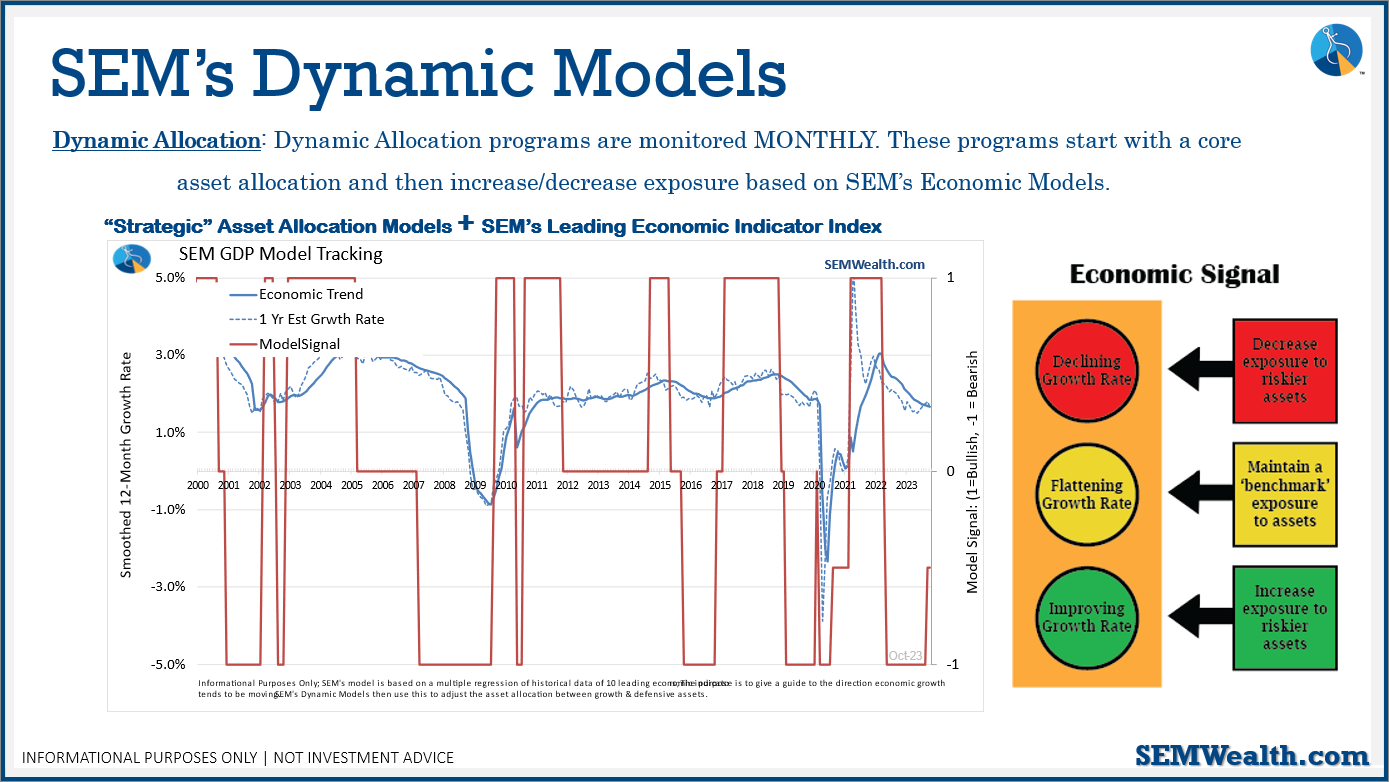
Dynamic (monthly): At the beginning of October the model moved slightly off the "bearish" signal we've had since April 2022. This means a small position in dividend stocks (Dynamic Income) and small cap stocks (Dynamic Aggressive Growth). Other than that, the models remain 'bearish' and is closer to going back to fully 'bearish' than it is to moving to 'neutral'.
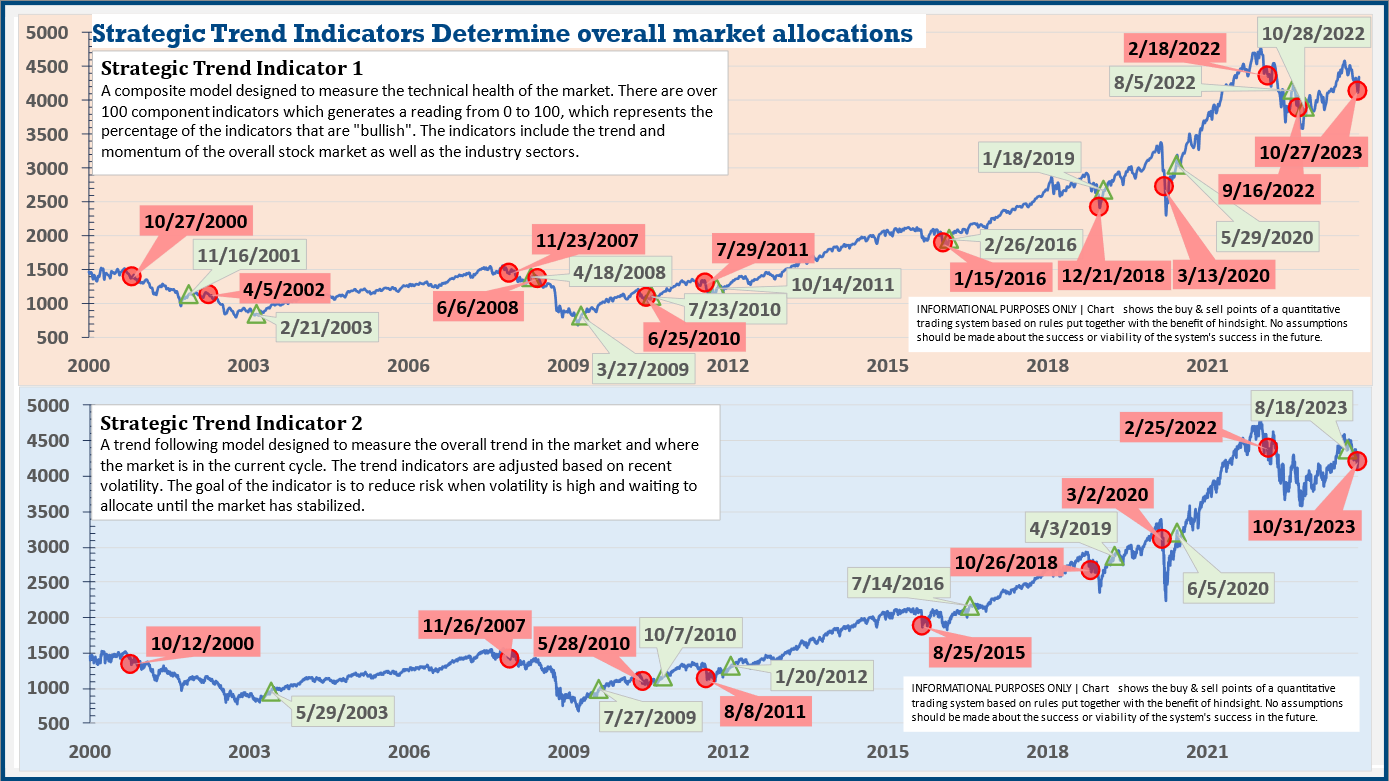
Strategic (quarterly)*:
BOTH Trend Systems sold the week of 10/30/2023.
The core rotation is adjusted quarterly. On August 17 it rotated out of mid-cap growth and into small cap value. It also sold some large cap value to buy some large cap blend and growth. The large cap purchases were in actively managed funds with more diversification than the S&P 500 (banking on the market broadening out beyond the top 5-10 stocks.) With the trend system sells on 10/30/23, large cap growth and large cap blend were reduced, creating more of a balanced portfolio between small-mid-large cap.
The * in quarterly is for the trend models. These models are watched daily but they trade infrequently based on readings of where each believe we are in the cycle. The second indicator triggered on August 16, brining the strategic models to a fully invested position. We are NOT locked into these for the next quarter. The 'sell-point' for this system is down around 3-4% from here.
Overall, this is how our various models stock up: