One of the most difficult things to understand about the investment markets is the response to various events is not always logical. If I had told you a few months ago that Israel was going to be attacked by Hamas sparking a declaration of war which included the US military moving assets to the region AND launching missile attacks, we would logically think the stock market would take a hit and oil prices would skyrocket.
Instead, 6 weeks after the horrific attacks, the S&P 500 is UP 5% and oil prices are DOWN 5%.
There are plenty of examples of the markets not responding logically, including the failure of 3 banks which wiped out over 20% of the FDIC insurance fund sparking an 18% rally in the stock market (as we witnessed this spring).
At the core any investment market is a "forward looking mechanism". What this means is the current value of any investment is the (perceived) value of all future earnings discounted back to today. To get to this value you are forced to predict all the future things which could change and assess what that does to the current price.
I mentioned a few times that I've been a guest lecturer at Liberty University in their 400 level investments class. The professor and a fellow advisor with a CFA charter says often, "our clients' perception is our reality". What he means is it doesn't matter if we are logically "right", we need to be able to adapt.
I add on by saying – "perception is reality, for short periods of time, but over the long-run fundamentals do matter and it is our job as financial advisors to be the 'adult' in the room and make sure short-term emotions are not impacting long-term results."
With that said, here is the "perception" of the markets right now:
- Inflation is 'dead', meaning interest rates are coming down
- We won't have a recession any time soon
- Congress will always (eventually) fund our deficit
- We can borrow as much money as we want with no consequences
- The banking system is healthy
- China wants to be our friend
The above is a summary of comments made by Wall Street banks over the past month justifying not just the current rally, but arguing for an even stronger 2024. This 'reality' could most certainly drive stocks higher. From a short-term basis we are seeing some positives:
- The rally has broadened out (small caps & 'value' stocks are outperforming mega-cap growth stocks)
- The drop in 10-year interest rates takes some of the (short-term) pressure off companies and consumers
- We won't be talking about a government shutdown again until January
Over the more intermediate-term the data, history, and logic tells us the current perception could be dangerous, but we are happy to let the short-term enthusiasm continue. I'll try to not throw any cold water on the excitement on this shortened Thanksgiving week, but I did want to highlight a few charts from last week's Consumer Price Index (CPI) release.
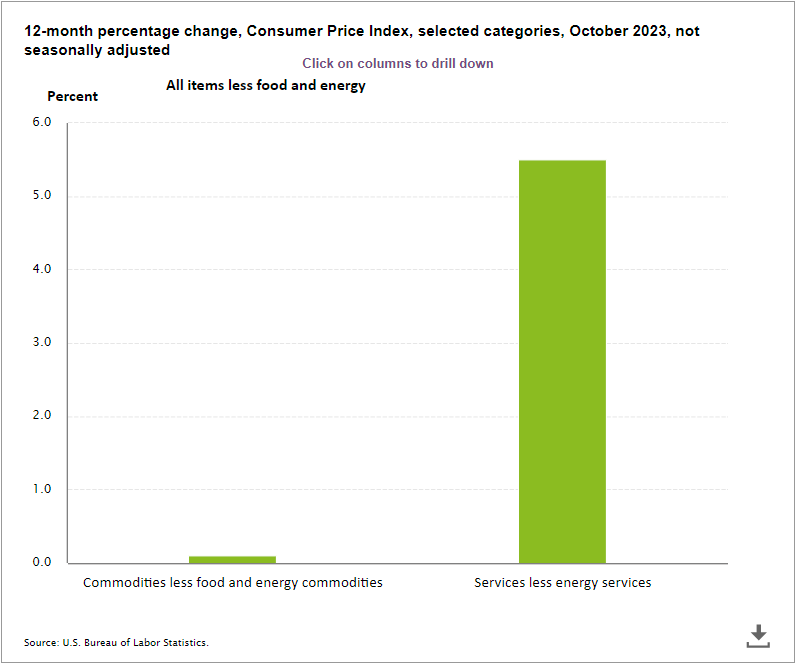
Everyone got excited about a "decline" in inflation. I find it interesting how the focus shifts from the "excluding food and energy" number to the overall number.
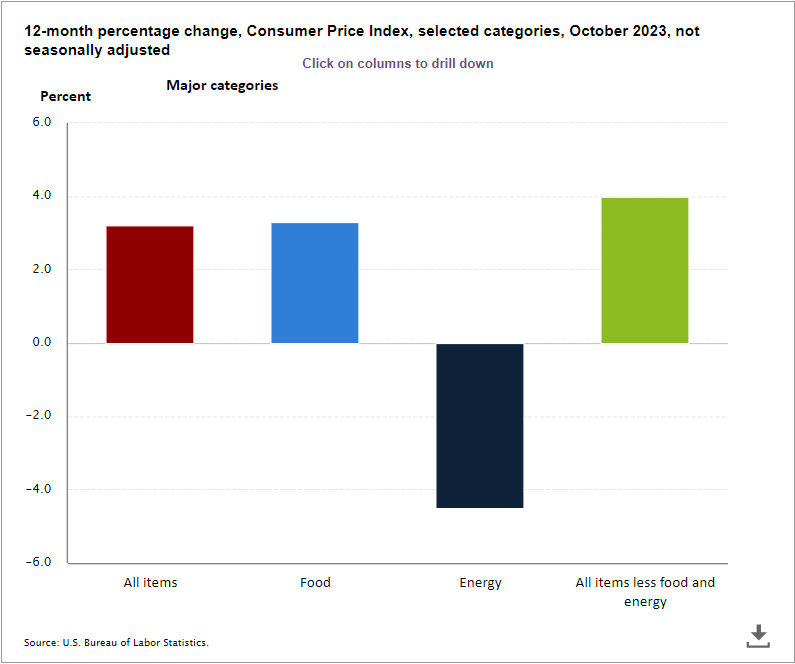
How many people actually are talking about the drop in energy prices? I think most people "perceive" energy prices are still going up, which helps explain the negative consumer sentiment. Service inflation continues to be quite high. If that continues and energy prices go back up that would be obviously bad for many of the "perceptions" in the markets right now.
Market Charts
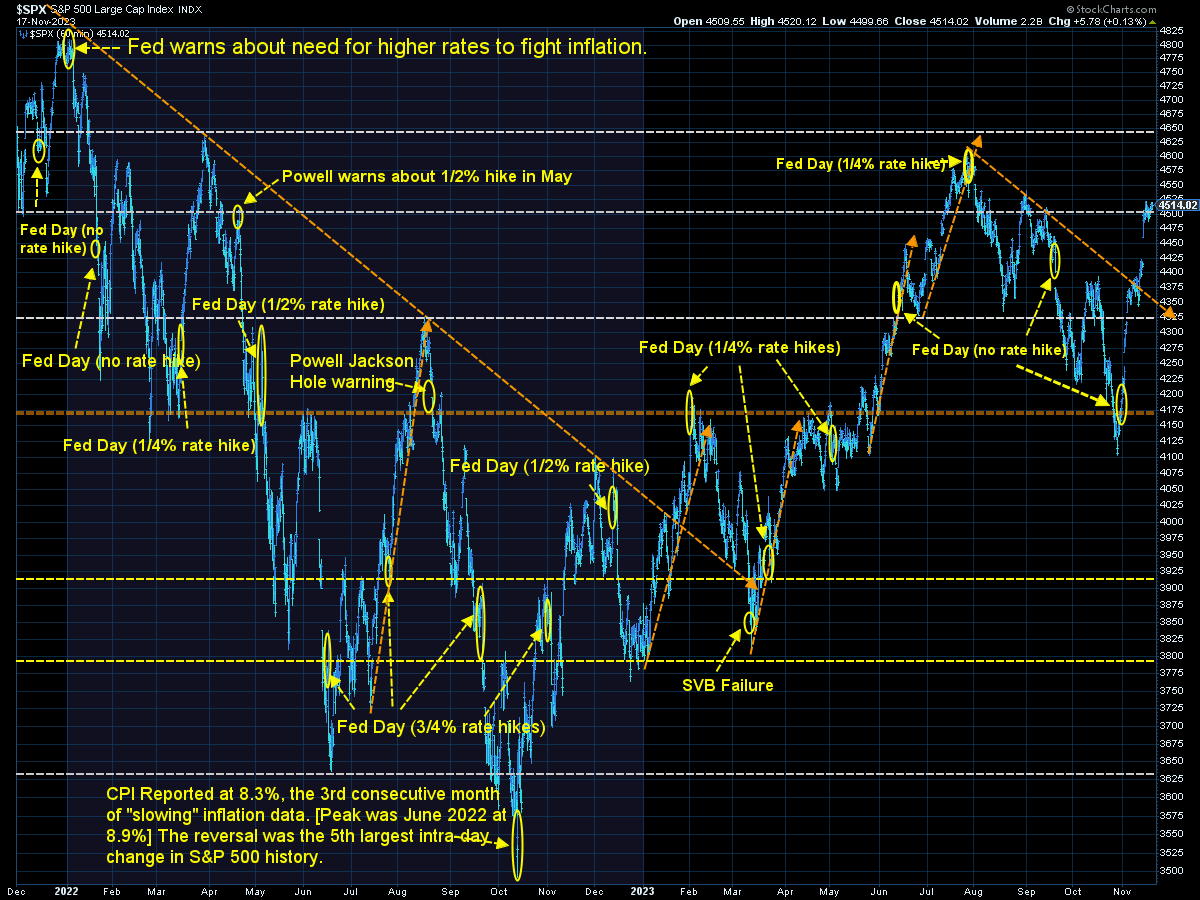
In last week's blog I mentioned a "pivot" around 4400 on the S&P which could lead to strong buyers if above and sellers below. We saw that and then some on Tuesday following the inflation report.
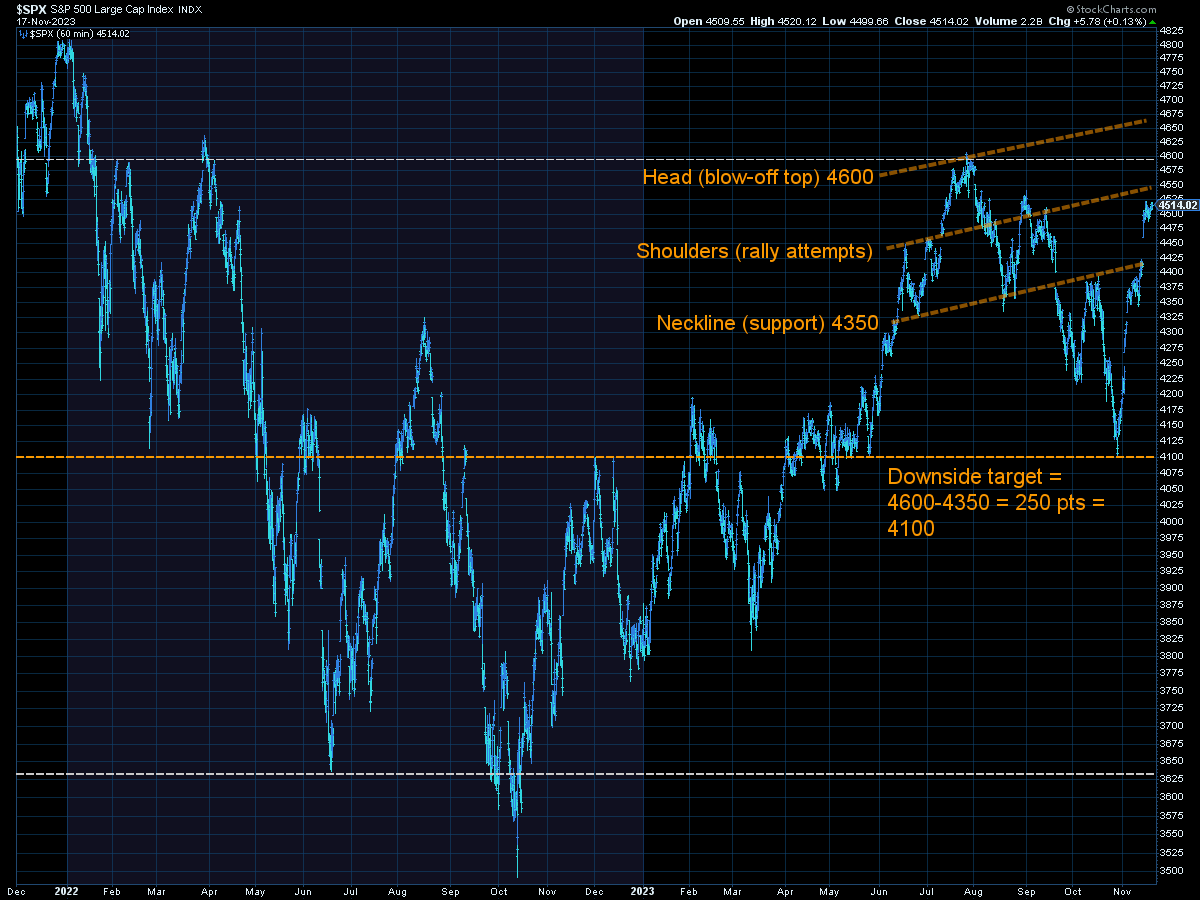
Now we are near another 'pivot'. It would be a positive if the market could hold these levels. On a chart those large gaps from the prior close to the next day's open are weak spots. The longer we can stay above the 'gap' the more likely we are to stay positive until some other event causes the market to change directions.
Longer-term I continue to use this chart to set expectations. Unless we see a shift higher in the POTENTIAL growth rate of the economy, stocks are significantly overvalued which means our long-term (10-year) expectations for stock market returns are BELOW average. The long-term average return for stocks is 10%. You get better returns when you start with below average valuations and lower returns when you start at above average valuations. (Buy low, sell high)
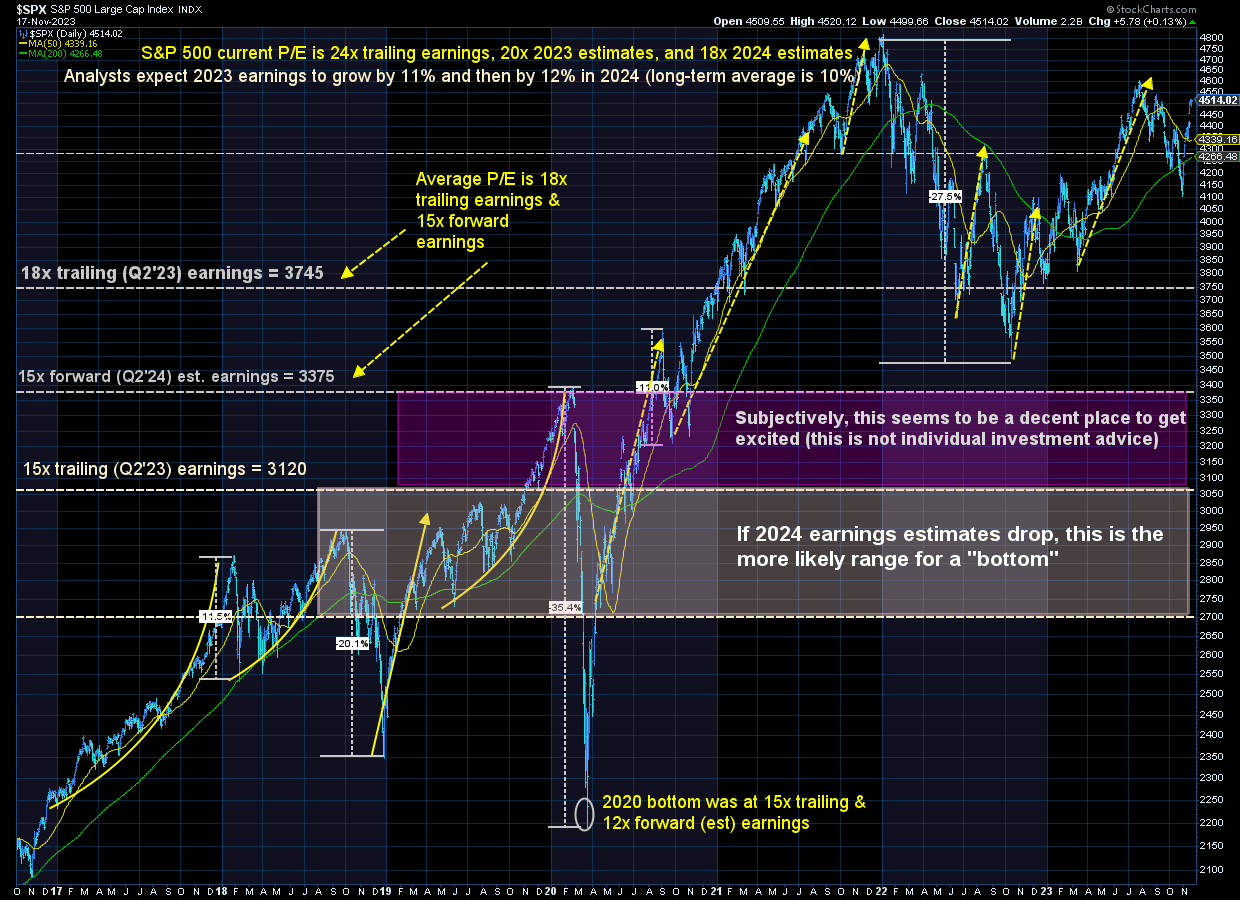
I show this chart not to scare people short-term, but to speak to those who are wanting to add more stock allocations to their portfolio simply because stocks have done very well the past 12 months.
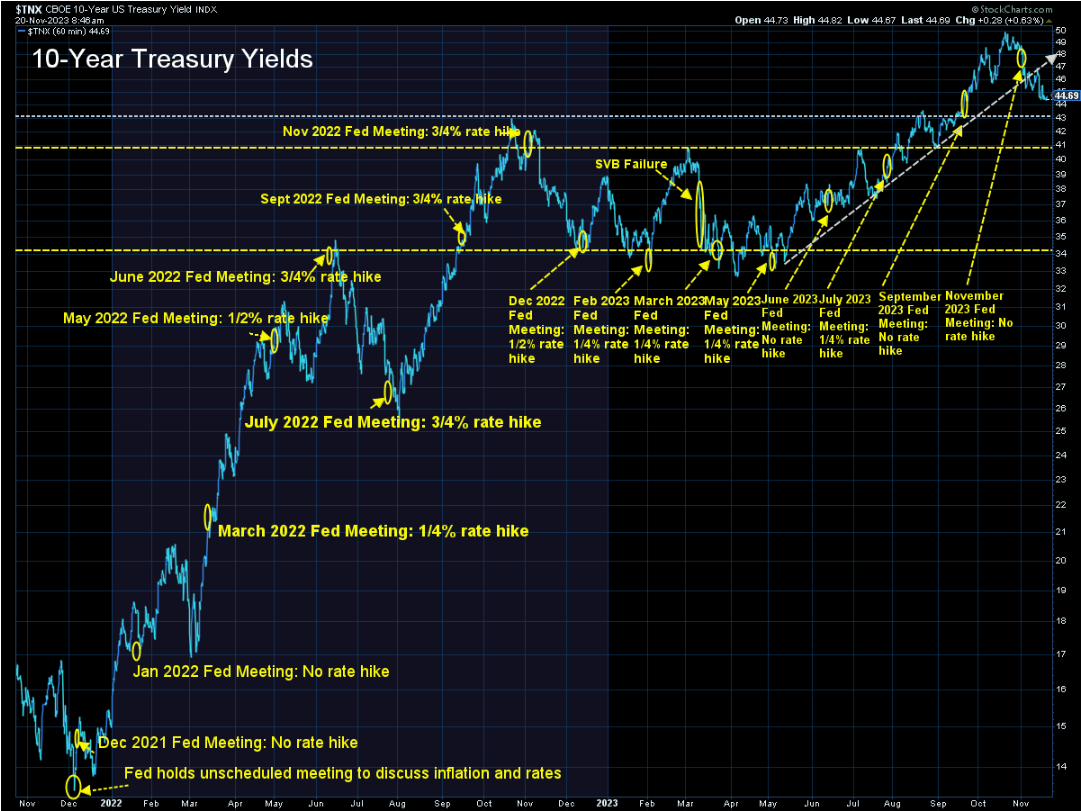
What will likely continue to be important is the direction of long-term interest rates. So far they are moving in the direction we like to see (down).
I like this chart because it illustrates how quickly interest rates reverted back to 2004 - 2007 levels after spending the majority of the last 15 years below 3.5%.
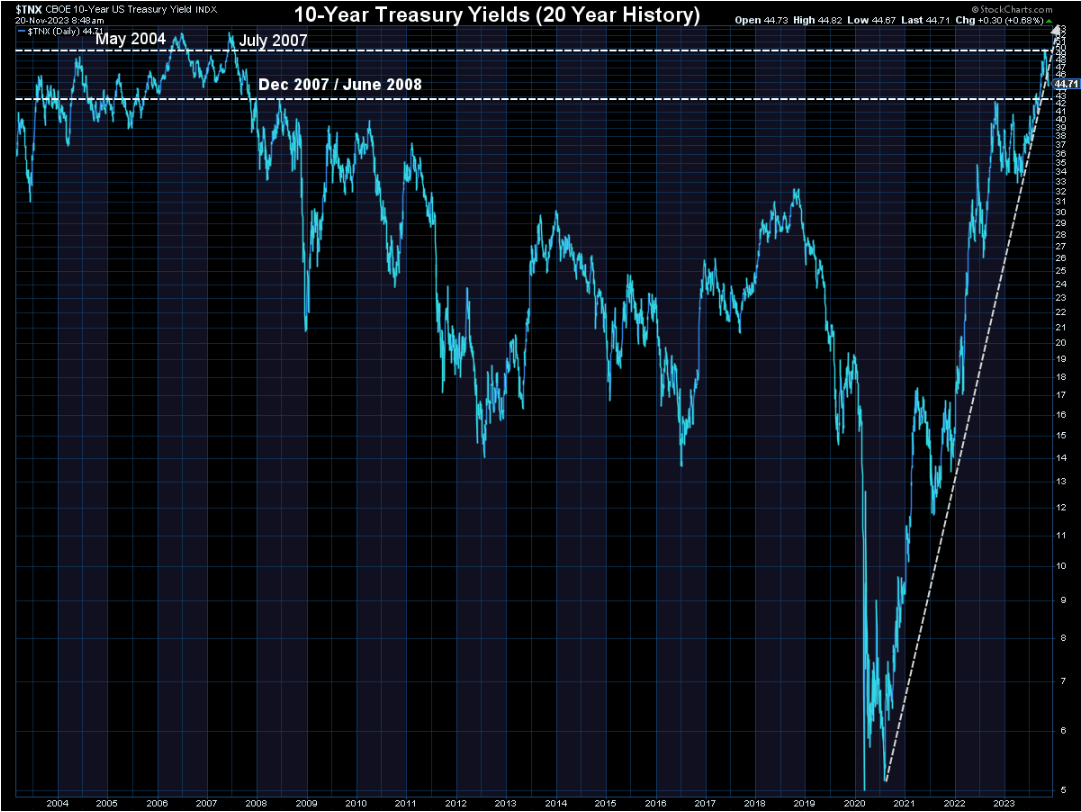
Here's a reality the market has not taken into account — the business/economic environment is DIFFERENT than it was for the past 15 years. The HOPE is we see rates go back below 3.5%, but that may not happen and if it does it may not be the positive everyone thinks it will be.
Time will tell.
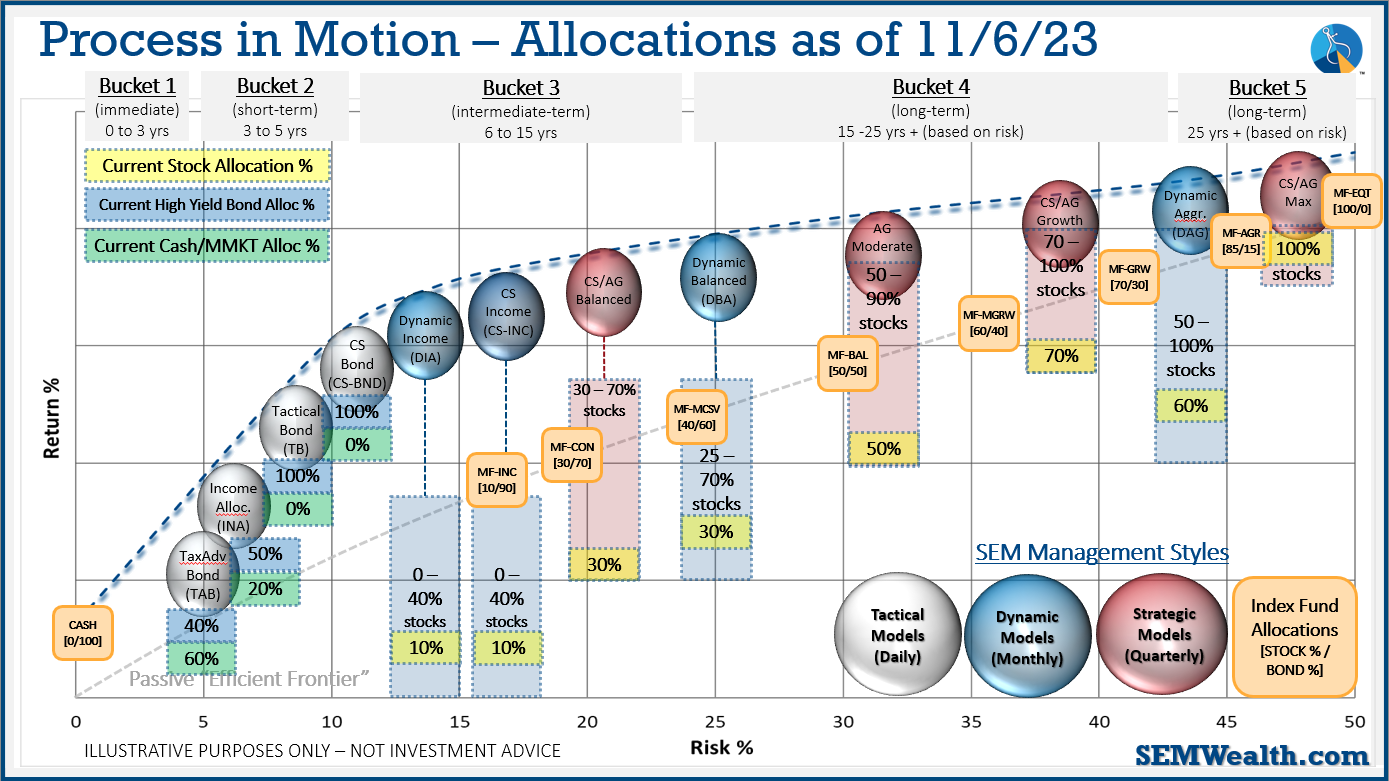
SEM Model Positioning
[there were several shifts the week of 10/30 - click here for the details]
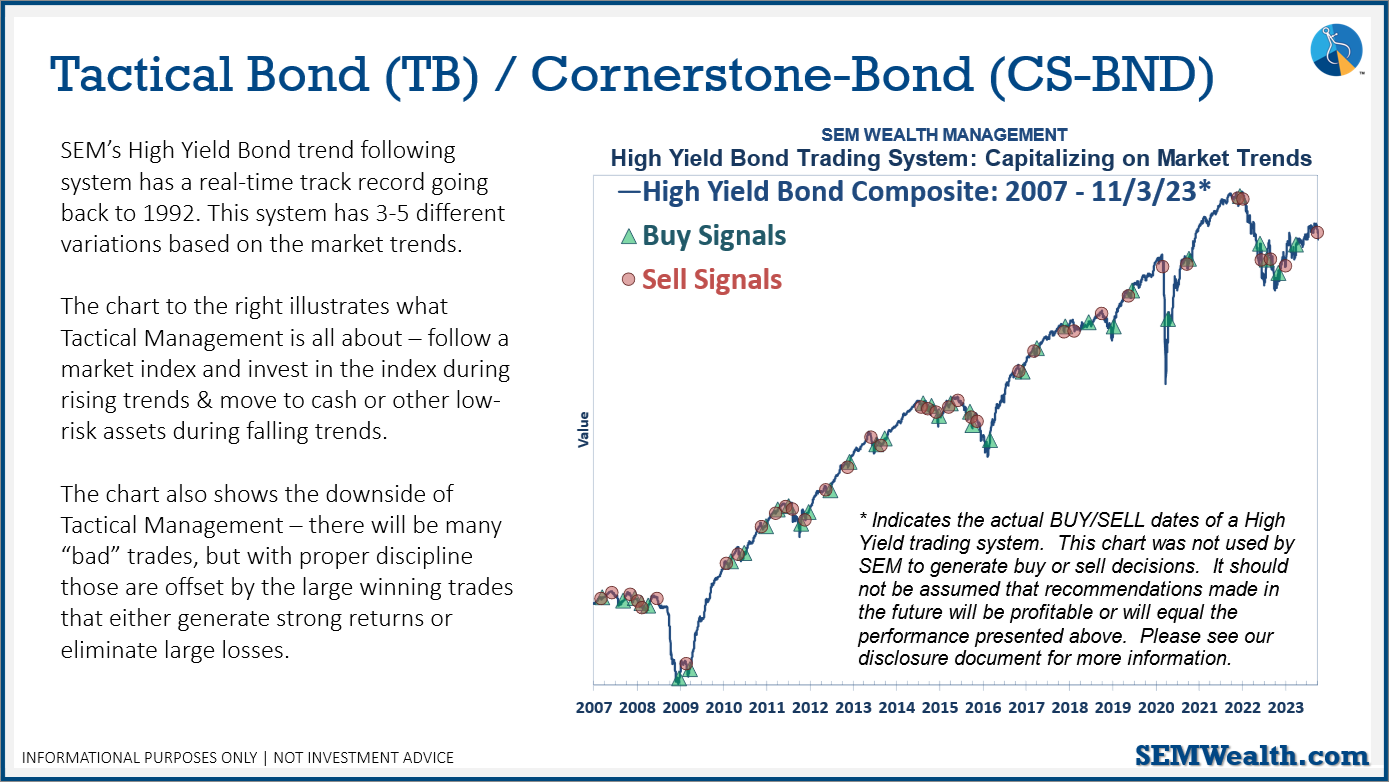
SEM deploys 3 distinct approaches – Tactical, Dynamic, and Strategic. These systems have been described as 'daily, monthly, quarterly' given how often they may make adjustments. Here is where they each stand.
Tactical (daily): The High Yield Bond system bought the beginning of April and issued all 3 sell signals 9/28/2023. All 3 systems were back on buy signals by the close on 11/3/2023. The bond funds we are invested in are a bit more 'conservative' than the overall index, but still yielding between 7.5 -8.5% annually.
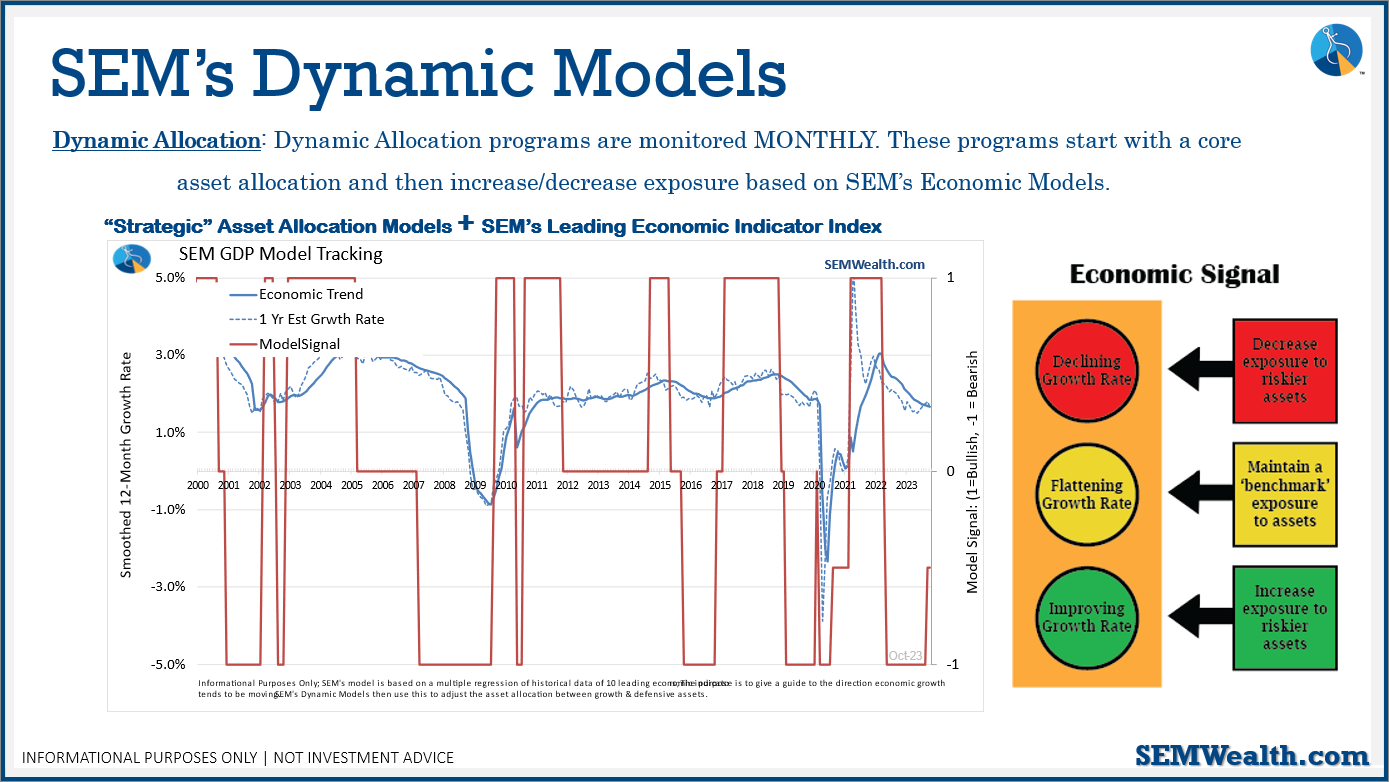
Dynamic (monthly): At the beginning of October the model moved slightly off the "bearish" signal we've had since April 2022. This means a small position in dividend stocks (Dynamic Income) and small cap stocks (Dynamic Aggressive Growth). Other than that, the models remain 'bearish' and is closer to going back to fully 'bearish' than it is to moving to 'neutral'.
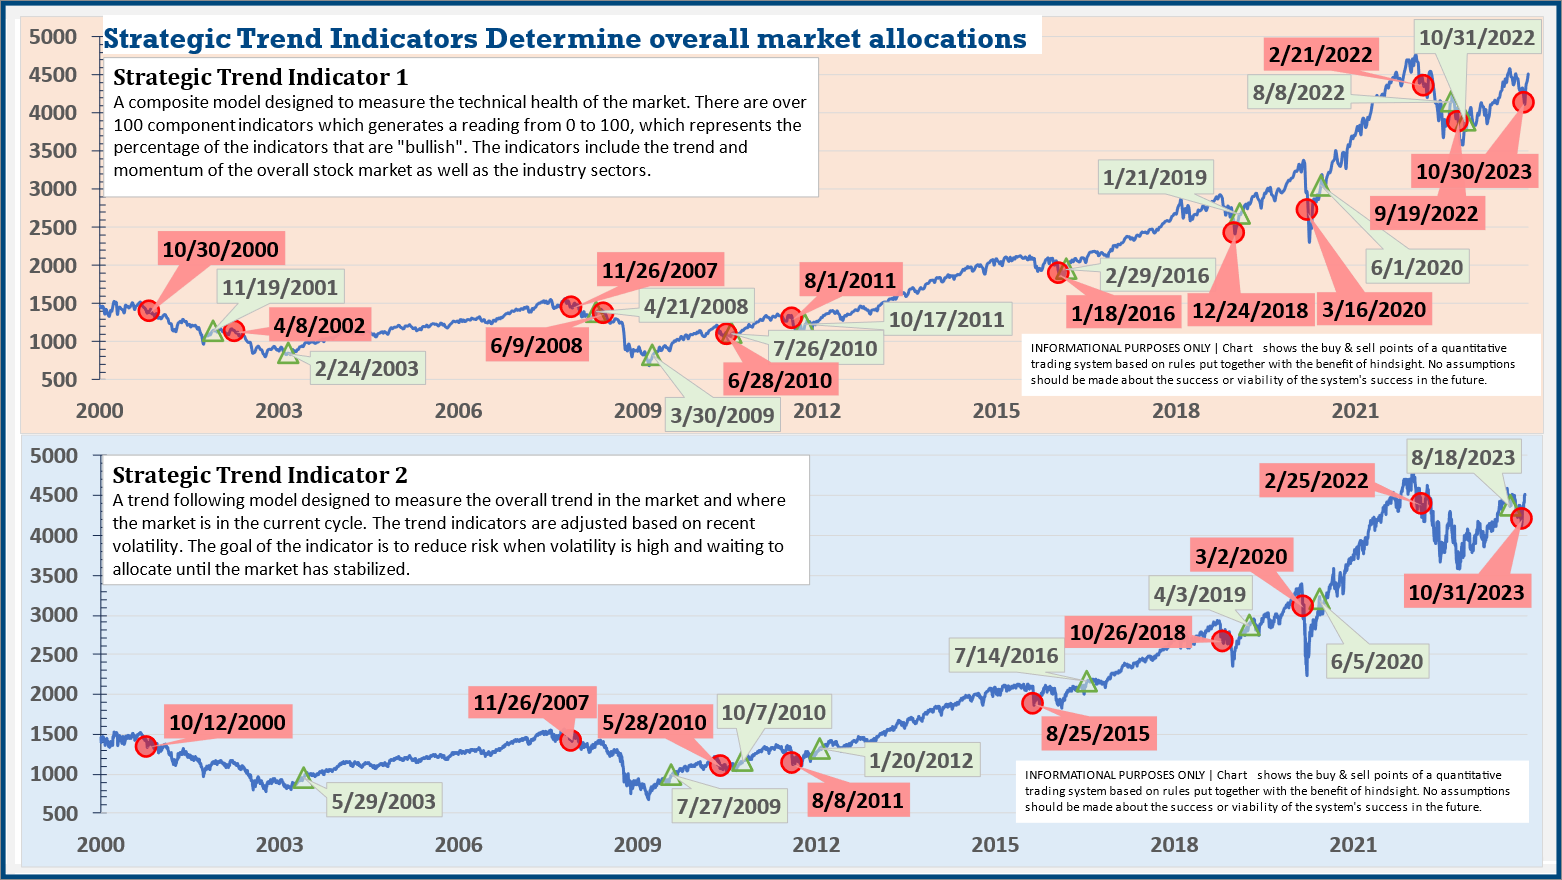
Strategic (quarterly)*:
BOTH Trend Systems sold the week of 10/30/2023.
The core rotation is adjusted quarterly. On August 17 it rotated out of mid-cap growth and into small cap value. It also sold some large cap value to buy some large cap blend and growth. The large cap purchases were in actively managed funds with more diversification than the S&P 500 (banking on the market broadening out beyond the top 5-10 stocks.) With the trend system sells on 10/30/23, large cap growth and large cap blend were reduced, creating more of a balanced portfolio between small-mid-large cap.
The * in quarterly is for the trend models. These models are watched daily but they trade infrequently based on readings of where each believe we are in the cycle. The second indicator triggered on August 16, brining the strategic models to a fully invested position. We are NOT locked into these for the next quarter. The 'sell-point' for this system is down around 3-4% from here.
Overall, this is how our various models stock up: