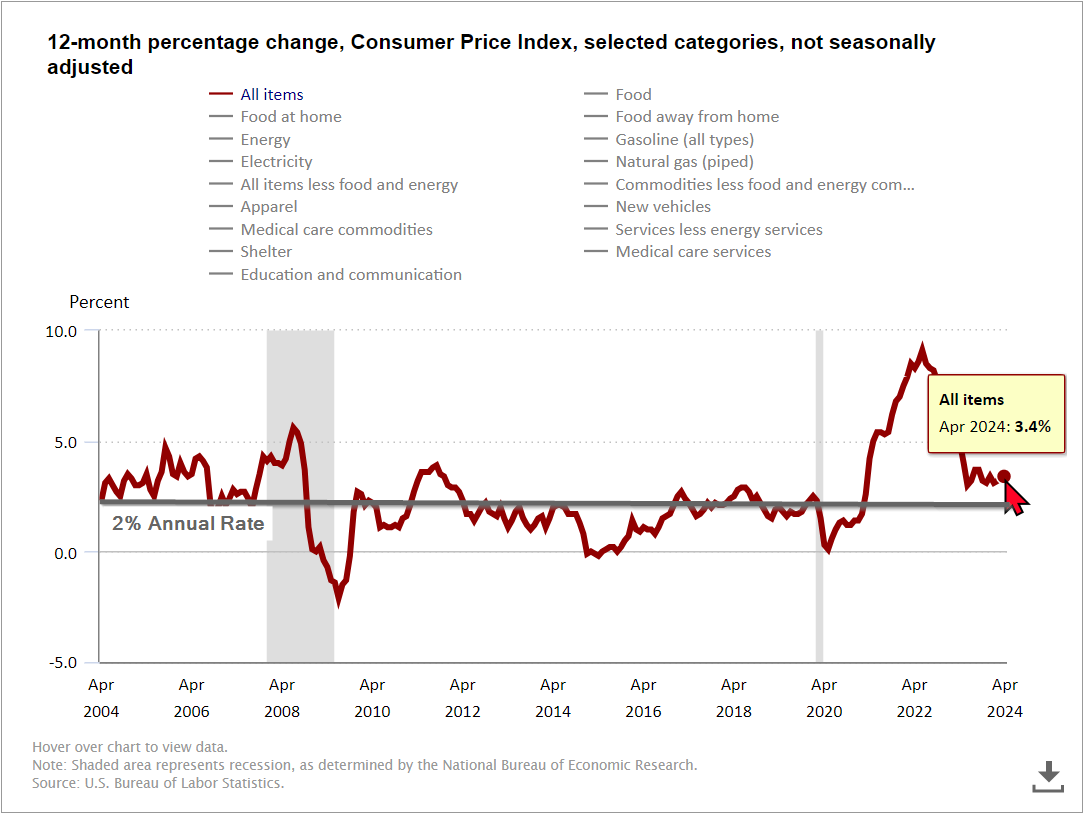
Last week the S&P 500 hit another all-time high with the Dow closing the week above 40,000 for the first time. The catalyst for the move was a "better than expected" CPI inflation reading. The "surprise".........
CPI increased by 0.3%.
The expectation was......
0.4%
0.1% is literally a rounding error, yet the market is so focused on the idea the Fed is going to cut interest rates soon every single data point that hints the Fed has successfully reigned in inflation is seen as a catalyst to buy stocks. The 0.3% monthly rate hid the fact inflation is up 3.4% over the past 12 months. 0.3% annualized is actually 3.7%, which is the wrong direction from the Fed's 2% inflation target.
We've cautioned since the start of the year about how ridiculous the expectation was for 6 rate cuts in 2024, but that has not stopped the market. It wants to go higher. The problem the Fed is facing is two-fold — if they cut rates or continue to placate the fears of rate hikes they risk creating another inflationary market bubble. In addition to that, the Fed risks sparking higher demand for housing which also will hurt the middle class once again at a time where consumers are already feeling the pinch of a slowing economy and still high inflation.
Last week we saw a glimpse of the speculative bubble the Fed fueled in 2021 returning when the face of the meme stock mania of 2021 returned to social media. He posted this simple picture (which implies 'things are about to get interesting'):

Which led to this:

and this:

Sanity returned late in the week with both stocks taking big hits, but GameStop is still 29% higher than it was before the Roaring Kitty post. AMC is 50% higher than before the post.
While this is not a sell signal, it is a sign that speculation is running rampant which means there are risks of big air pockets in the market. Like 2021, the market is leaning way too far into "easy" Fed policy and is at risk of small changes causing big drops in prices.
I'm starting to see more clients and advisors who are "ok taking on more risk". They are asking me for the best timing on when to do that and my (general) answer is – unless your financial plan has changed which would indicate a need for greater exposure to the stock market, now is not the time to add stock exposure simply because the market seems unstoppable.
The market may march higher, but that is not a reason to buy stocks. Markets move in cycles led by overreactions in both directions. Right now everyone seems to be overly optimistic about the Fed's ability to control inflation and spark another economic boom. Maybe they will, but if they don't the overreaction to the downside could be severe.
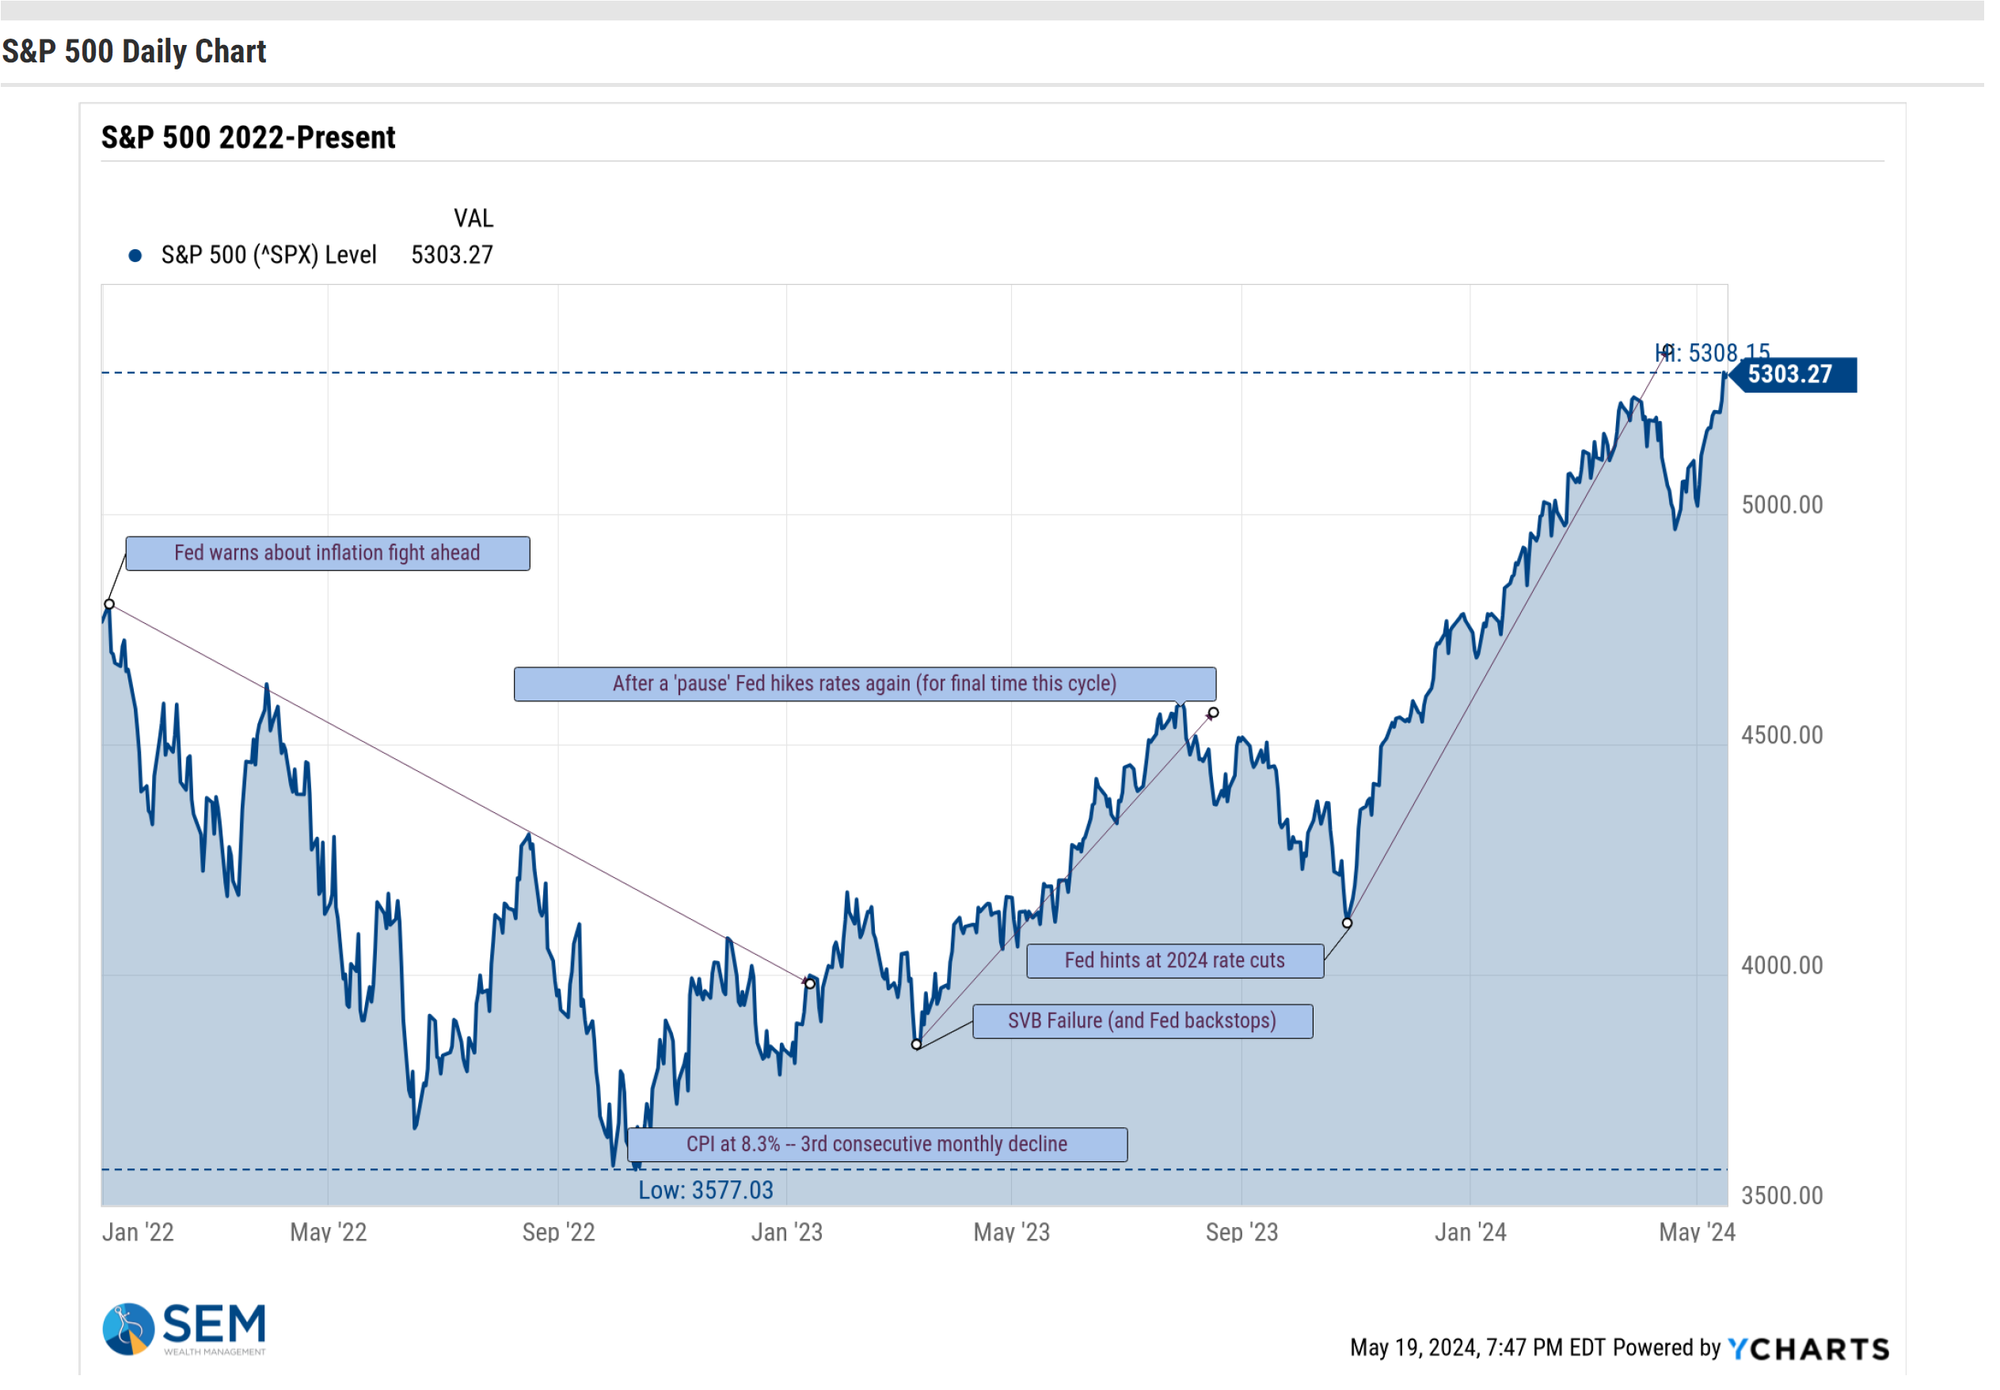
Market Charts
As we've said many times this year – higher highs lead to higher highs. The S&P 500 is once again there which means the trend is up until something shifts it lower. A few weeks ago that something was fear's the inflation readings could lead to the Fed raising rates. Chair Powell squashed those fears and ignited the latest stampede to all-time highs. Let the market run. Enjoy the gains, but do not chase it higher if you're under allocated. Better prices will come.
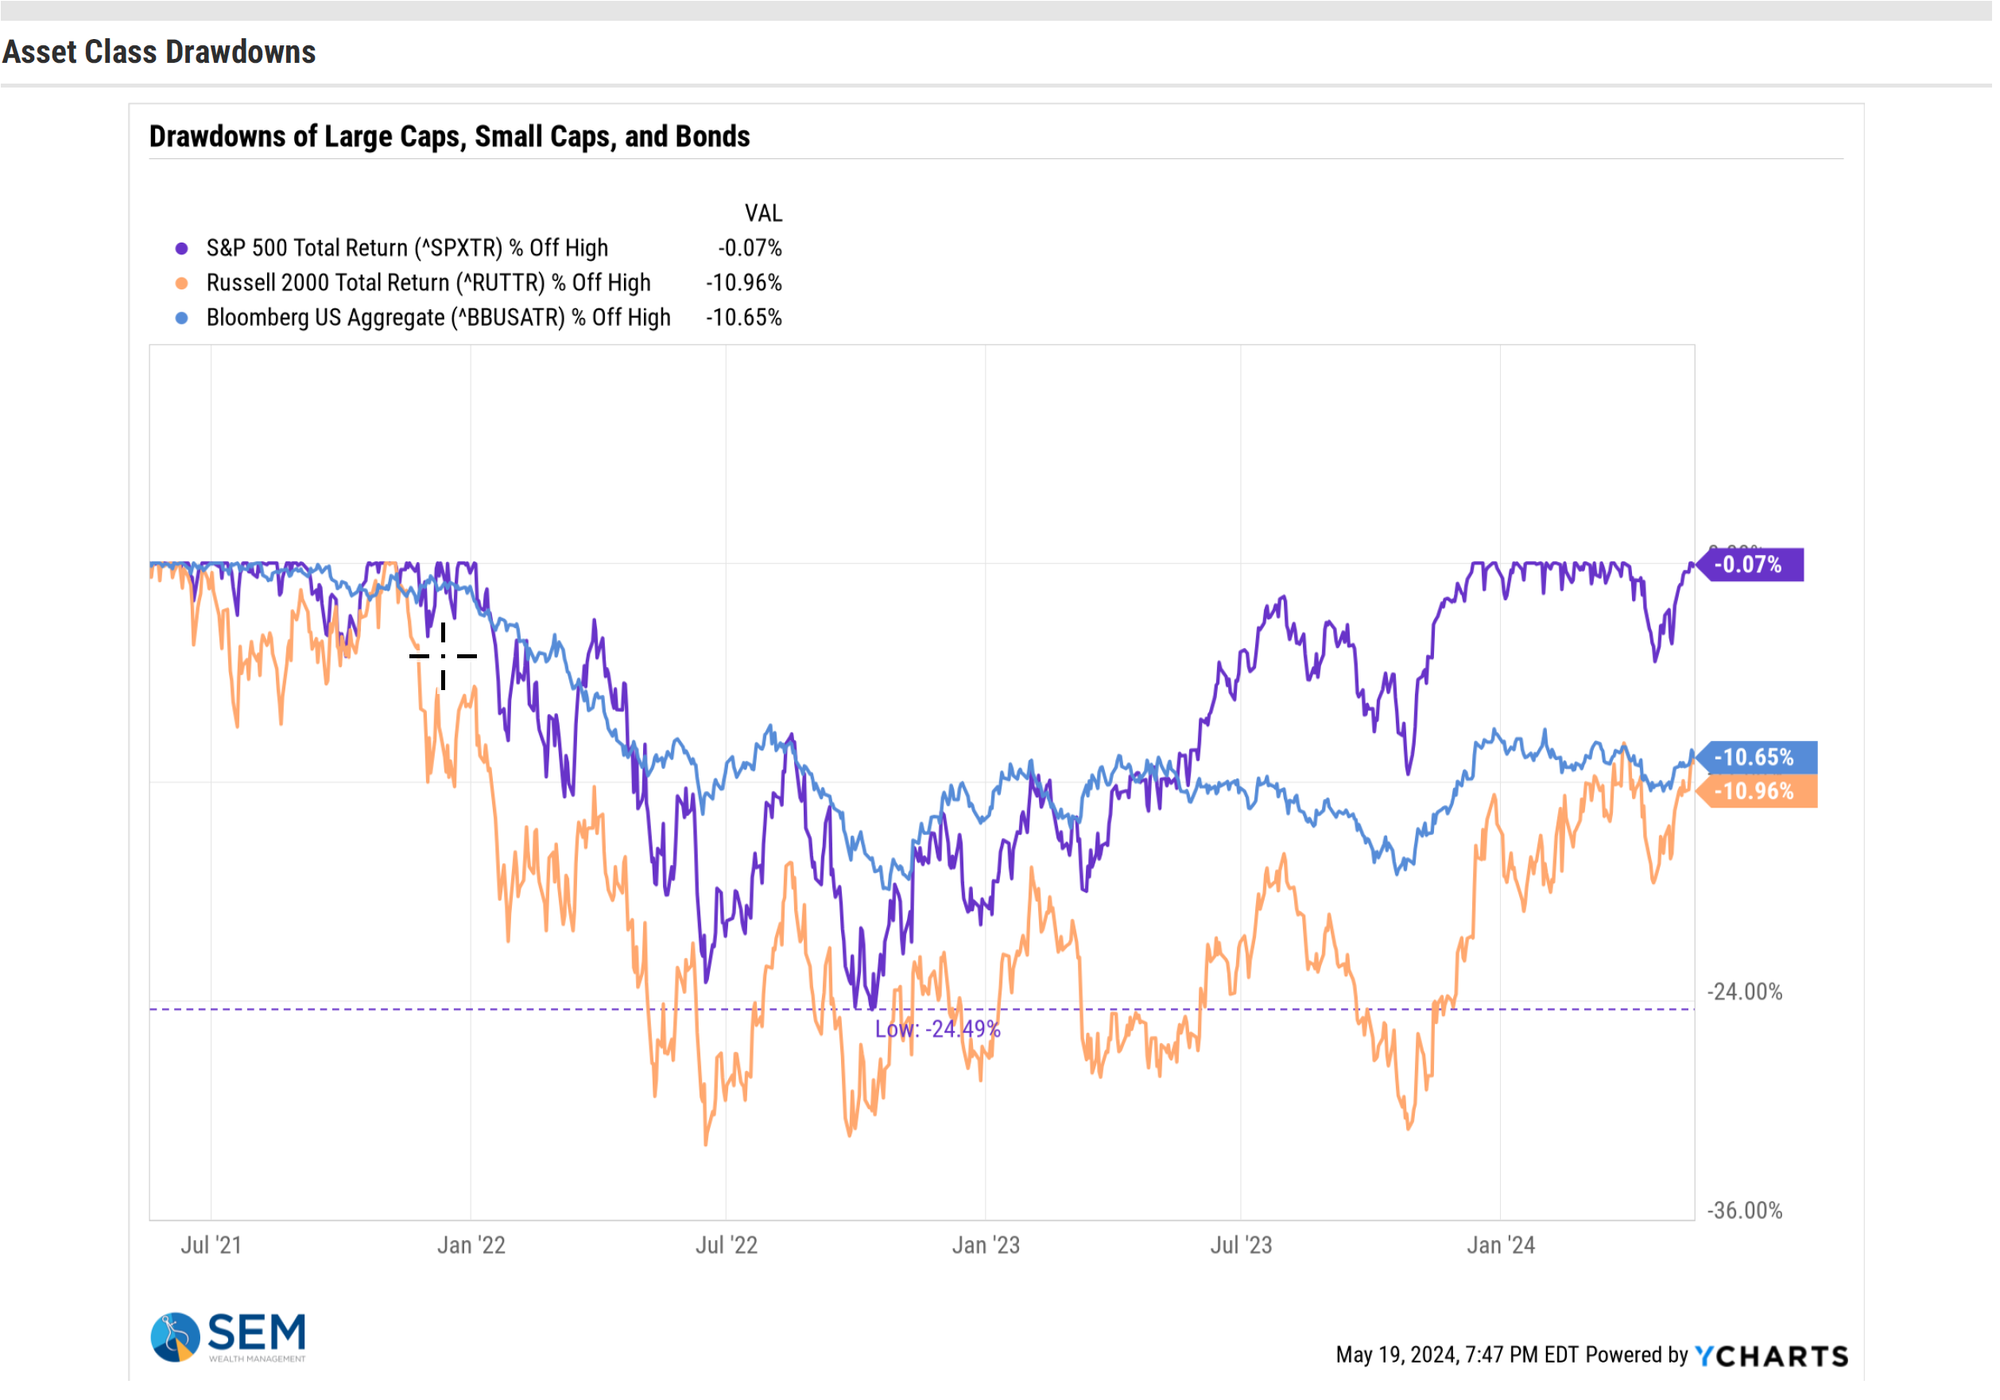
Small caps continue to be the barometer for the confidence institutional investors have in the actual economy and right now that confidence is not great. If we were indeed embarking on a new economic boom driven by easy Fed policies small caps would be outperforming. Instead they have not even broken back above the highs of a few weeks ago.
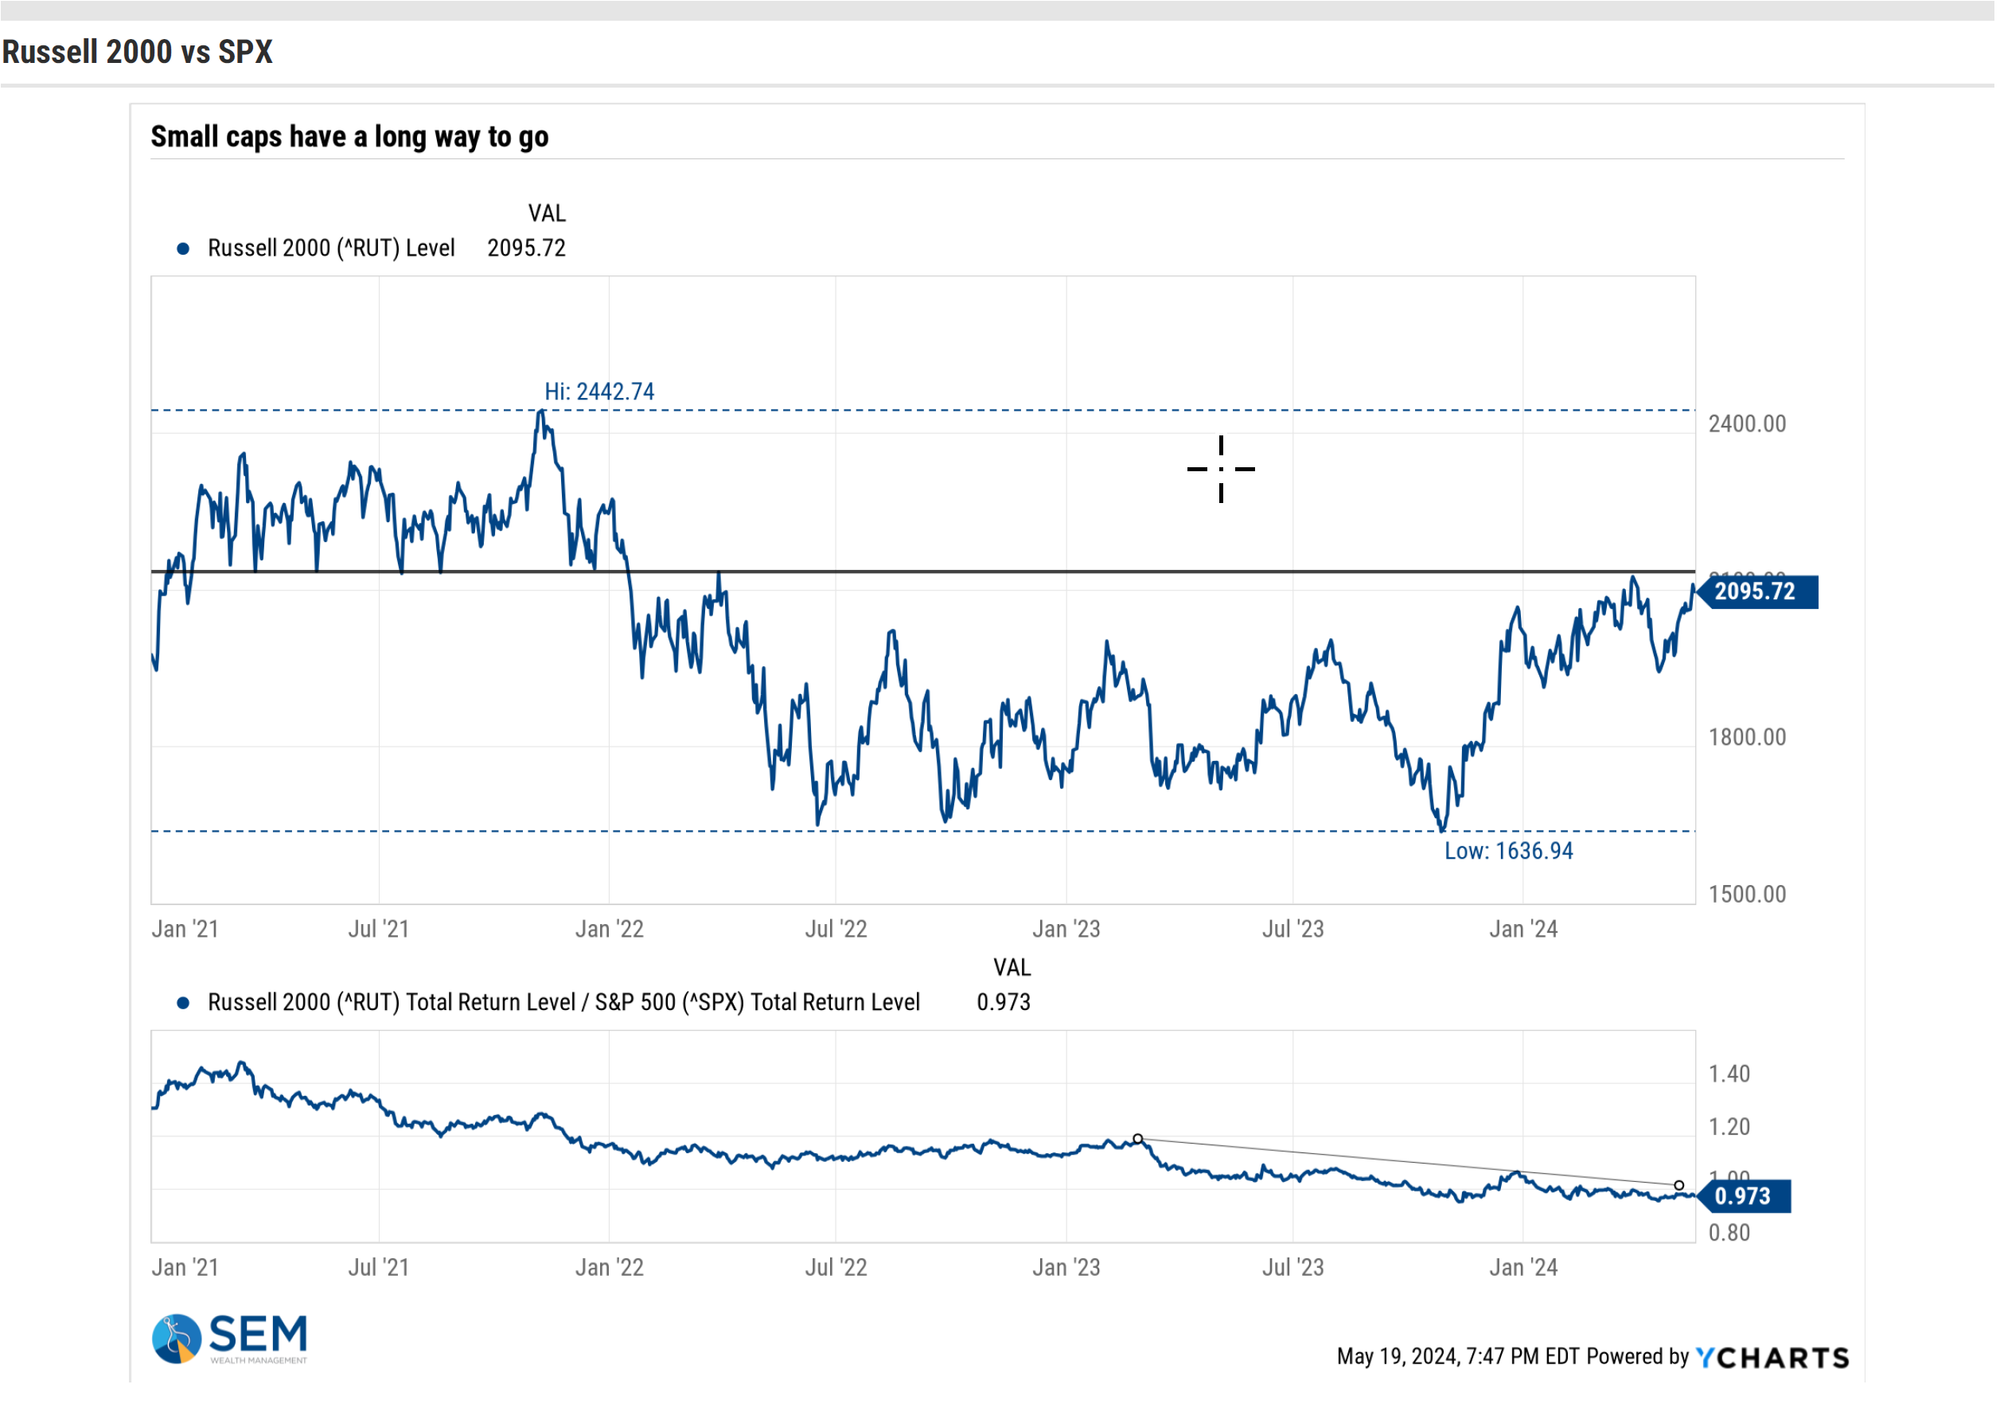
This chart helps tell the story. We are in a backward world where diversification that normally enhances returns by adding small caps and bonds has hurt you. Those who have the least diversification and the highest levels of risk have been rewarded. That is not normal.
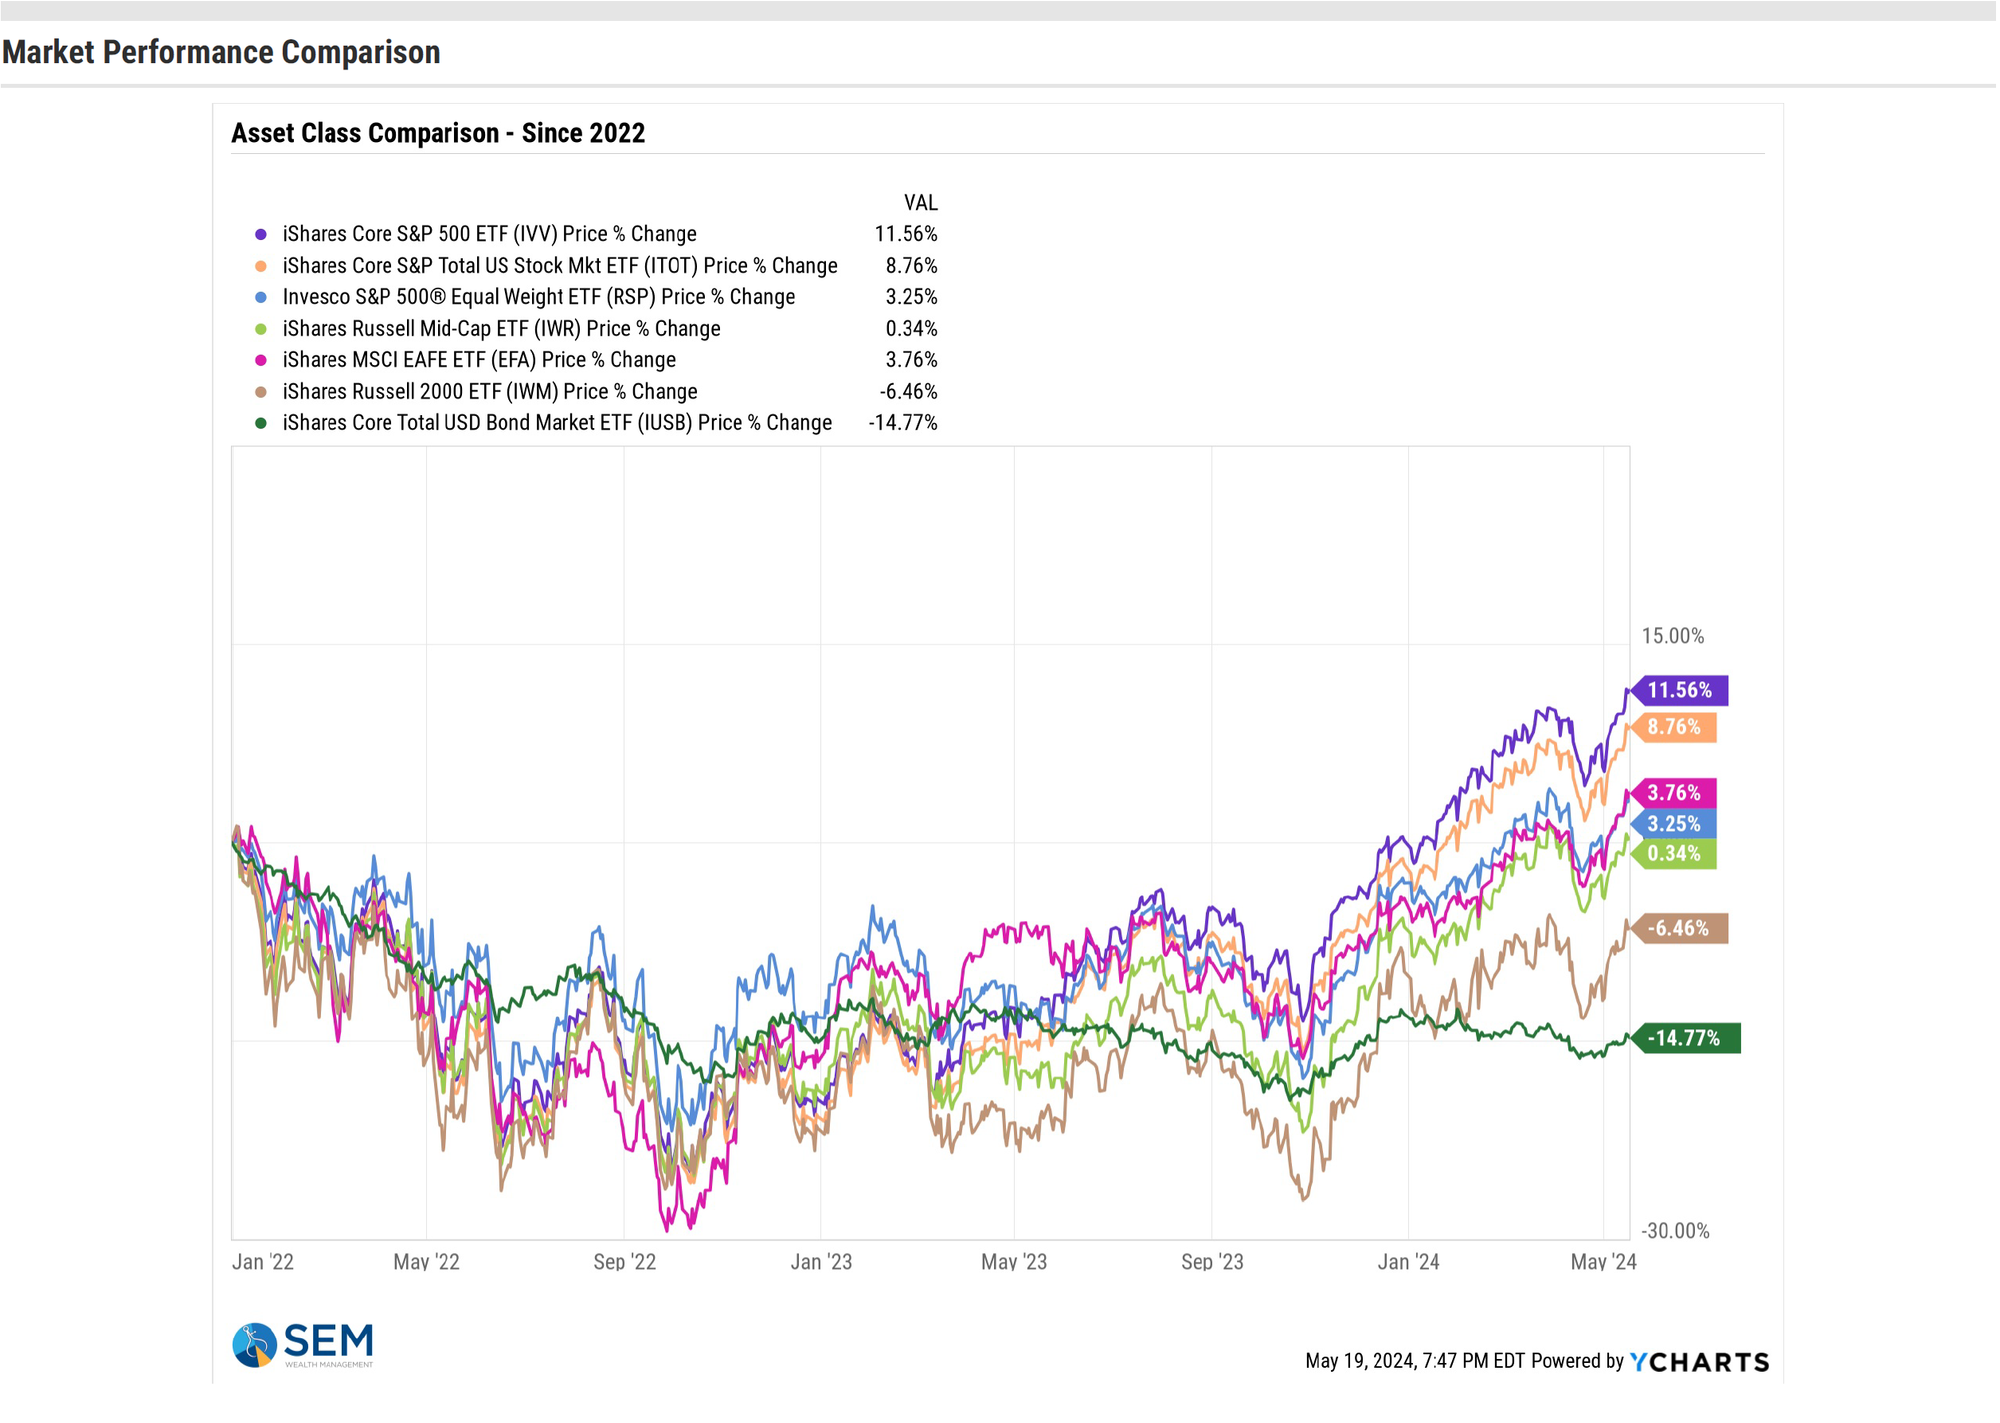
This chart also is a good reference point which shows the returns since the end of the 2021 Meme Stock Bubble. While the largest stocks have pulled the market indexes higher the average stock is not doing so well. Bonds continue to be the worst performers.
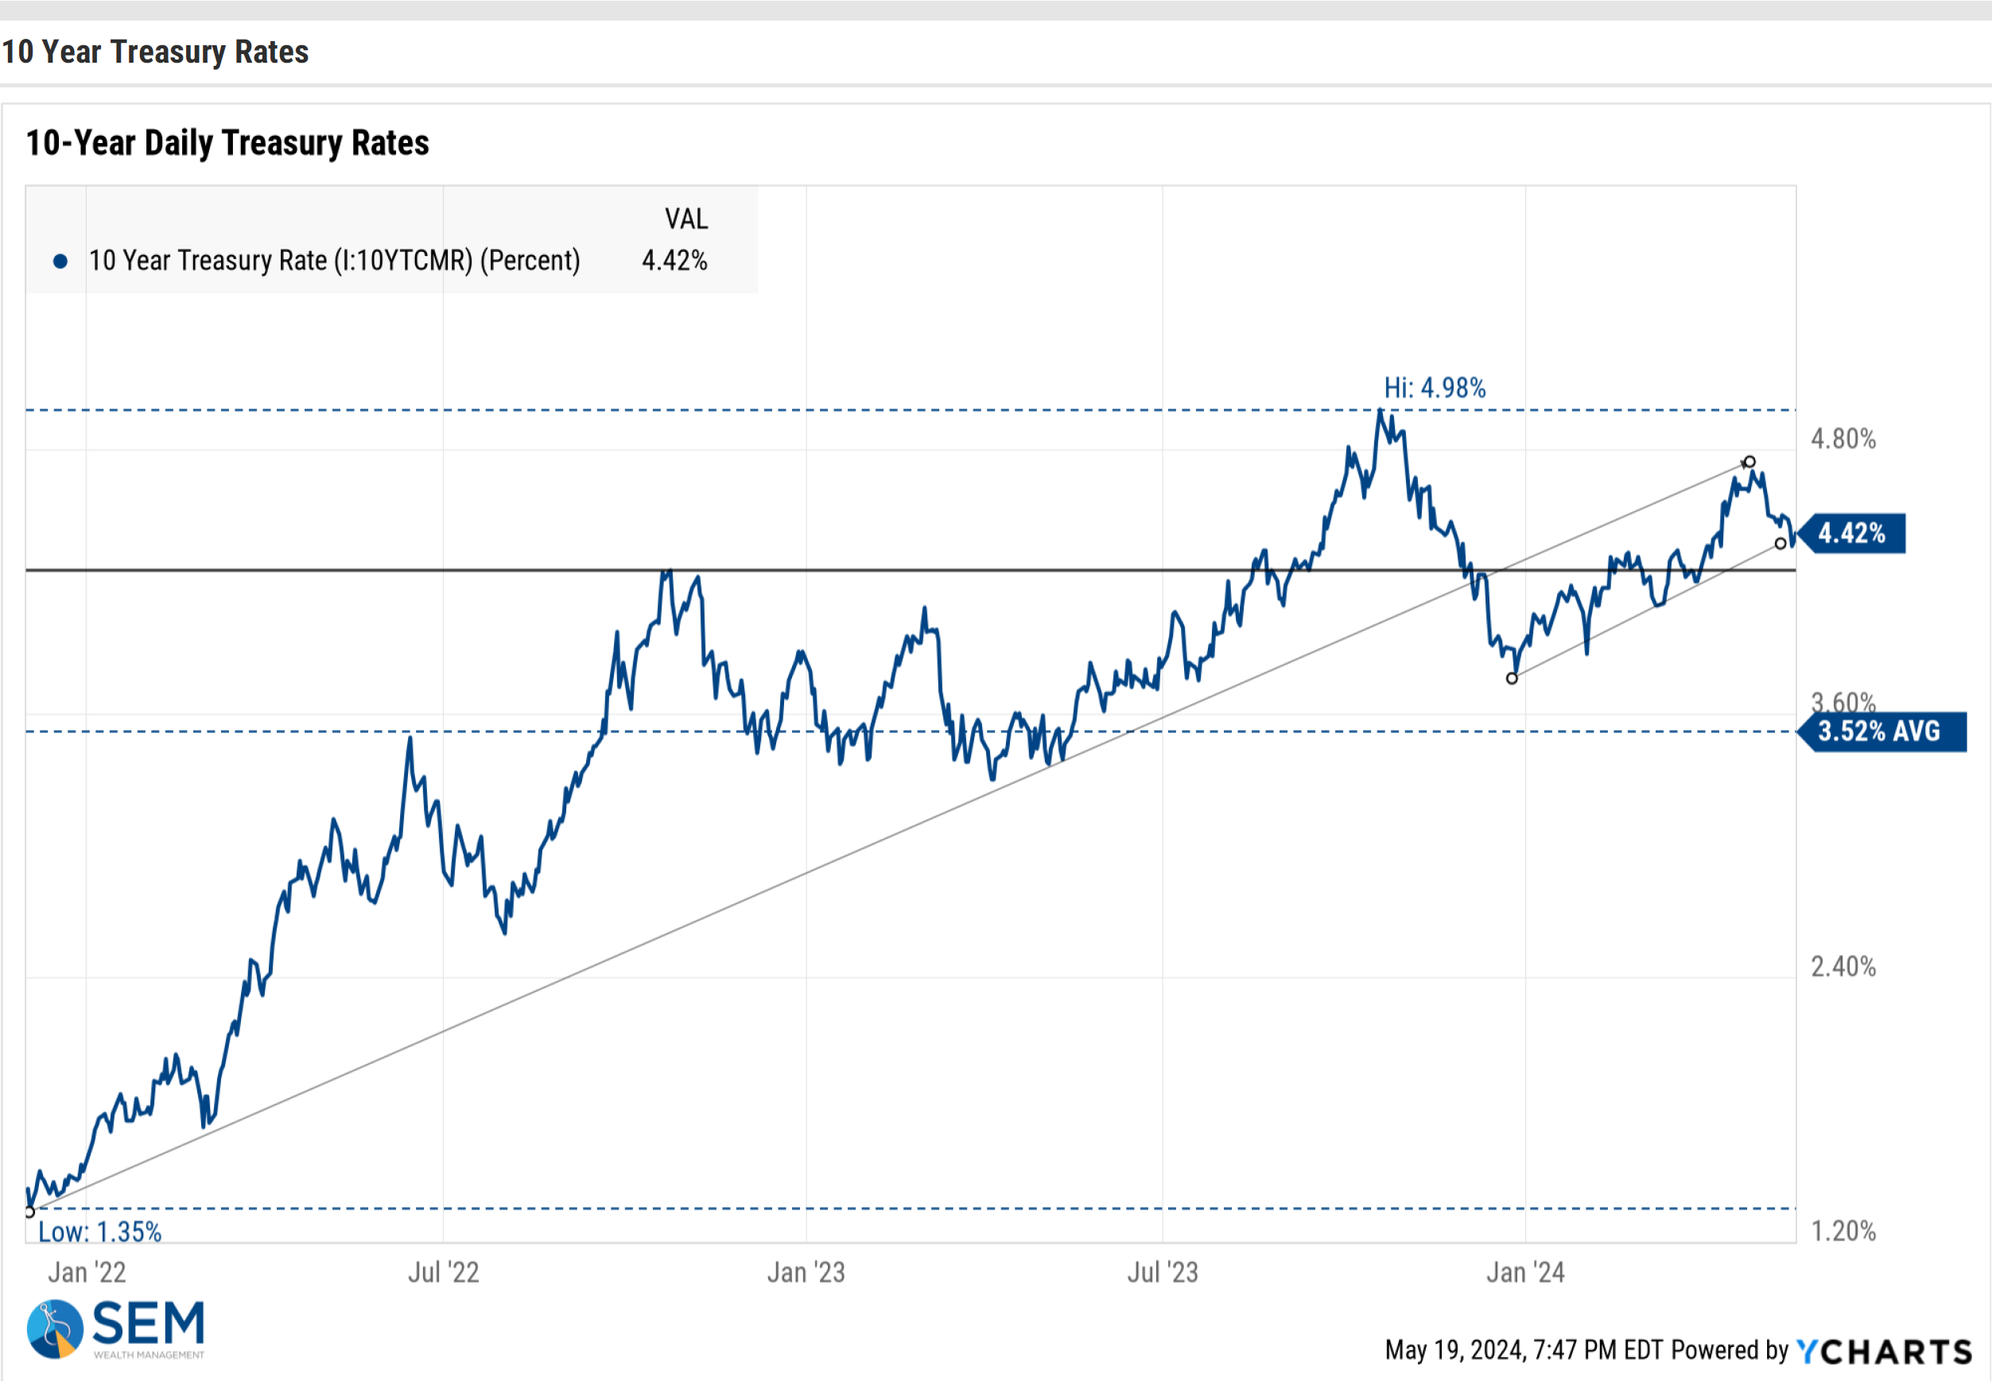
Turning to bonds, the 10-year interest rate appeared to be breaking below it's upward sloping channel at the end of the week, but so far this morning rates are moving higher once again.
This chart is important to understand. If the market was comfortable with the direction of both economic growth and inflation we'd see a 'normal' yield curve where short-term rates are lower than long-term rates. The bond market does not believe what the Fed is telling us, which is creating a disconnect between stocks and bonds.
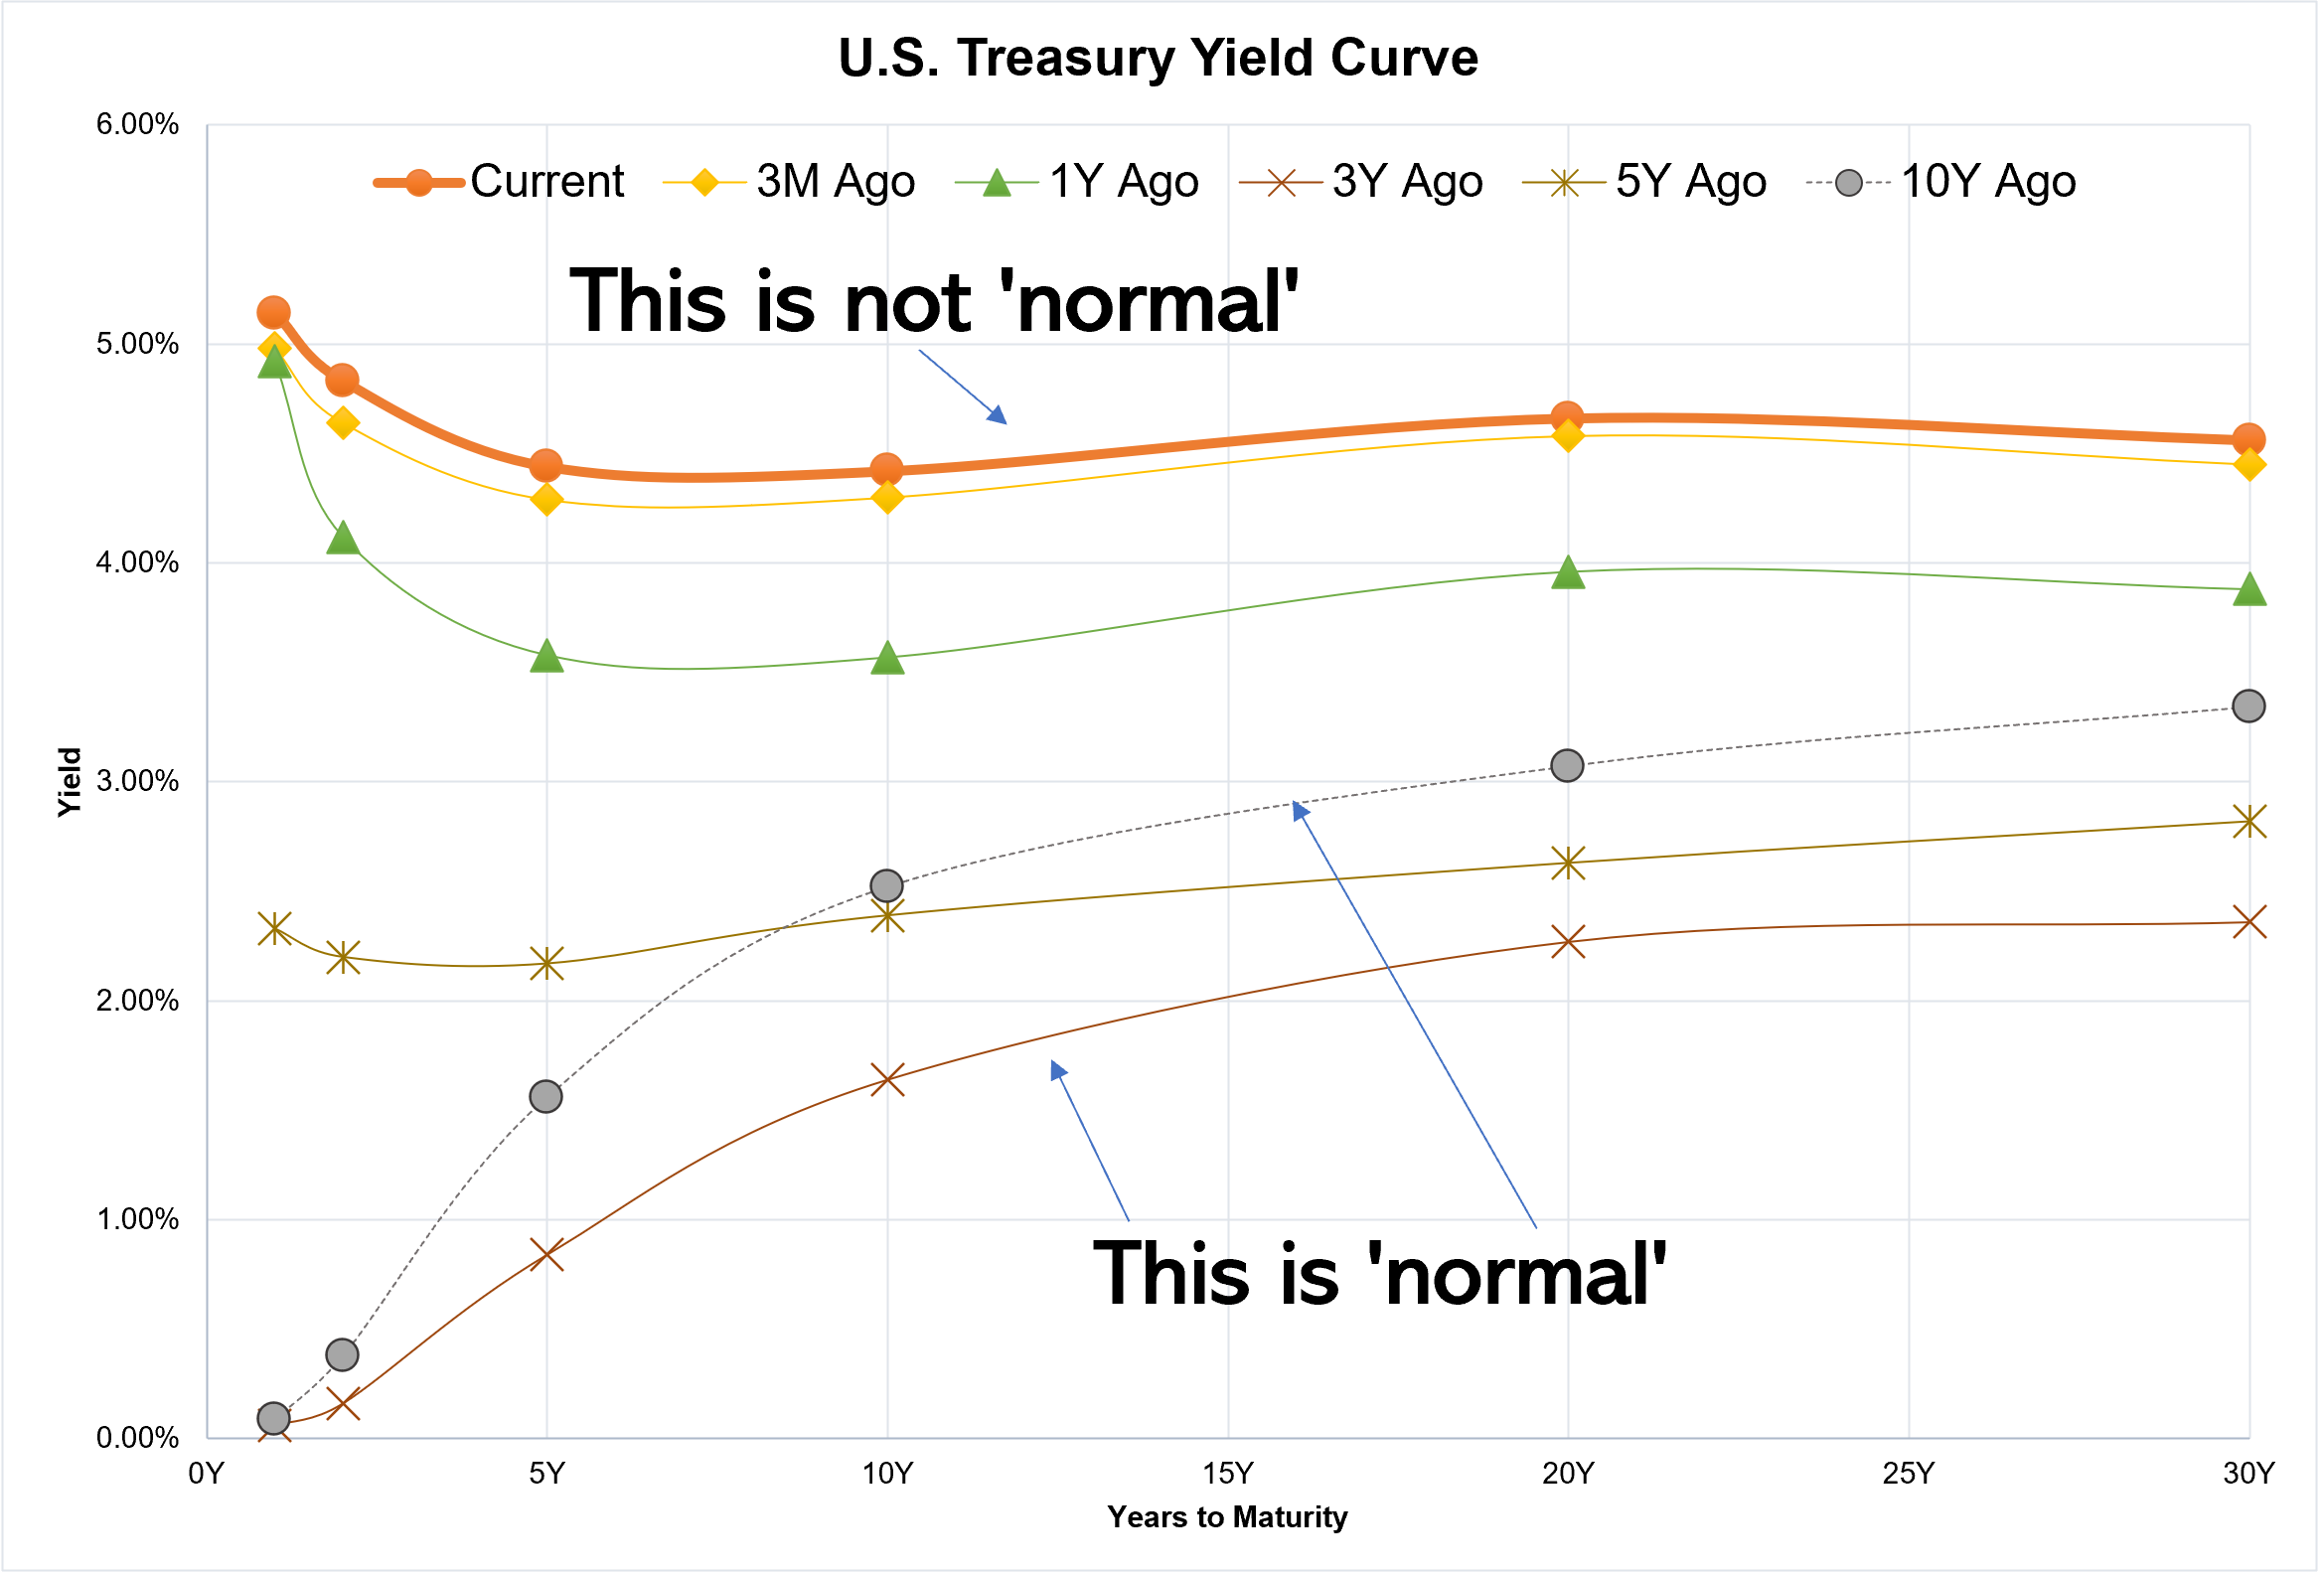
This could resolve in a couple of ways. The first is the Fed does cut rates severely without sparking inflation and the economy booms. You'd see short-term rates go down. The other is more of a concern – the Fed cuts rates and we see inflation come back. Long-term rates would be forced higher and we'd risk seeing economic growth slow which would be bad news for stocks.
There is no sense guessing what happens next. A well-tested, mechanical approach is prudent because not a single person knows with any sort of confidence what happens next. Let the market run, but do not chase it.
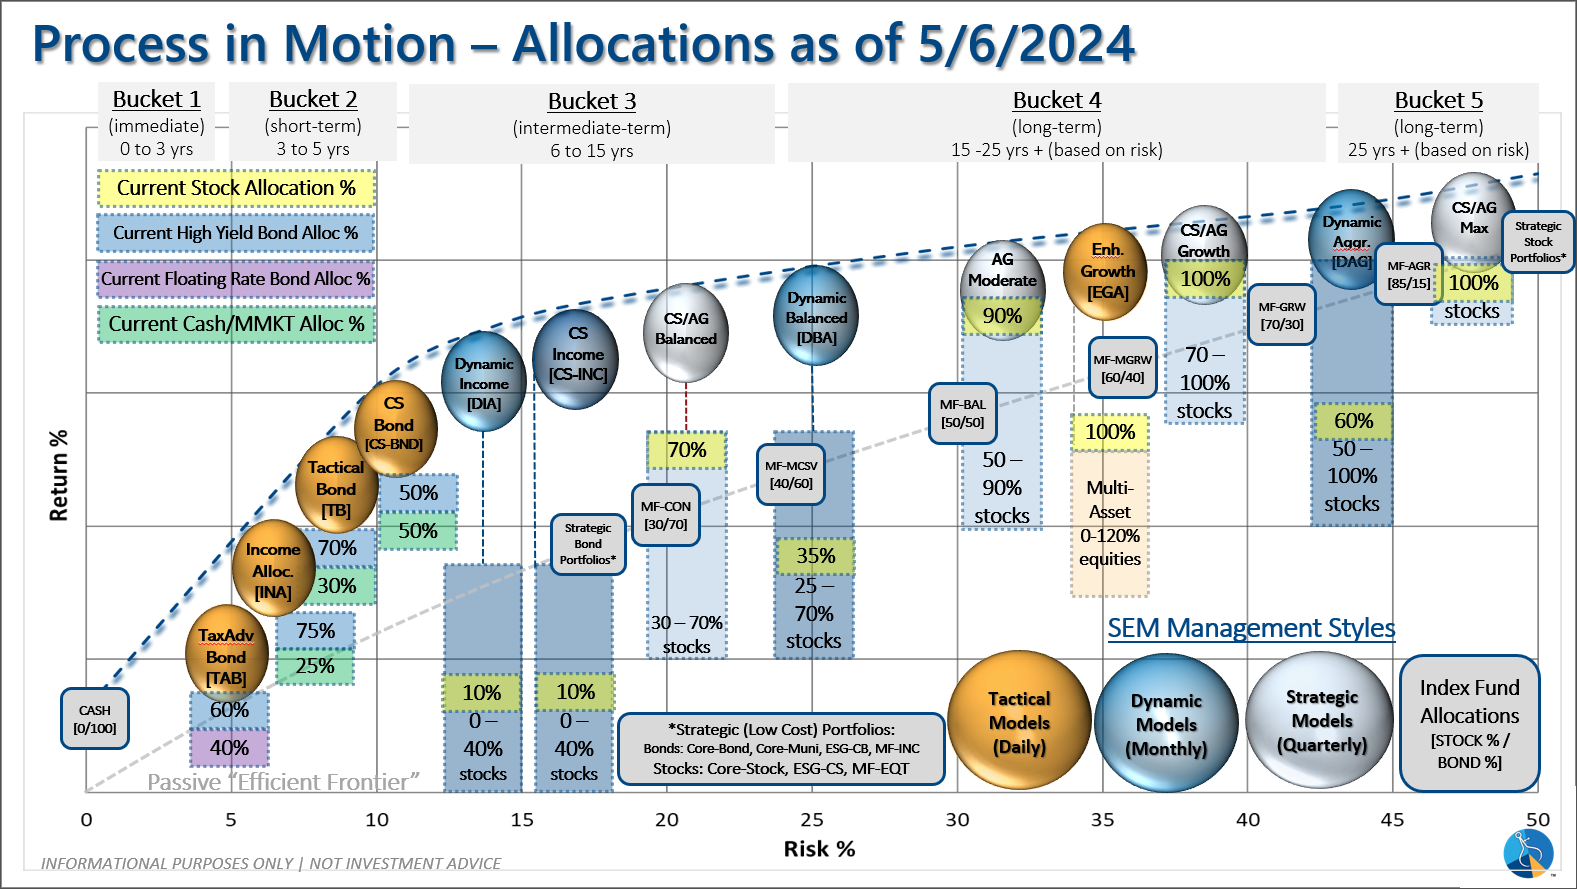
SEM Model Positioning
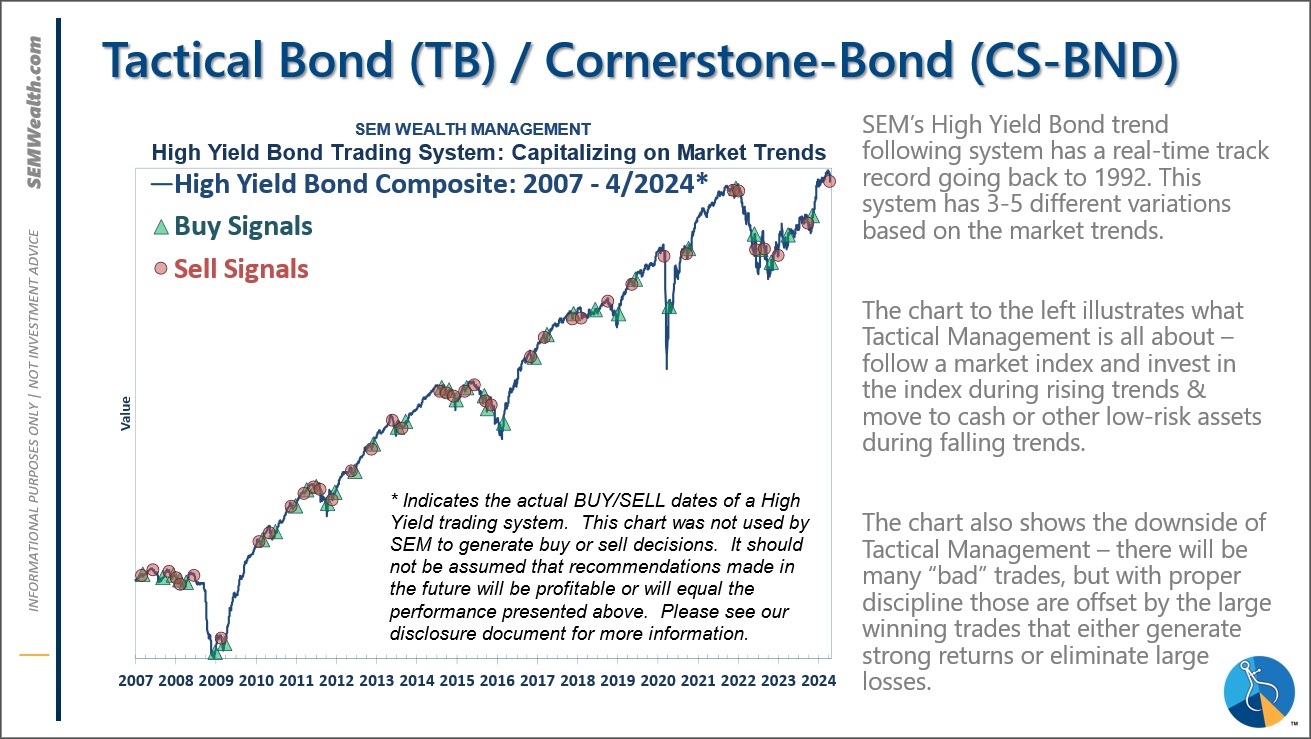
-Tactical High Yield had a partial buy signal on 5/6/24, reversing some of the sells on 4/16 & 17/2024
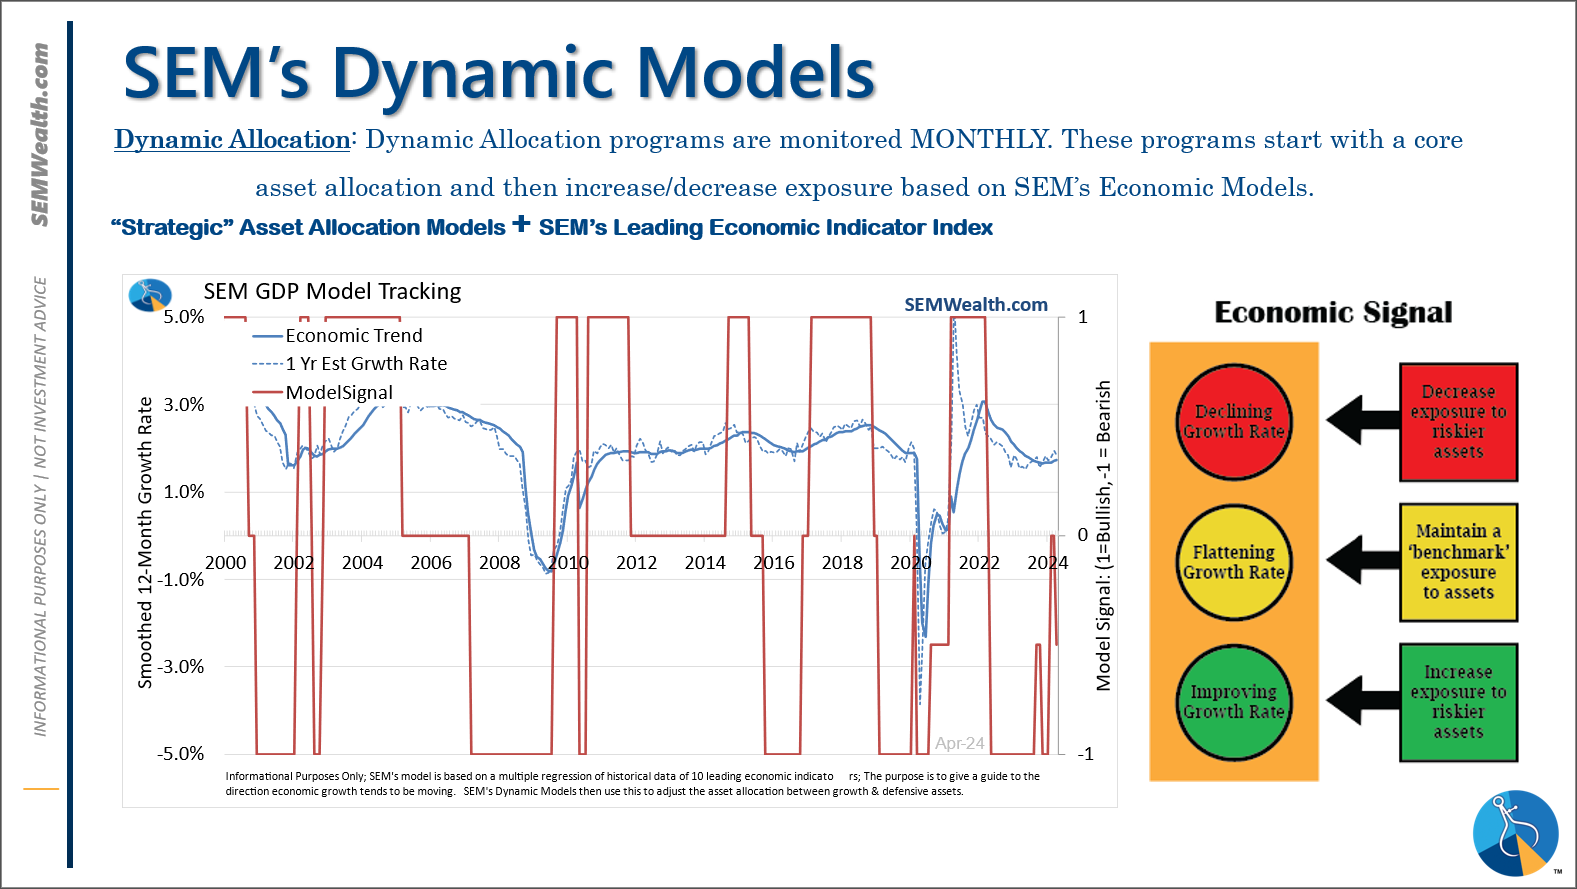
-Dynamic Models went half 'bearish' 5/3/2024
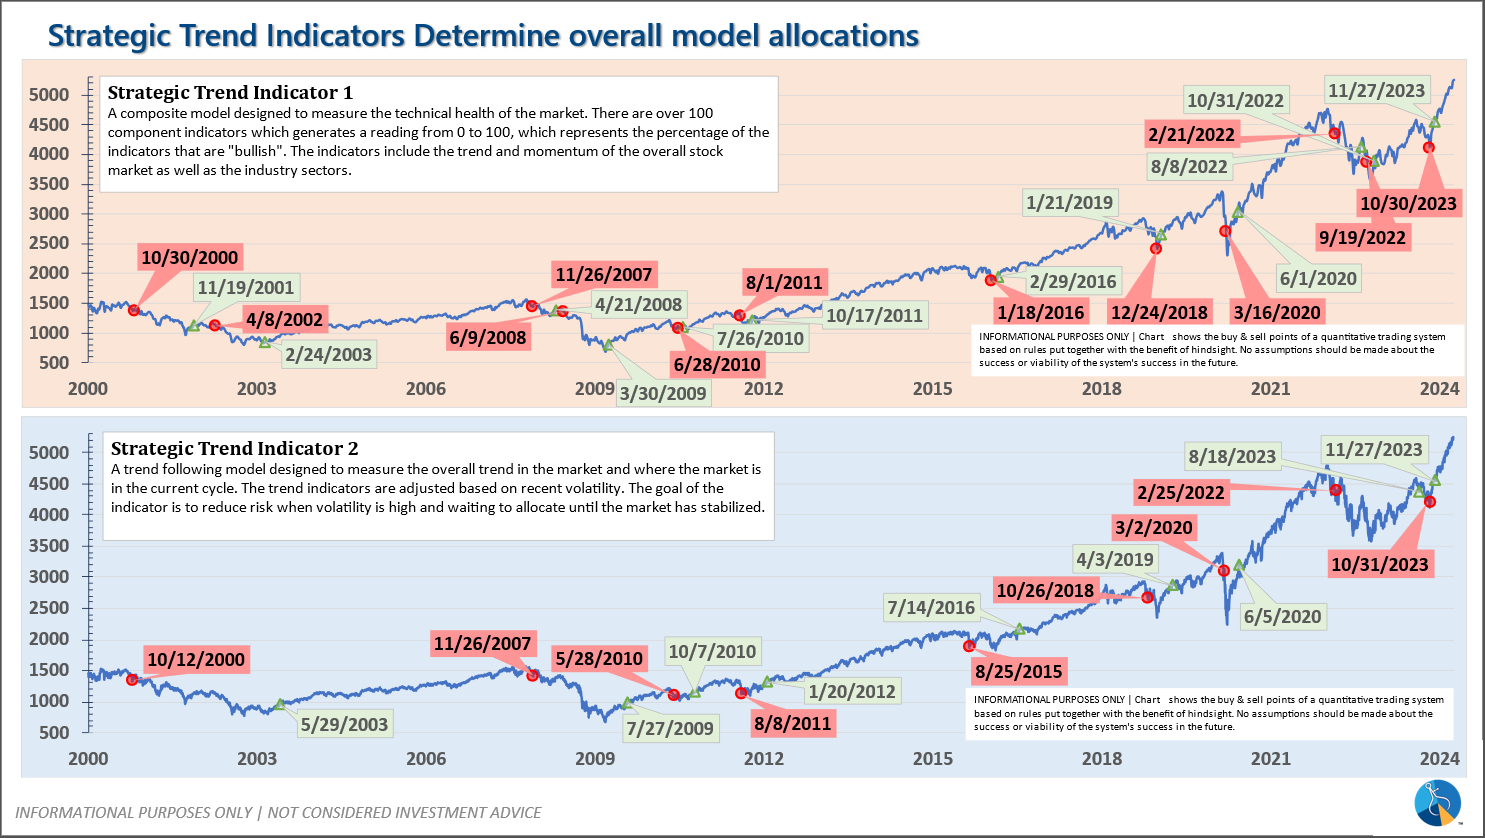
-Strategic Trend Models went on a buy 11/27/2023
SEM deploys 3 distinct approaches – Tactical, Dynamic, and Strategic. These systems have been described as 'daily, monthly, quarterly' given how often they may make adjustments. Here is where they each stand.
Tactical (daily): On 5/6/24 about half of the signals in our high yield models switched to a buy. The other half remains in money market funds. The money market funds we are currently invested in are yielding between 4.8-5.3% annually.
Dynamic (monthly): The economic model was 'neutral' since February. In early May the model moved slightly negative. This means slightly less than benchmark positions – 10% dividend stocks in Dynamic Income and 10% small cap stocks in Dynamic Aggressive Growth.
Strategic (quarterly)*:
BOTH Trend Systems reversed back to a buy on 11/27/2023
The core rotation is adjusted quarterly. On August 17 it rotated out of mid-cap growth and into small cap value. It also sold some large cap value to buy some large cap blend and growth. The large cap purchases were in actively managed funds with more diversification than the S&P 500 (banking on the market broadening out beyond the top 5-10 stocks.) On January 8 it rotated completely out of small cap value and mid-cap growth to purchase another broad (more diversified) large cap blend fund along with a Dividend Growth fund.
The * in quarterly is for the trend models. These models are watched daily but they trade infrequently based on readings of where each believe we are in the cycle. The trend systems can be susceptible to "whipsaws" as we saw with the recent sell and buy signals at the end of October and November. The goal of the systems is to miss major downturns in the market. Risks are high when the market has been stampeding higher as it has for most of 2023. This means sometimes selling too soon. As we saw with the recent trade, the systems can quickly reverse if they are wrong.
Overall, this is how our various models stack up based on the last allocation change: