Last week started out promising before one of our "summer themes" took over after the close on Wednesday night. Those themes are – the AI buildout is getting more expensive, inflation is becoming more structural, the new Fed Chair appears serious about inflation, and despite all of that, earnings growth and the economy are still holding up fairly well. As George showed in his "Chart of the Week" below, corporate earnings are still strong and expected to be even stronger going forward. Most of the time analysts are right.....until they aren't.
We also learned another lesson on Wednesday – sometimes companies can BEAT expectations, raise their outlook, and still see their stock take a big hit. Alphabet (aka Google) was the latest example of this and the rest of the market suffered as well. I don't follow individual stocks closely – I stopped doing that in August of 2000 when I learned a hard lesson. Sometimes companies can post breathtaking earnings and revenue growth numbers – numbers above expectations and see their stocks go down. Worse, when the earnings cycle peaks, growth stocks can be hammered.
I'm not saying we are there yet. Living through a cycle makes it hard to see the exact end until we have the benefit of hindsight. What my nerdy, accounting brain is seeing is tech companies who used to brag about not having to use debt because they generated so much cash, are now seeing their cash flow quickly disrupted by runaway spending on data centers.
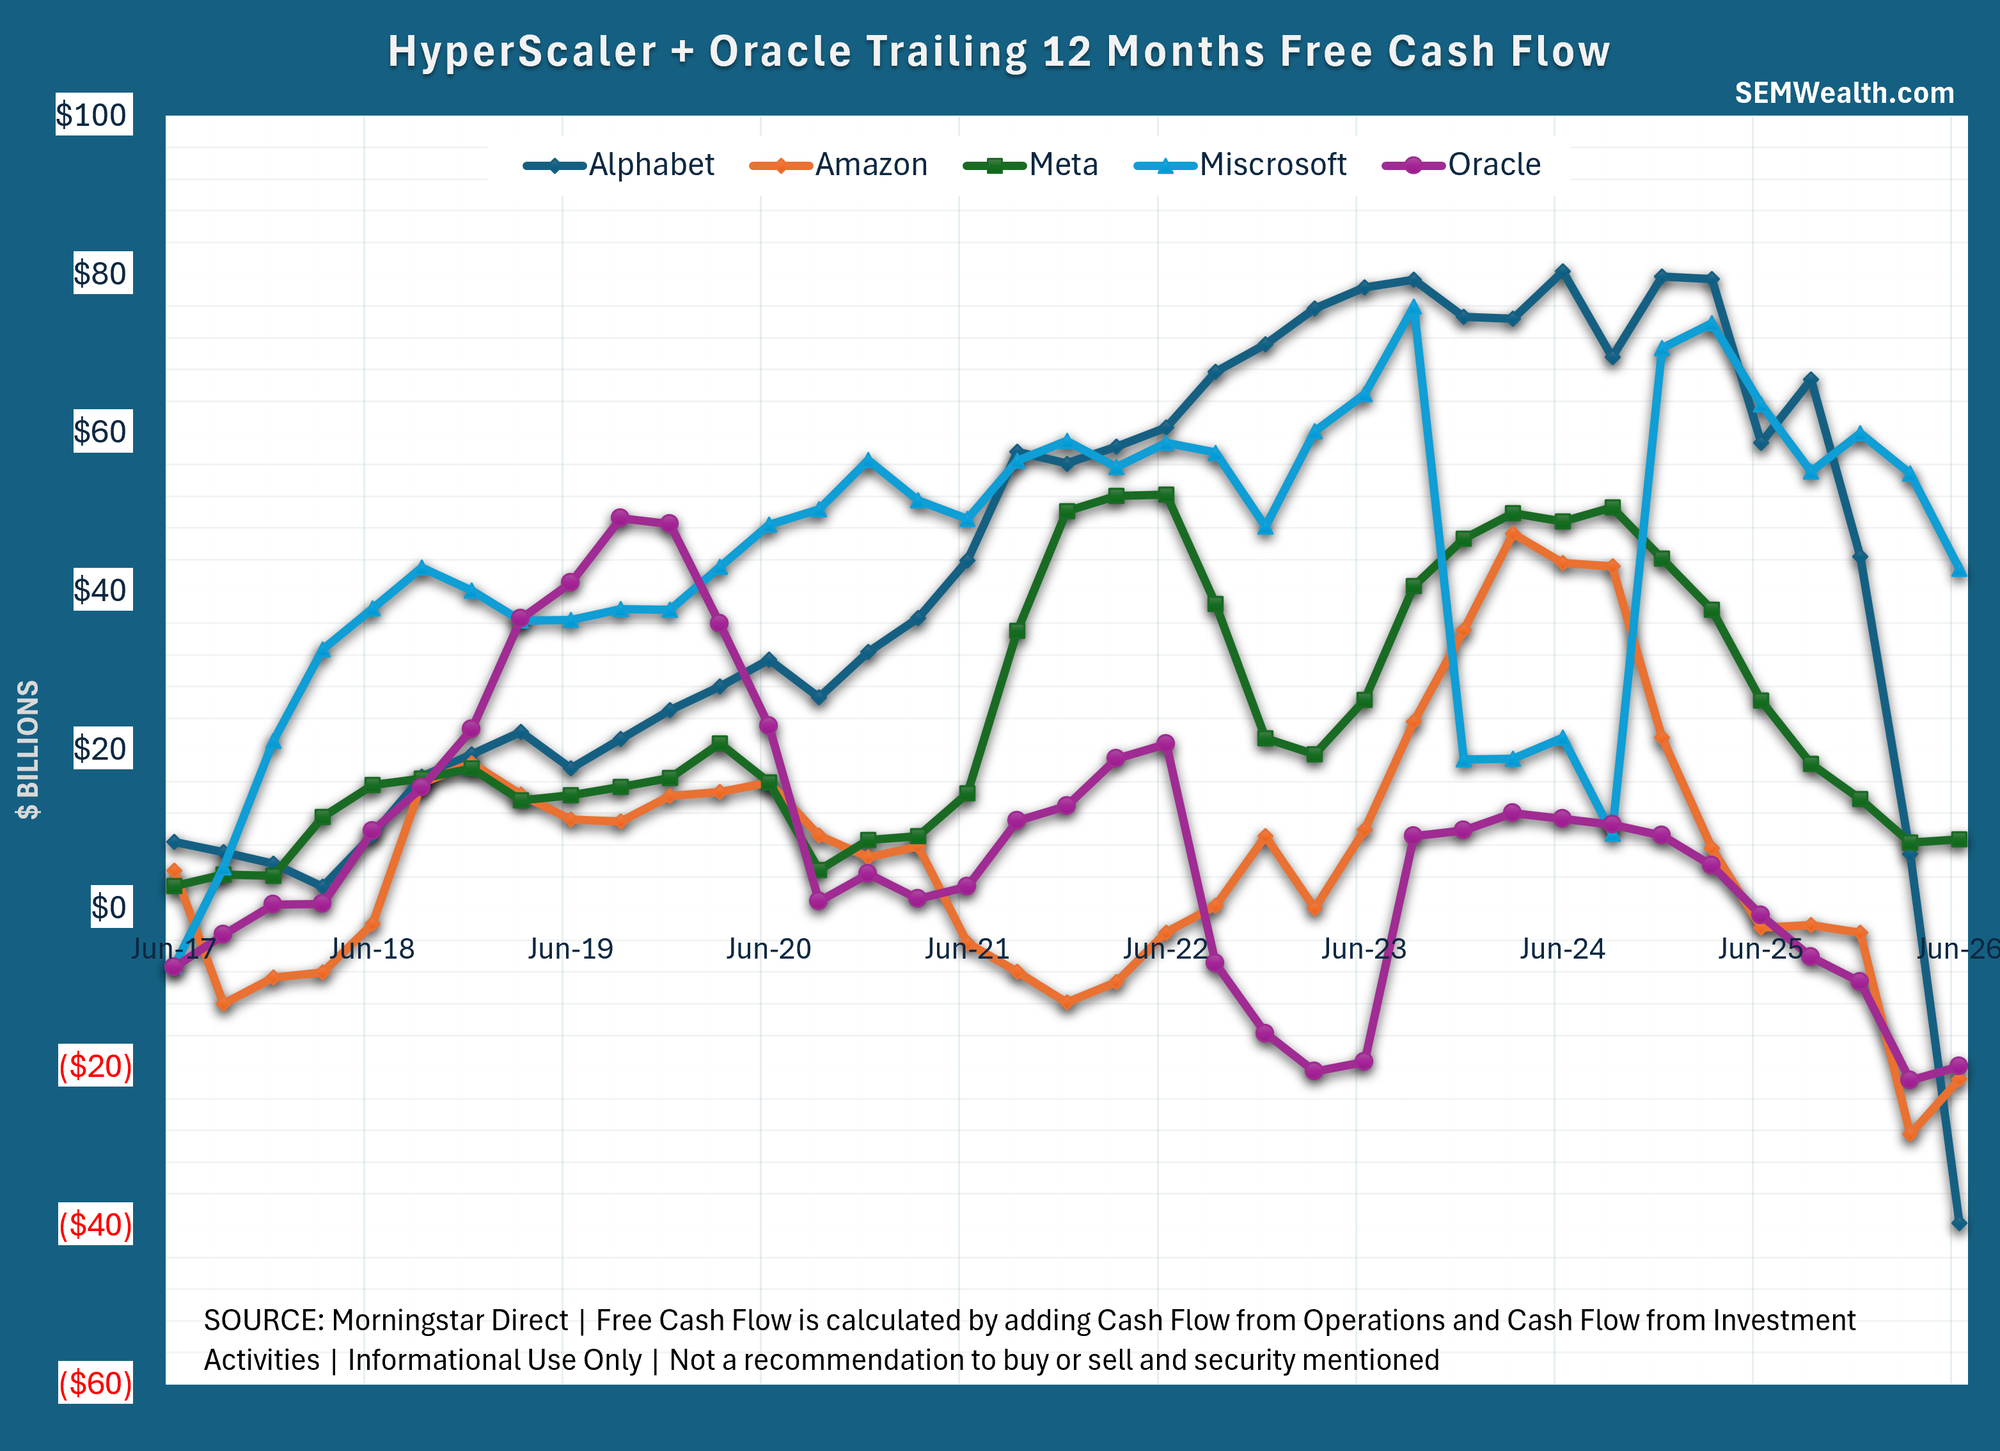
Why did Google's stock go down? Because not only did their trailing 12 month Free Cash Flow (FCF) go negative (which explains why they are raising an estimated $85 Billion in the debt and equity markets), but the INCREASED their 2026 capital expenditure (CapEx) by another $15B to the $195B-$205B range. This was after a similar increase following the first quarter results.
This is just another data point that confirms, "The AI Buildout is getting more expensive". The question is are investors going to tolerate continued increases, will the bond market be able to support the increased debt issuance, and when will the companies see a strong enough return on this investment to justify the spending? If you've been chasing stocks higher, you better be confident with your answers.
War, Inflation, and the Fed
Another theme – "Inflation is becoming more structural", continues to show up in corporate earnings releases and we are seeing various impacts. For instance, IBM's earnings are showing customers delaying other purchases due to spending on AI related hardware and software. Other companies are reporting higher than expected costs for electronics. Last week we showed a chart of the Producer Price Index (PPI) components WITHOUT energy. The trend is not good.
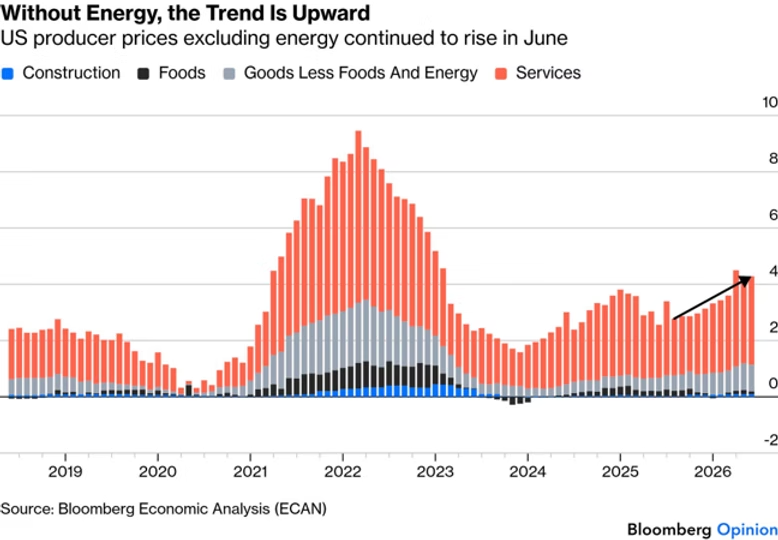
While I'm more concerned with the STRUCTURAL part of inflation (beyond energy), the last few weeks has not been good for those hoping the war with Iran was over and it would lead to lower energy costs. I don't think anybody knows when it will end. Even an "agreement" seems to not be worth much any more. Whatever happens, the increase in energy prices won't make the inflation numbers go the way we want and will also make the AI Buildout more expensive.
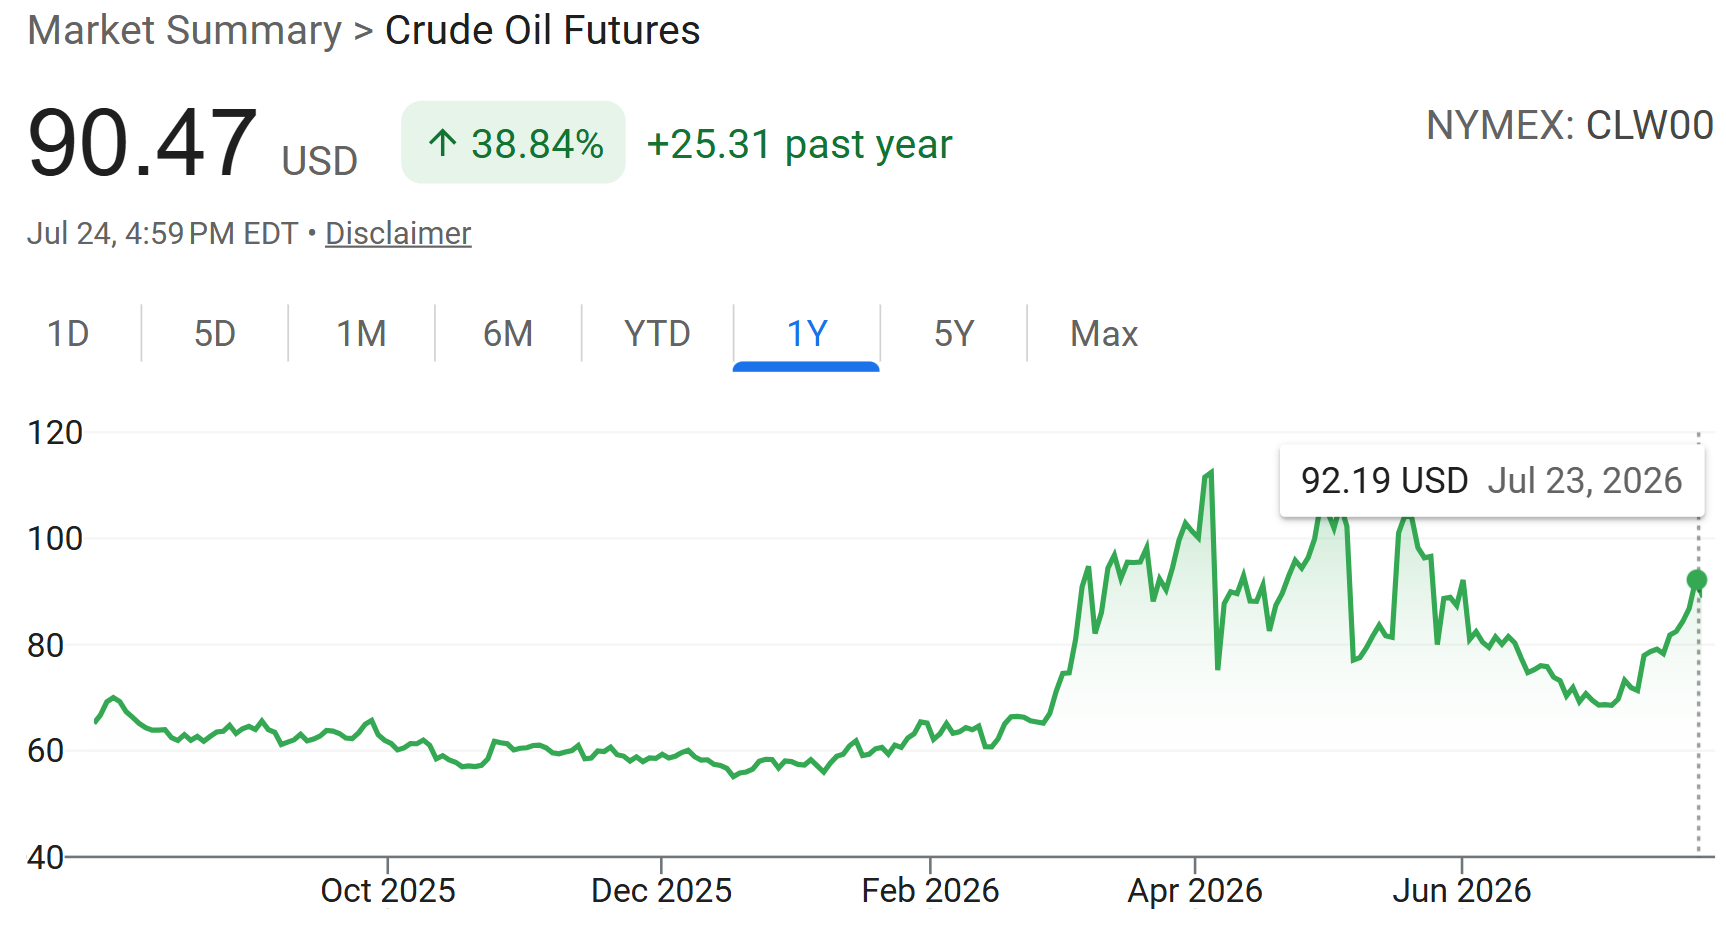
This brings us to our final negative theme – "The new Fed Chair is serious about inflation." We'll see how serious he is this week when the Fed meets. While the consensus is around 35% believing the Fed will hike rates this week, it jumps to about 80% by September. As I've said all along, from a long-term economic perspective, that's not a bad thing. Over the short-term, however, it will cycle back to the first theme – "The AI Buildout is getting more expensive."
Fun with AI
If you've been around me much you would know I've been using paid versions of the mainstream LLMs for several years. I am a big believer in the opportunities this new technology will bring. I'm certainly not an expert user, but I believe (based on chats with ChatGPT and Gemini – it was a prompt I'd seen going around on social media to ask your LLM where you rank in compared to other users) that I'm in the top 5% of users. You may have noticed the cover image I used to illustrate our on-going market theme this summer. I did this after watching our son-in-law on our family vacation use Chat GPT and then Canva to create a comic book for his 5-year old nephew (our grandson) from scratch over 4-5 days. He took pictures of the action figures our grandson wanted to use and then had him narrate what he wanted to happen. It was pretty impressive what could be done, but also we saw some definite "AI slop" that had to be caught, such as when Corryn asked if we were going to do anything about the third arm "Bear Friend" had in one of the illustrations. While I am a nerd, this was the first comic book I've read, so I may not be a good judge, but it was pretty fantastic. I can't wait to see what happens in the 2nd issue of the Construction Guys. Anyway.....
I had shared in our family group chat my frustration with what I thought was going to be a simple Saturday morning task after this series of comical, but frustrating results from ChatGPT (which has once again surpassed Gemini in my opinion in terms of quality of images generated......as I've learned the next version of Gemini might surpass OpenAI, so it will require on-going tests and trail and error.) Here's SOME of them......
Chat GPT attempt 1.6 (I was getting close until I suggested the new Fed tank should be shooting down the old Fed helicopter.)
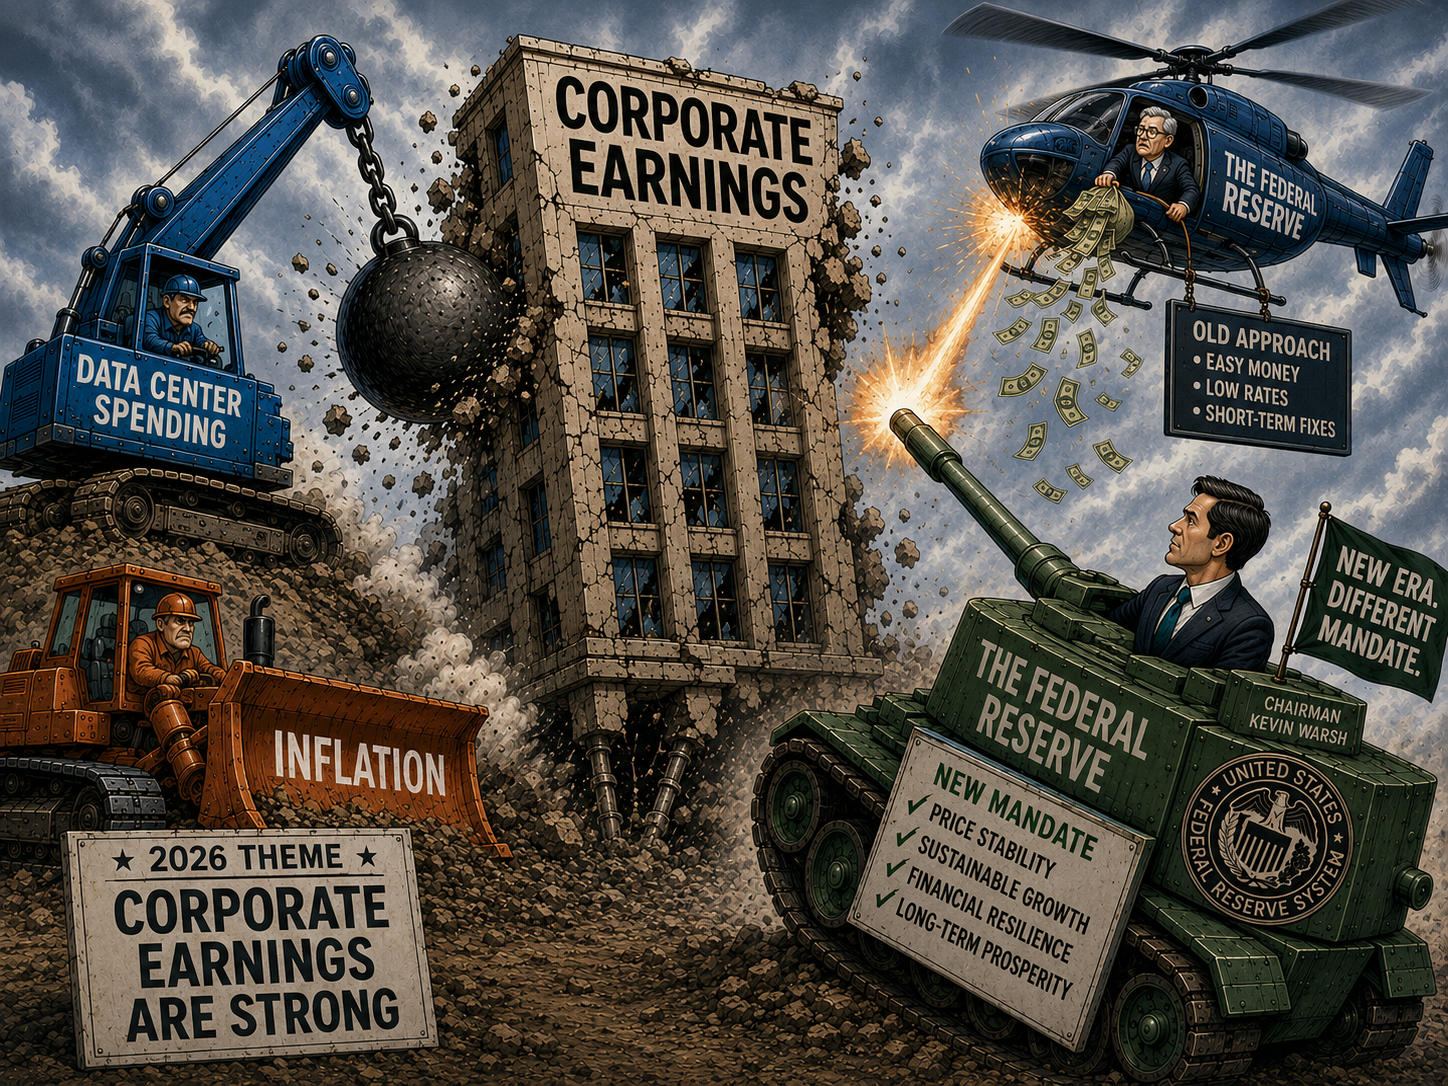
The next tweak was even more comical. Here is Chat GPT attempt 1.7
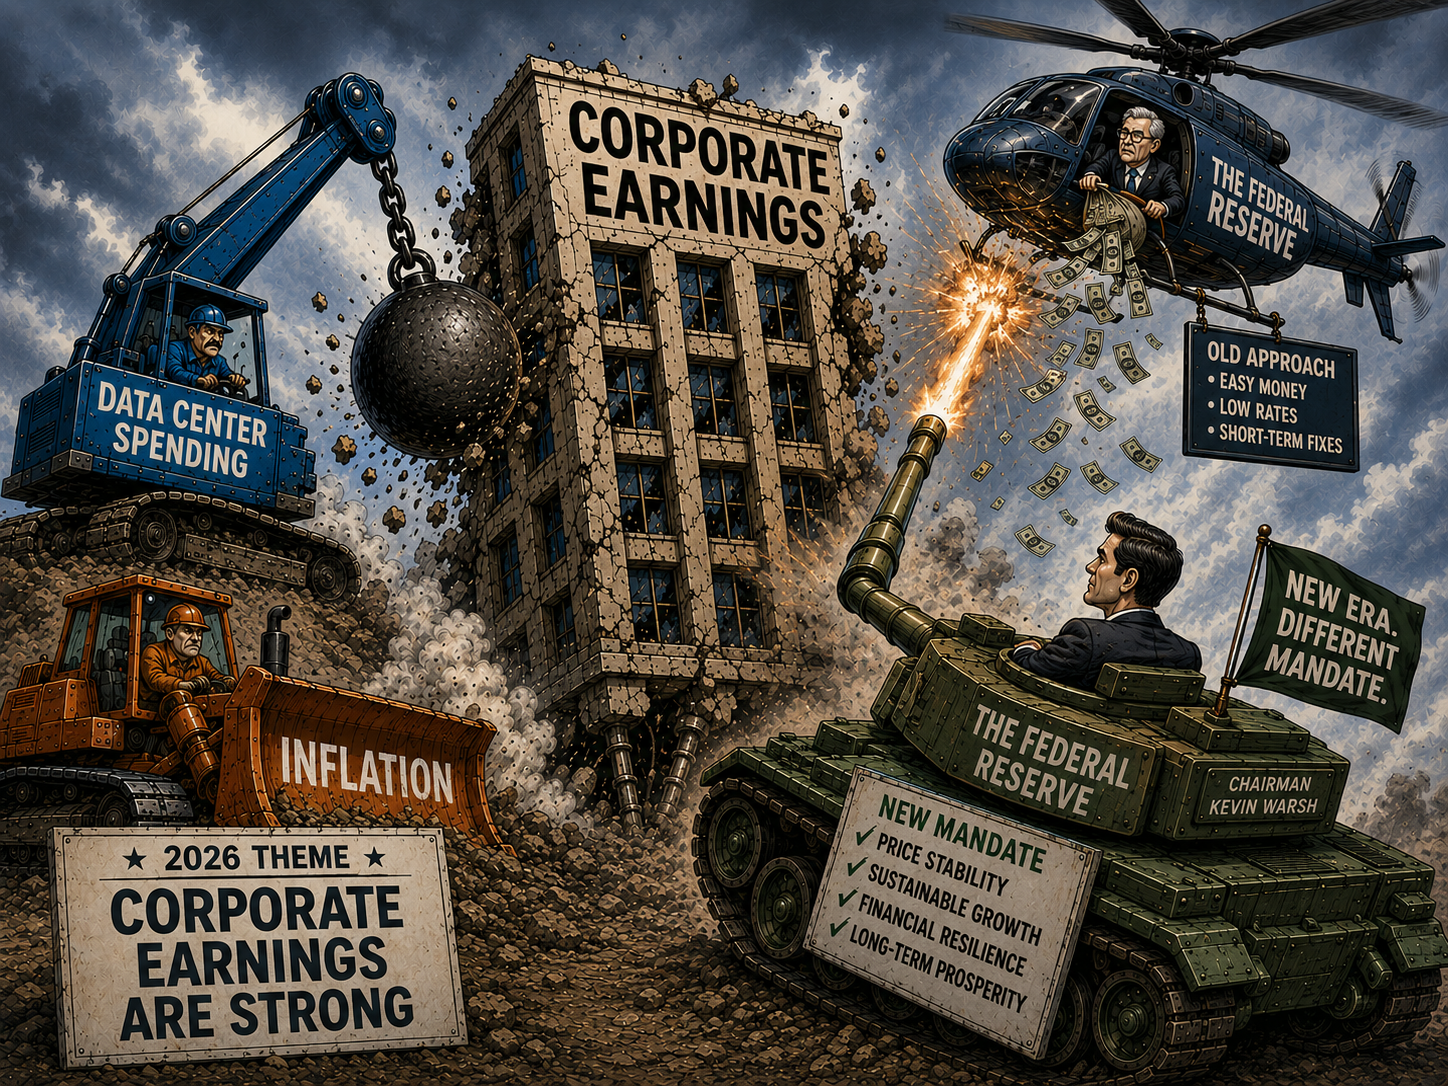
Dustin suggested I describe what I wanted to another LLM (in this case Gemini) and then ask what prompt I should use to generate that image. I gave that a try and ended up with this, Chat GPT attempt 2.1
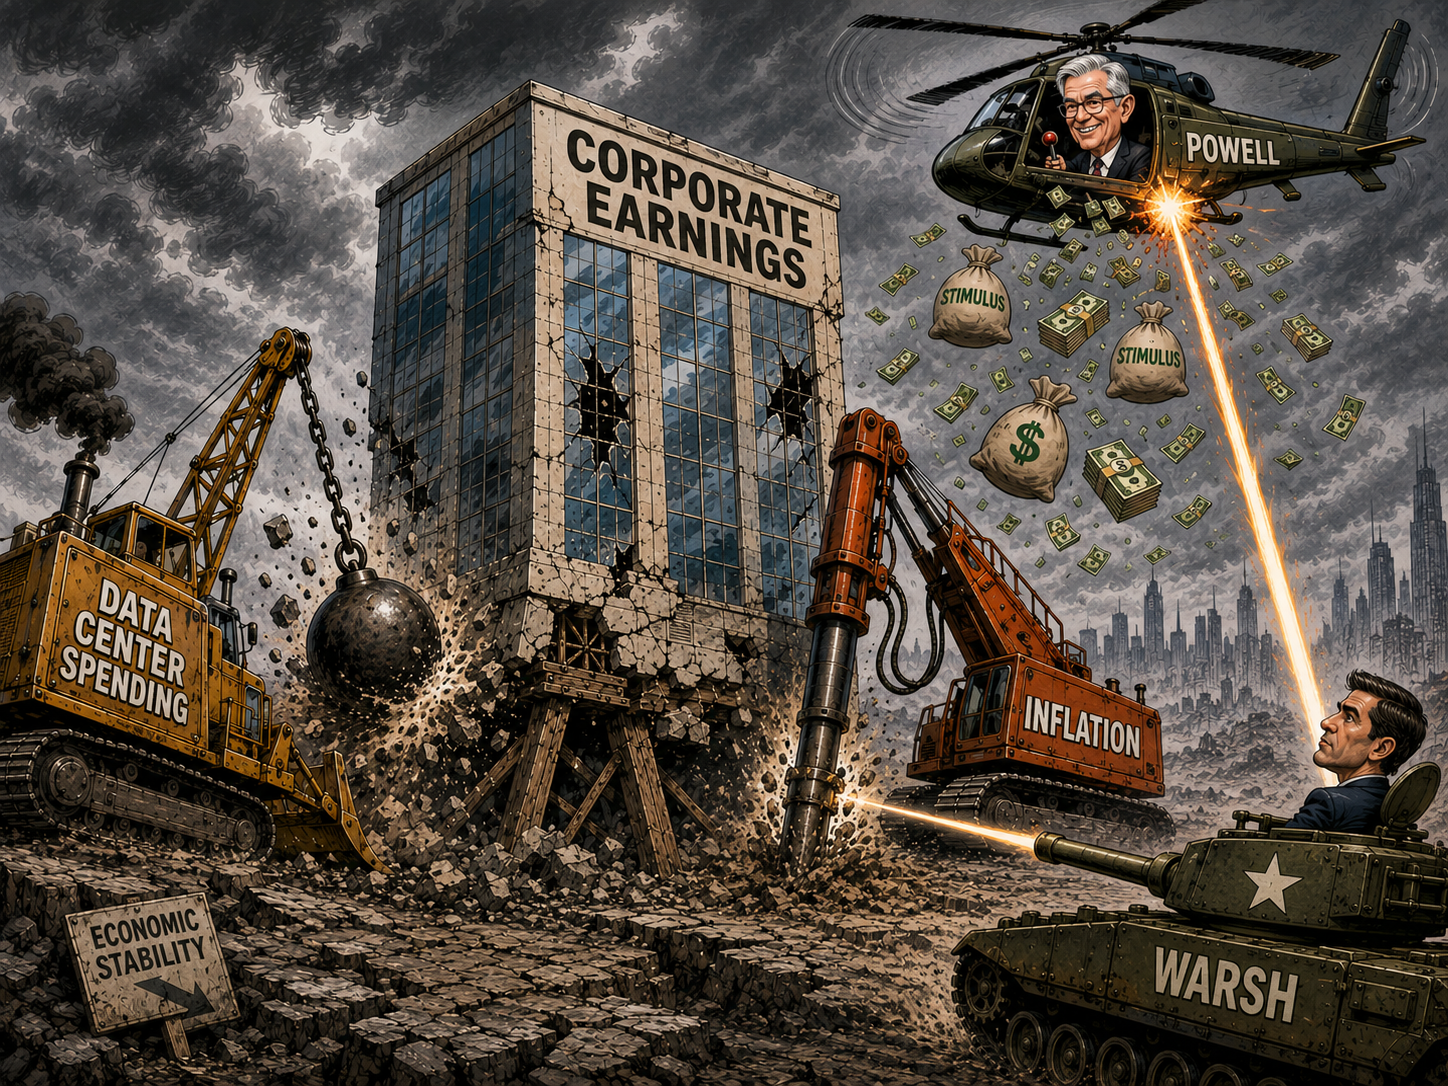
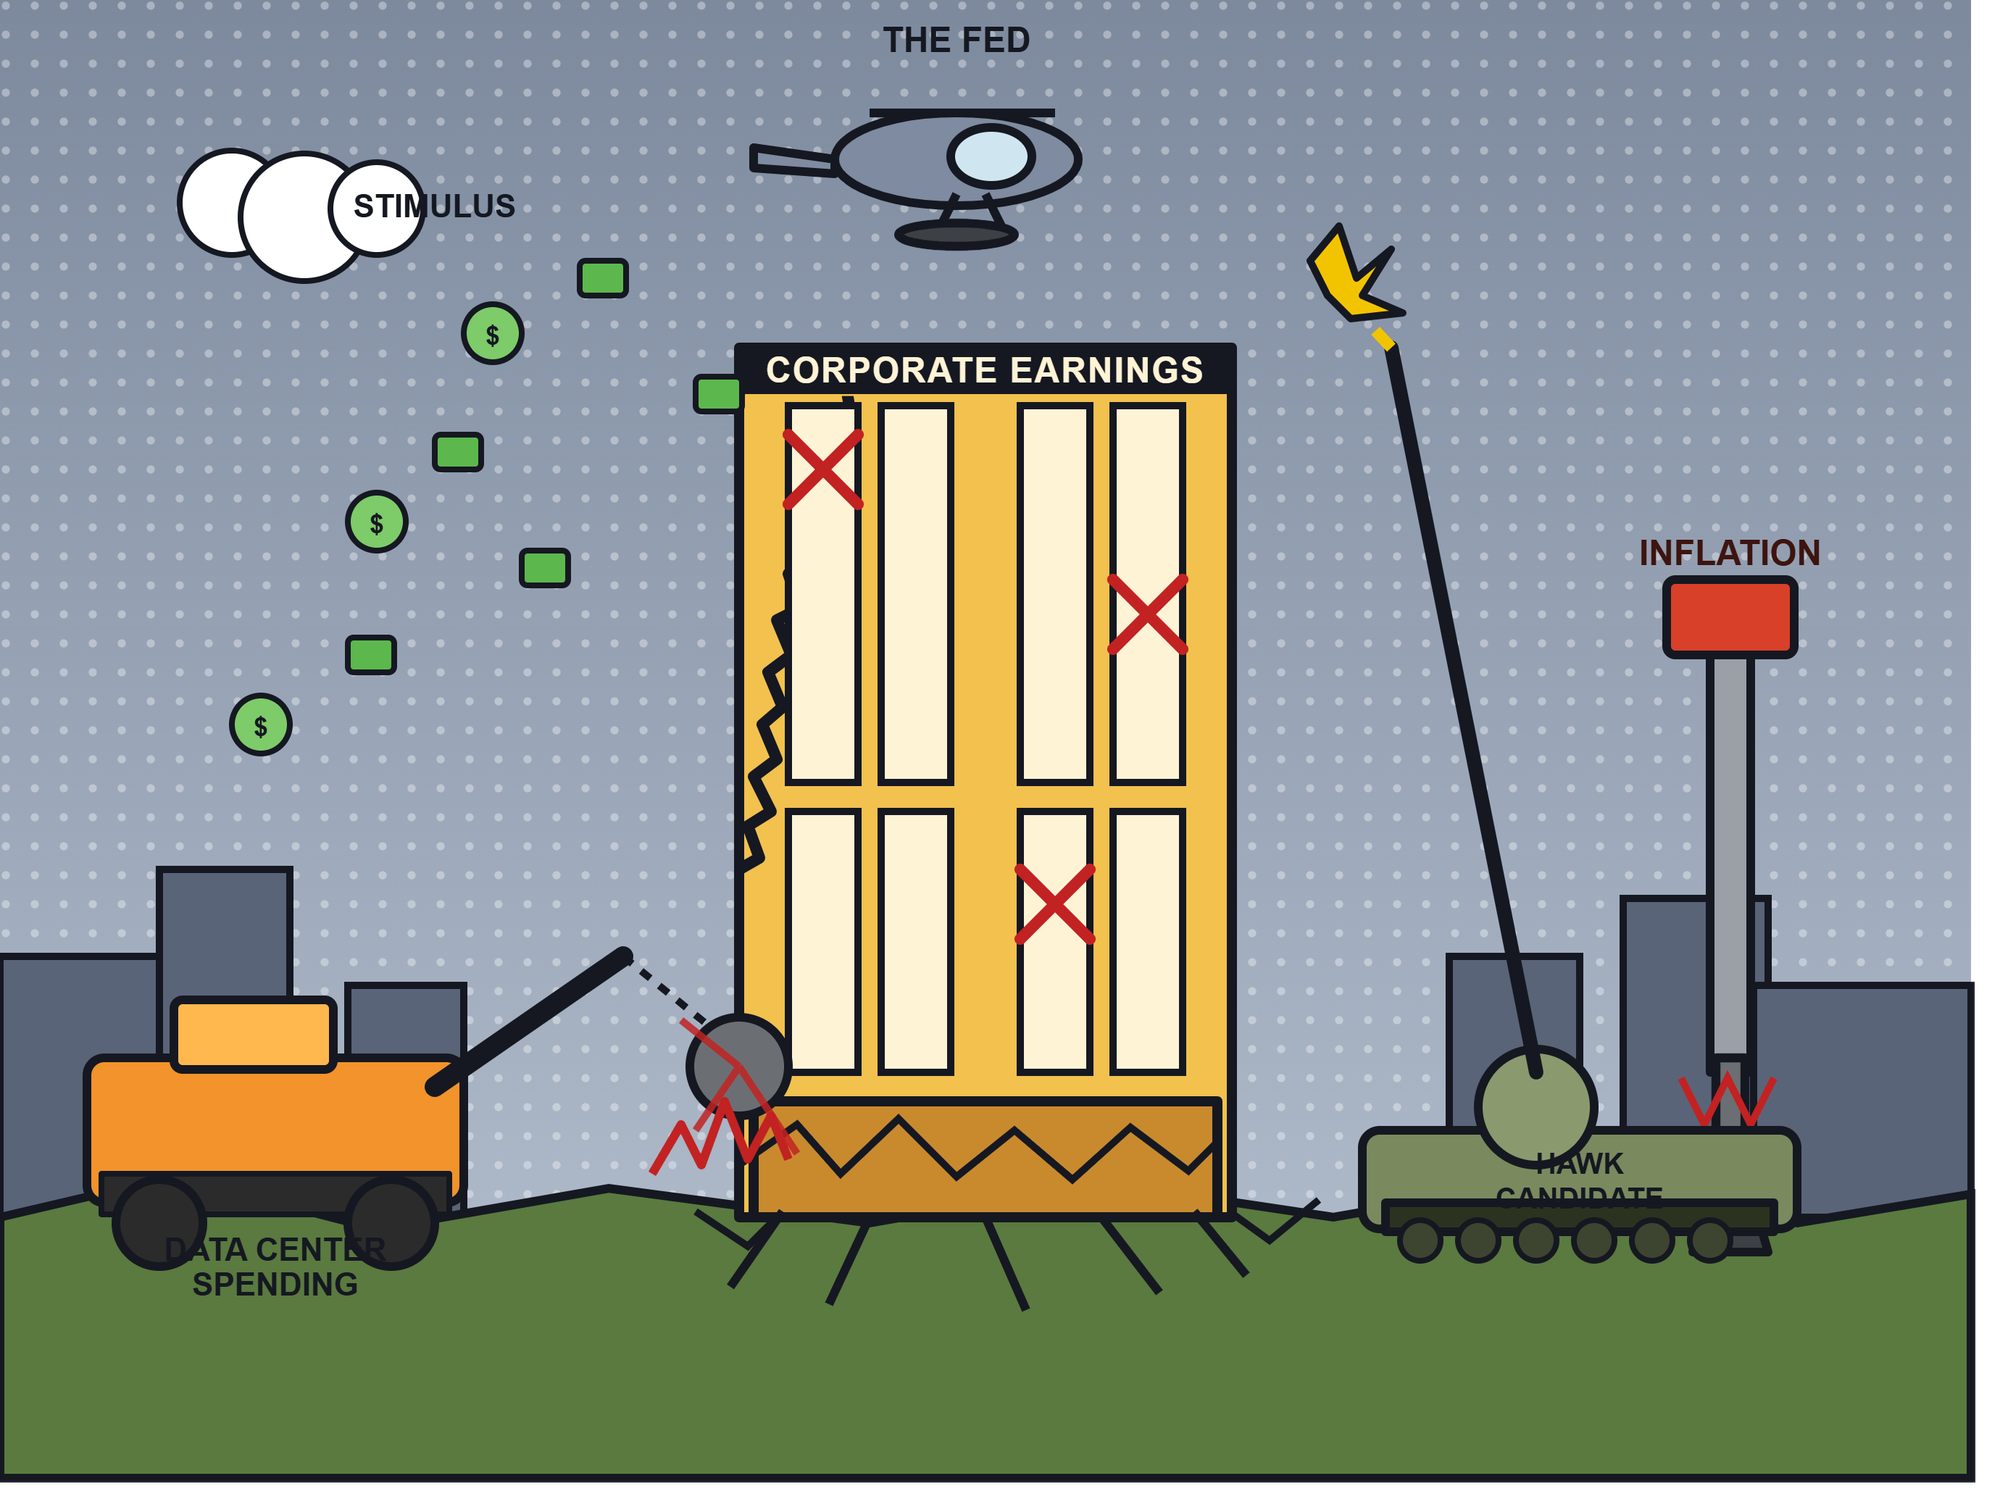
As you can see, the AI still can't conceptualize a realistic looking shot from a tank. I then decided to take the same prompt and use it with Claude, Gemini, and CoPilot. I know Claude isn't best used for image generation, but this gives me CoPilot circa 2023 vibes....Claude attempt 1.2 (it was the only LLM which said it couldn't use caricatures of real people and thus had to "conceptualize them".
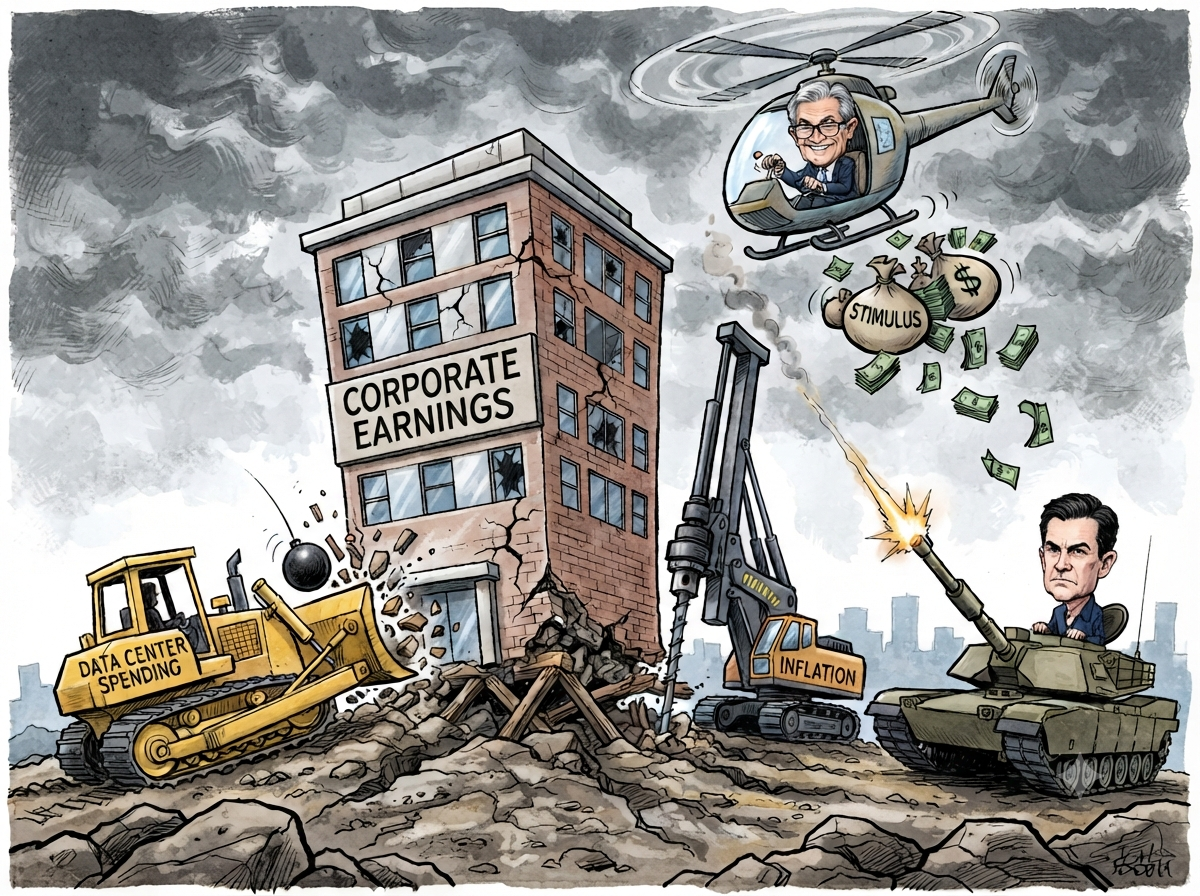
Gemini was much better and I would have gone with it other than the fact it could not get anywhere close to the tank driver looking like Kevin Warsh. Instead it kept giving me a younger looking Jerome Powell. It also missed the sign I had asked for in the bottom, despite numerous attempts. Here is Gemini attempt 1.4
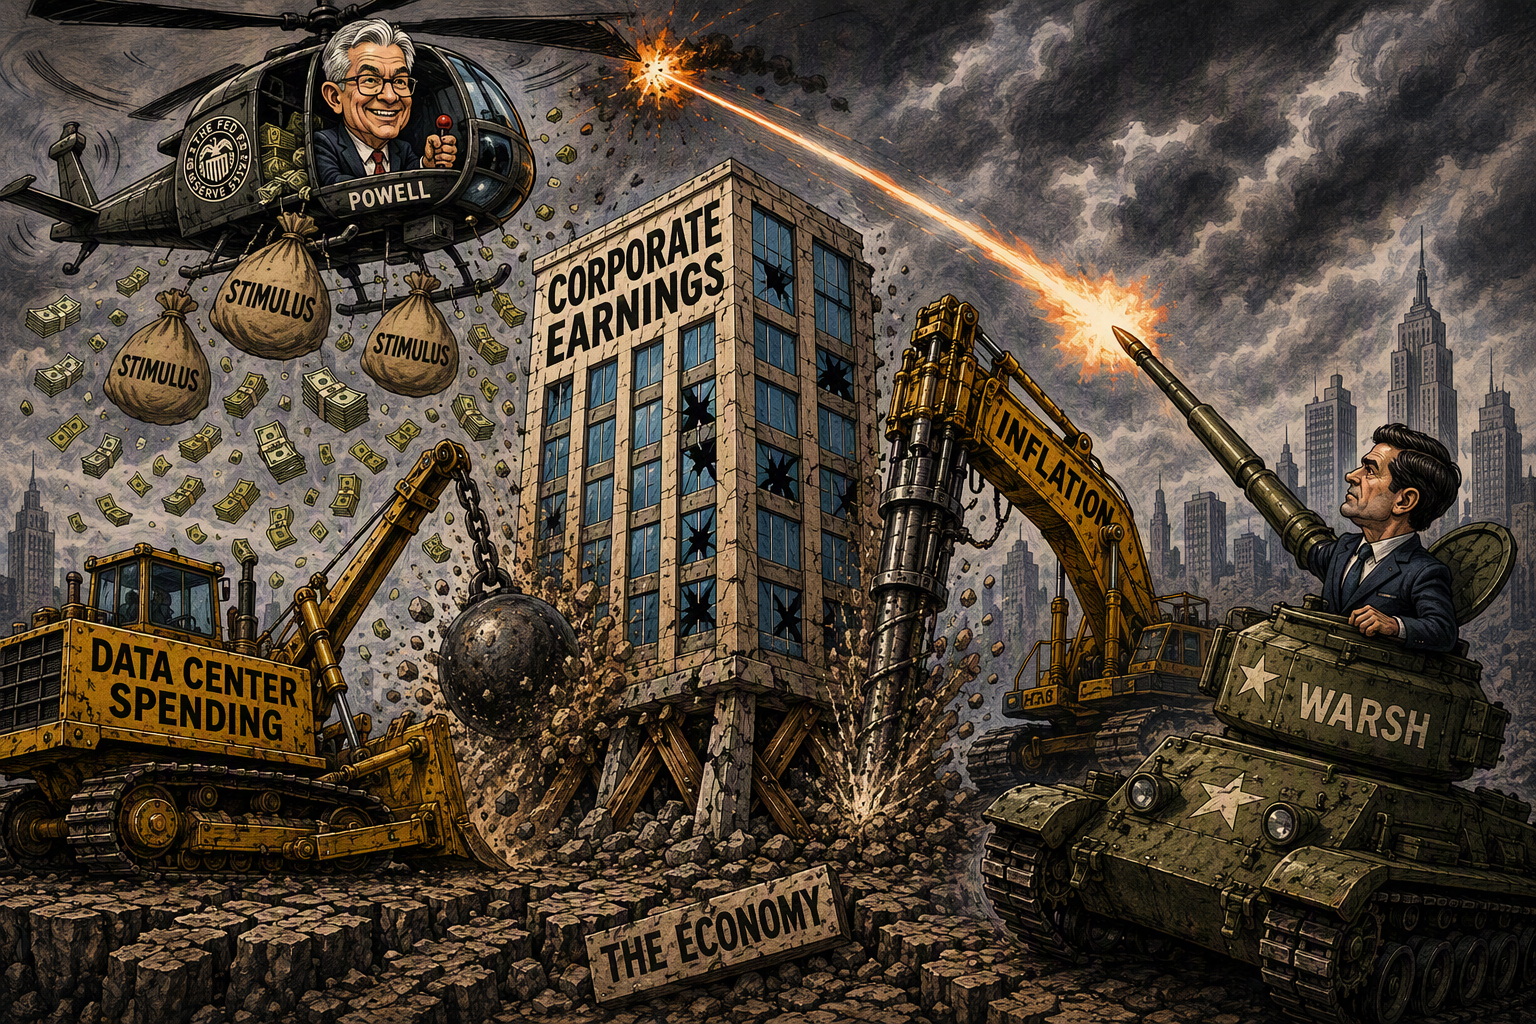
CoPilot, which uses OpenAI (the creator of ChatGPT) has gotten much better in image generation. It looked much more similar to the ChatGPT results. Here's CoPilot attempt 1.2. I'm not sure what to think of the turret and what is being fired, but it is close.
So despite all that work, I ended up going with the numerous tweaks I had already made and settled on ChatGPT attempt 1.9 (my original prompt with lots and lots of tweaks) even though there are some things in there I would still correct:
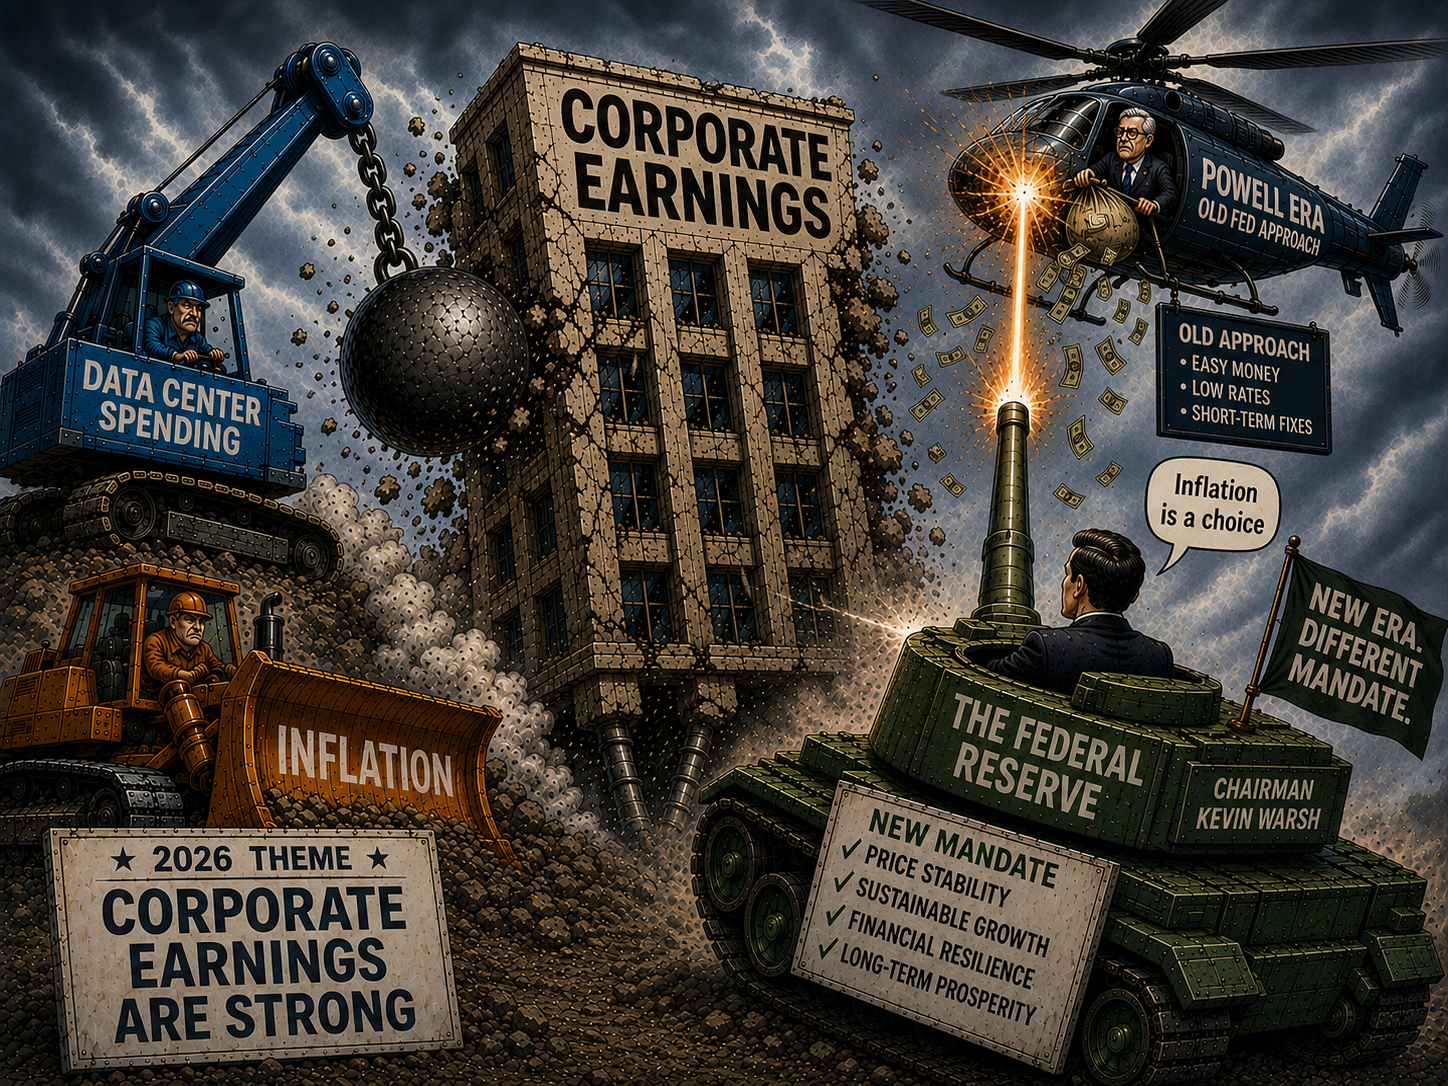
So did AI save me time? I'm not creative and thus cannot imagine making this image, so maybe. However, what I thought would be a fun little 15-20 minute project wasted 3 hours of a beautiful Saturday morning. At least I was doing it from my screened in porch to enjoy the 65 degree weather. This reminds me a lot of the late 1900s when I had 3 internet service providers because each one offered different types of data I used for my investment portfolios. I was constantly having to evaluate new services, new pricing models, and changing the way I interacted with those services in my day-to-day life.
Am I more productive now? I couldn't even put a number on how much more I can accomplish each day than I did last century. Was I more productive from 1994-2003? Most certainly not. I spent HOURS accomplishing things I thought would take me 15-20 minutes. I spent WEEKS or MONTHS updating all of my tools when I switched to the "next big thing". Transitioning over to George's Chart of the Week and tying this all together, one of his big projects is updating our economic model, which was built in Excel 5.0 and overhauled in Excel 2003. There are certainly better ways to get the data and keep all of our charts updated, and I'm hoping some of the new AI tools will help.
Forecasts and Fundamentals
Last week, banks kicked off the highly anticipated season of earnings reports for the second quarter of the calendar year.
For many, Q2 is often the most watched season of the year because it captures the first half of the fiscal year, providing investors enough data to gauge whether full-year guidance is on the right path. By week four, roughly 80% of the S&P 500 companies have reported.
| Rhythm | Sector Reporting | Examples |
| Week 1 | Large Financials | JPMorgan Chase, Wells Fargo, Goldman Sachs |
| Week 2 | Financials, Start of Industrials & Healthcare | Bank of America, Morgan Stanley, Johnson & Johnson |
| Week 3 | Large Technology | Microsoft, Apple, Meta, Amazon, Alphabet |
| Week 4* | Technology & Consumer/Retail | Nvidia, AMD, Uber, Airbnb, Shopify, Disney |
| Week 5-6 | Remaining Mid-Caps, Smaller Companies |
Analysts track the fundamentals of a group of companies within a given sector and estimate how a company is expected to perform compared to the previous quarter, including any forward guidance provided by the reporting company's executive team.
The chart below shows actual S&P 500 earnings (dark blue line) versus analysts' estimates from 12 months earlier (light blue line), going back to 1995.
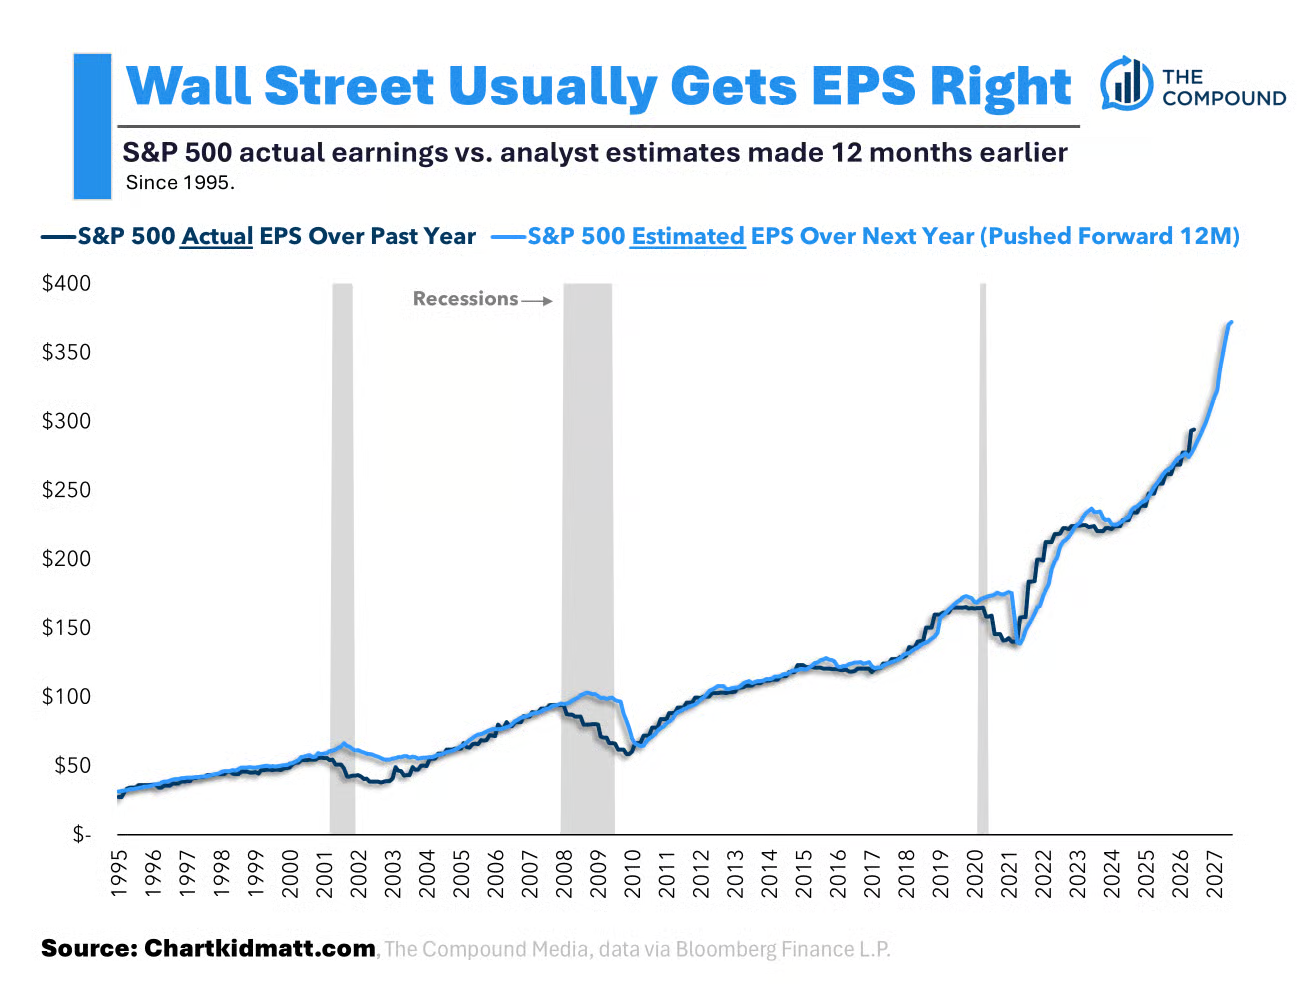
Most of the time, the lines are pretty similar. Pretty good, I'd say. However, since we don't have a crystal ball, earnings are far from the analysts' estimates made a year prior during recessionary periods – meaning that shocks are hard to project when, or if, they will occur.
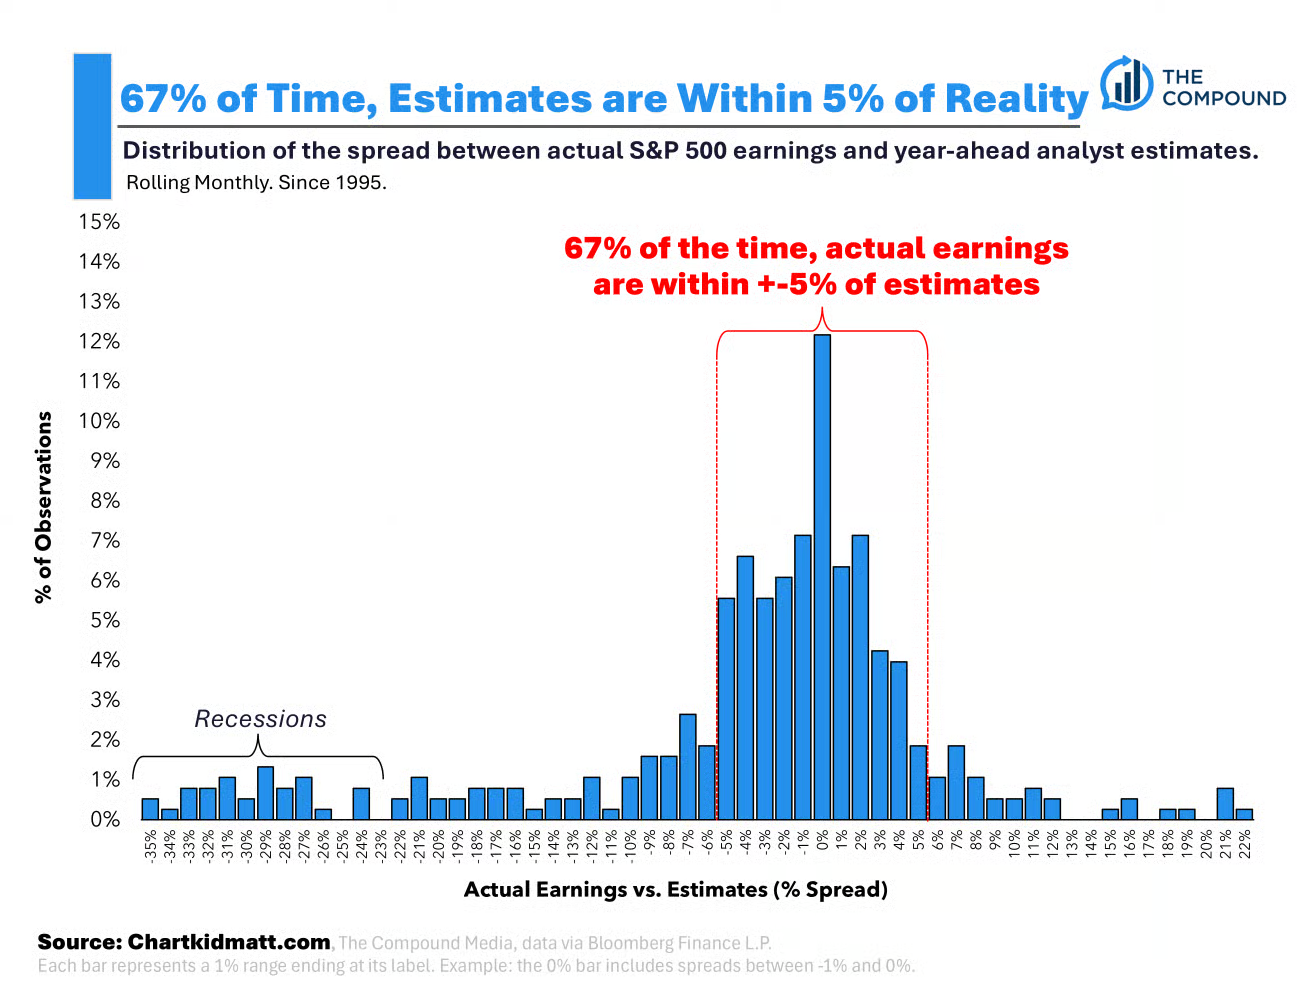
Outside recessionary periods, the spread between actual and estimated earnings shrinks to 1.5% (median across all periods), so the median estimate is essentially "in line" with reality. Conversely, if you think a recession is heading towards us over the next year, you would also think that it's acceptable to think that earnings are overstated. [Jeff's Note: The "surprise" of a recession is what usually causes the 'market shocks" which is where an unemotional, data-driven approach thrives. It's that "left tail" on the chart that SEM is attempting to manage within the financial plan, cash flow strategy, and investment personality of each client.]
At SEM, we understand the value of long-term investing, staying the course, and holding diversified investment portfolios while remaining flexible enough to adapt to changes in the market environment. One thing most people miss, however, is the risk of losing track of the financial plan or being invested in a portfolio that you either cannot afford the risks being taken or one where you will not stick to the plan due to the risks inside the investments.
So while we do see rising potential, the market could be entering a more dangerous environment, we are still happily participating in it inside our various investment models.
Thank you to all of the visitors who read last week's "Chart of the Week". I hope to continue sharing these talking points about markets, investing, etc., for you to share with family, friends, coworkers, or anyone along the way.
See you next time!
Market & Economic Data
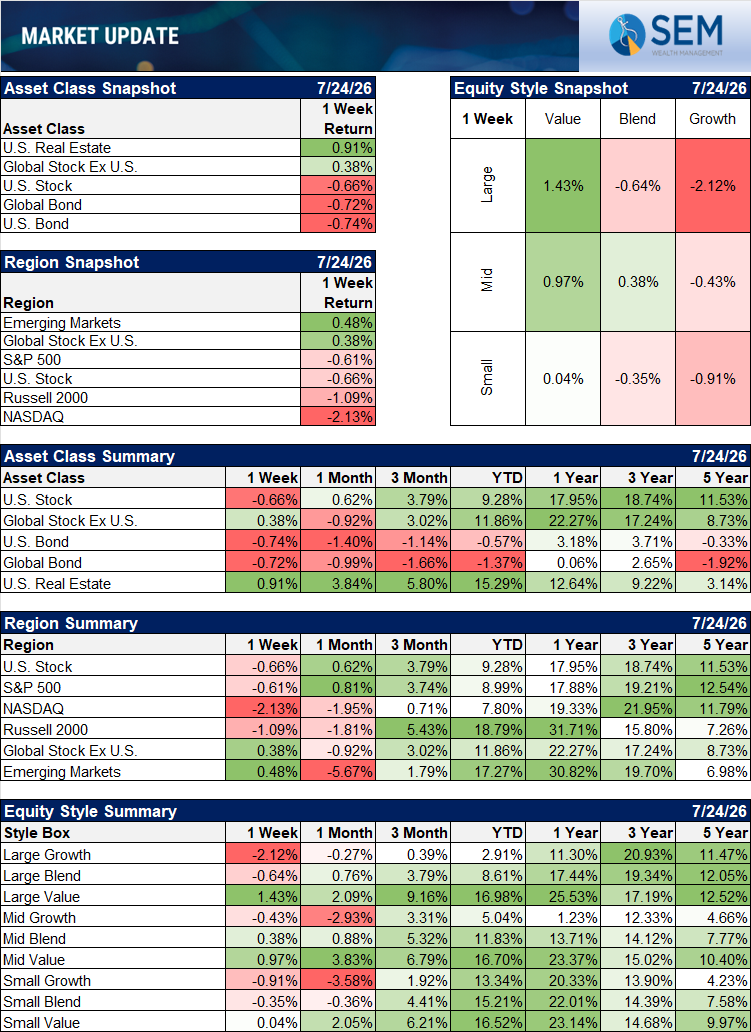
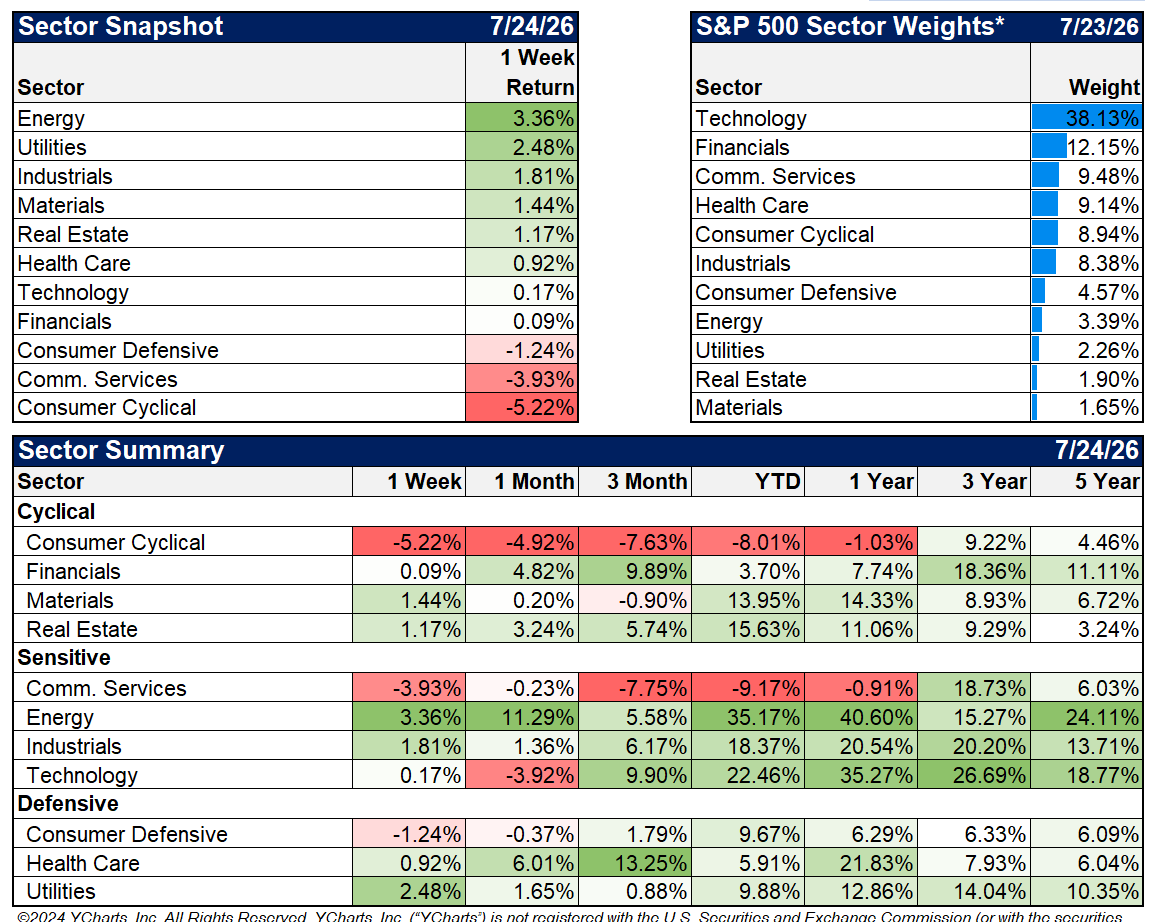
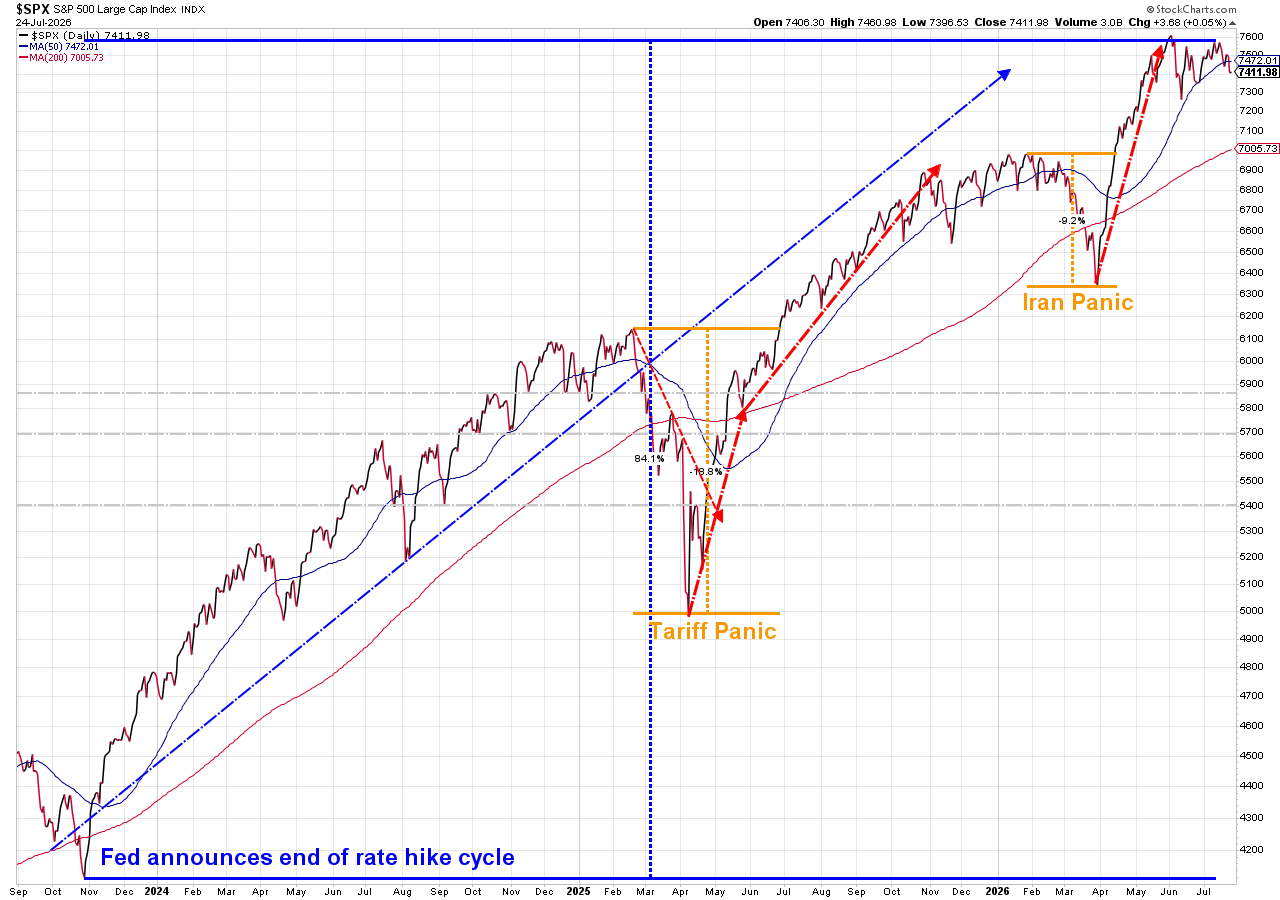
The S&P 500 closed the week back at the June 30 levels.
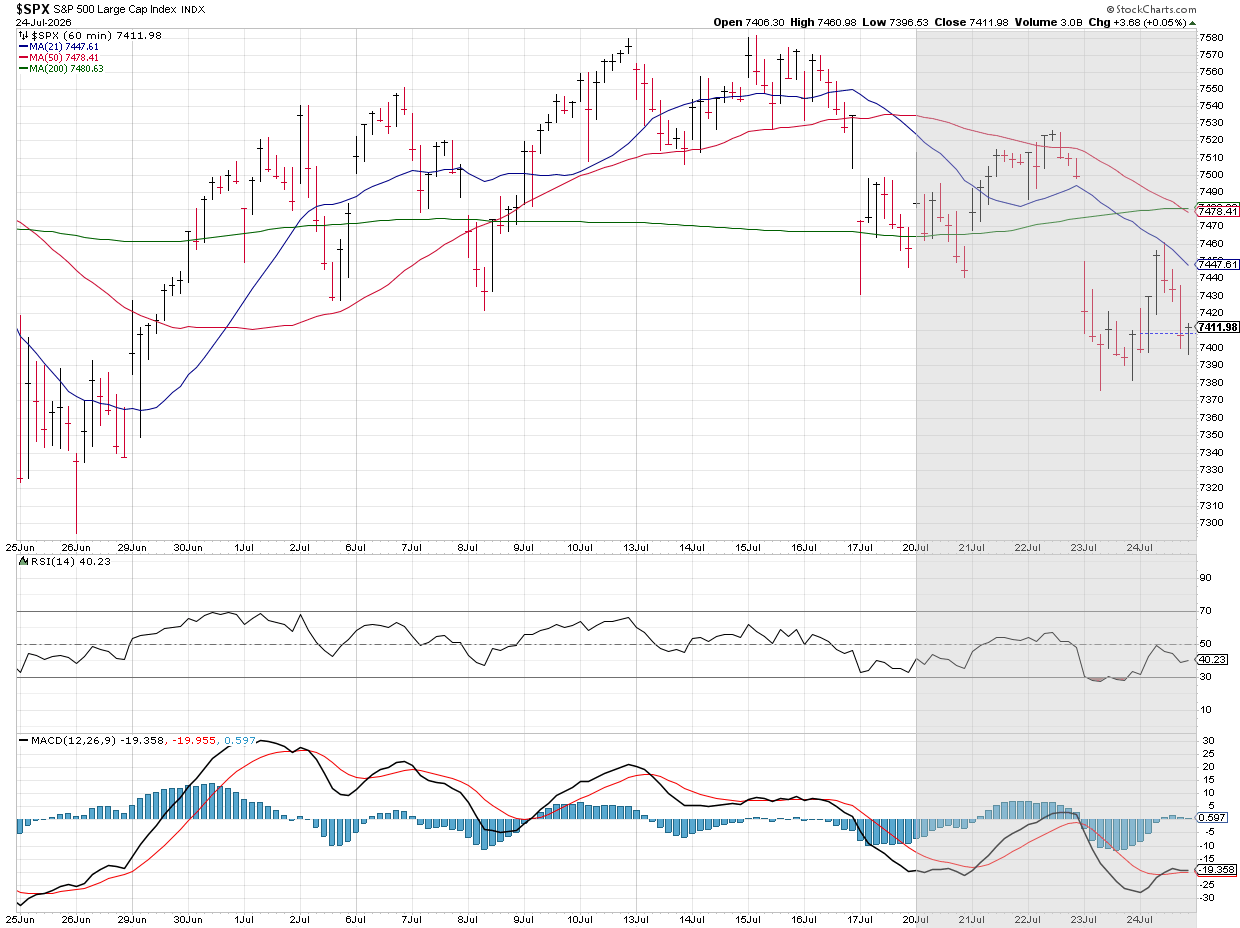
Going into Fed Week, it is interesting the market attempted several times to move above where it was during Kevin Warsh's first Fed meeting and has failed. What will this coming week bring?
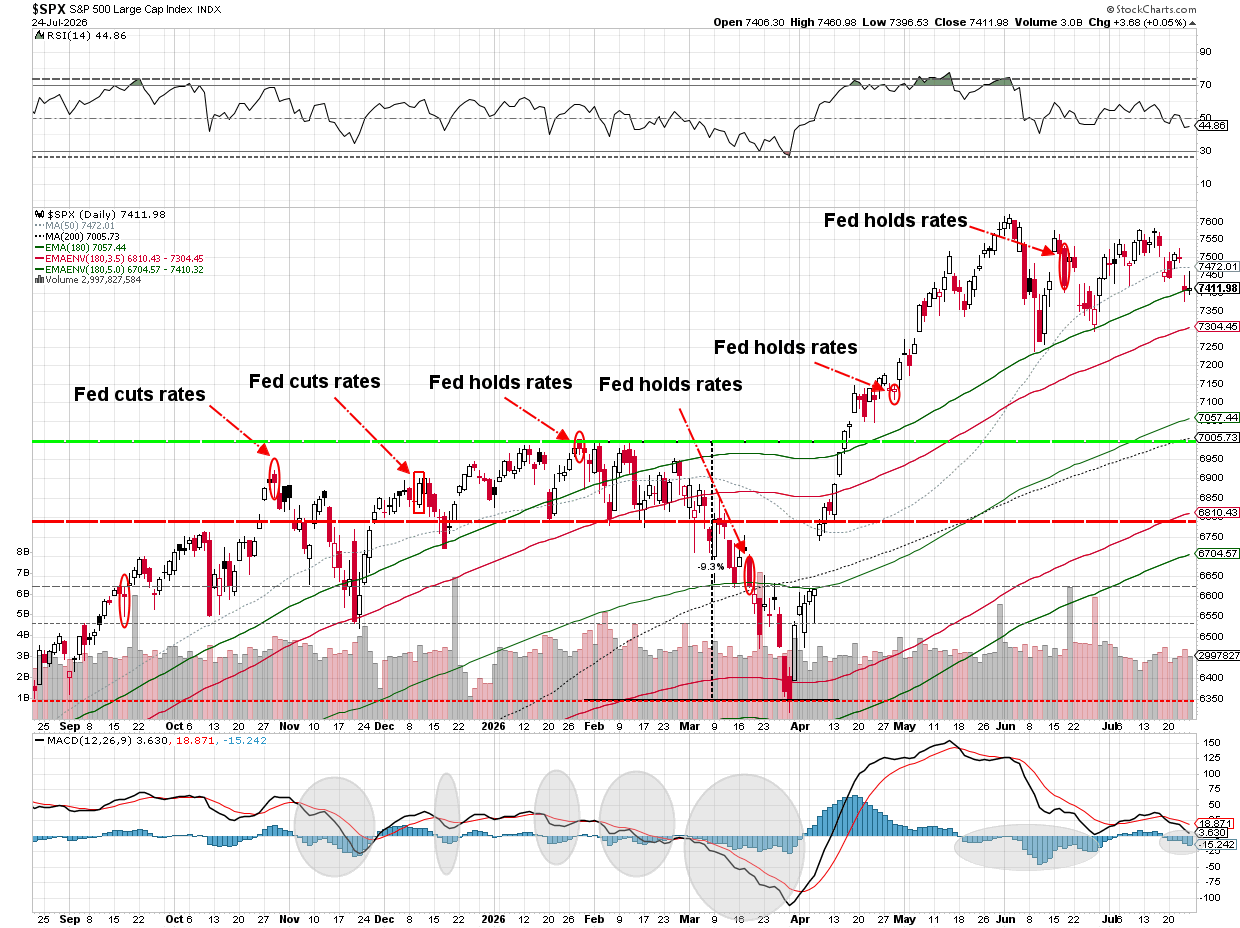
When we look at the chart going back to late 2023, we can see how spectacular the rally has been since the Fed announced they were done raising rates as well as since the first "deal" to end the war with Iran was over.
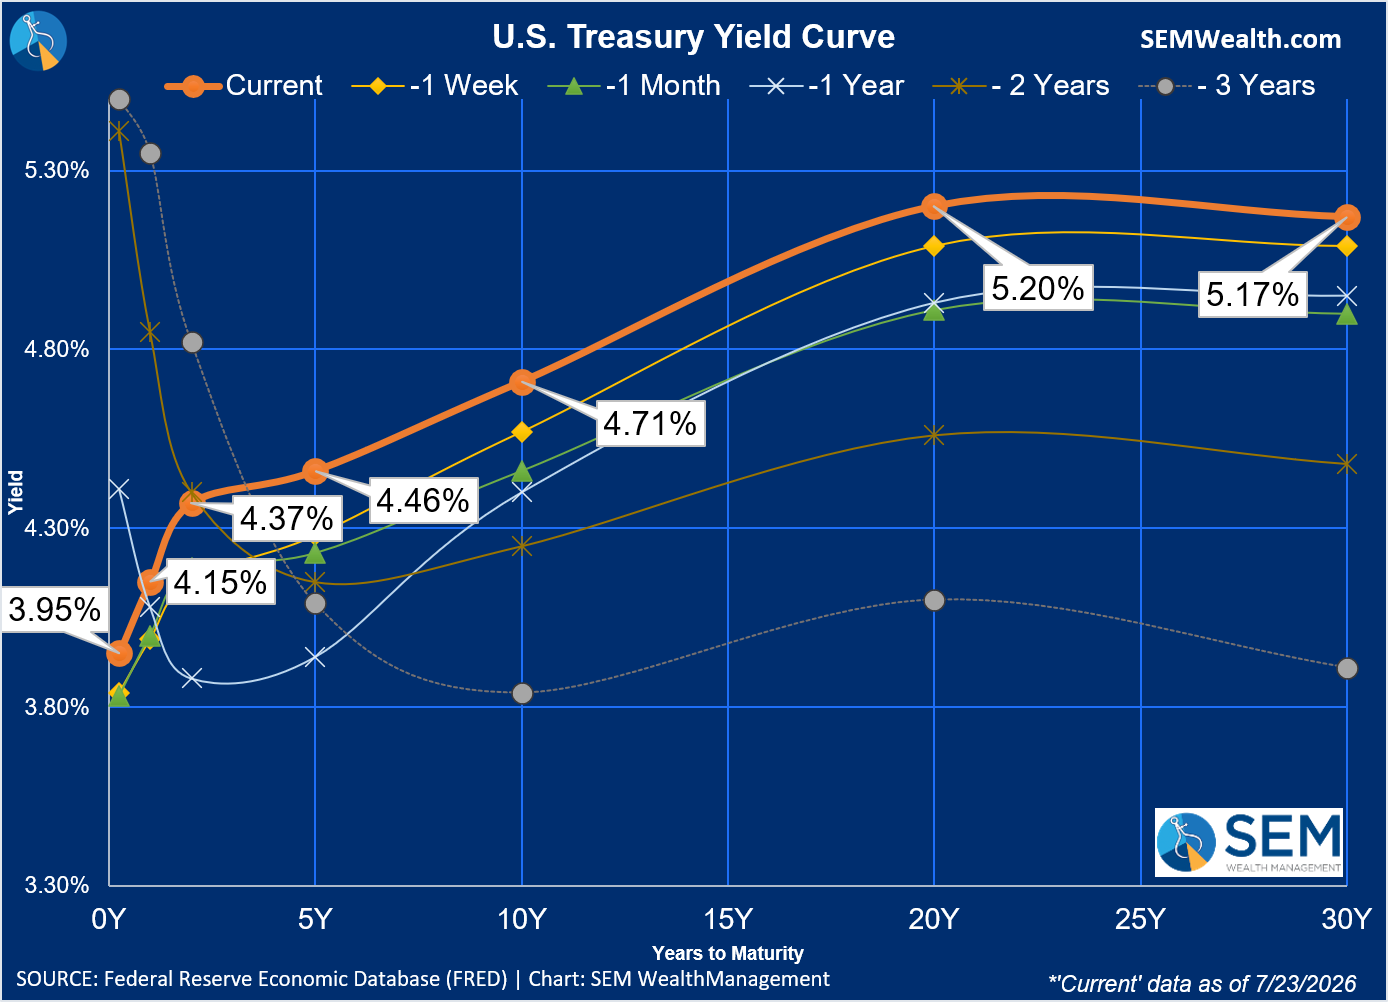
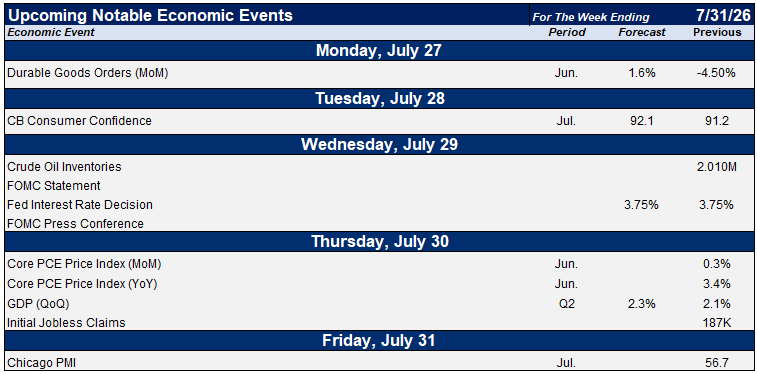
Interest rates moved up fairly significantly across the board last week. It could have been the resumption of hostilities with Iran (which is inflationary), the continued issuance of bonds by the hyperscalers to fund their AI Buildout, or something else. This week should be a big week for interest rates. Following the Fed meeting we have the release of the Fed's preferred (and more stable) inflation indicator, the PCE Price Deflator. We also will have the first estimate of 2nd Quarter GDP.
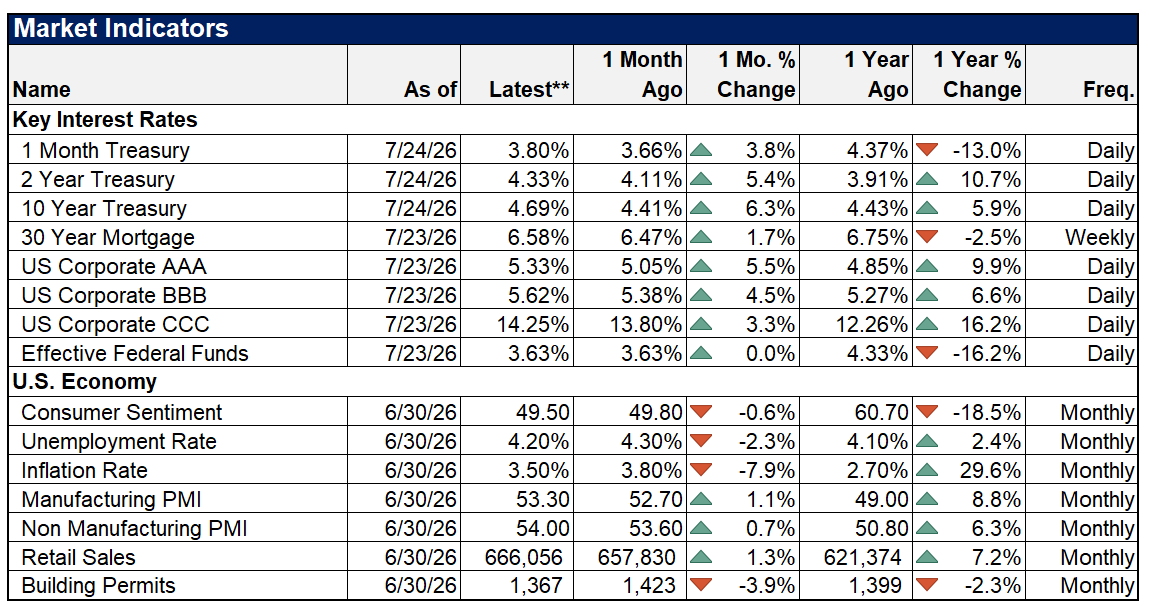
Economic Data
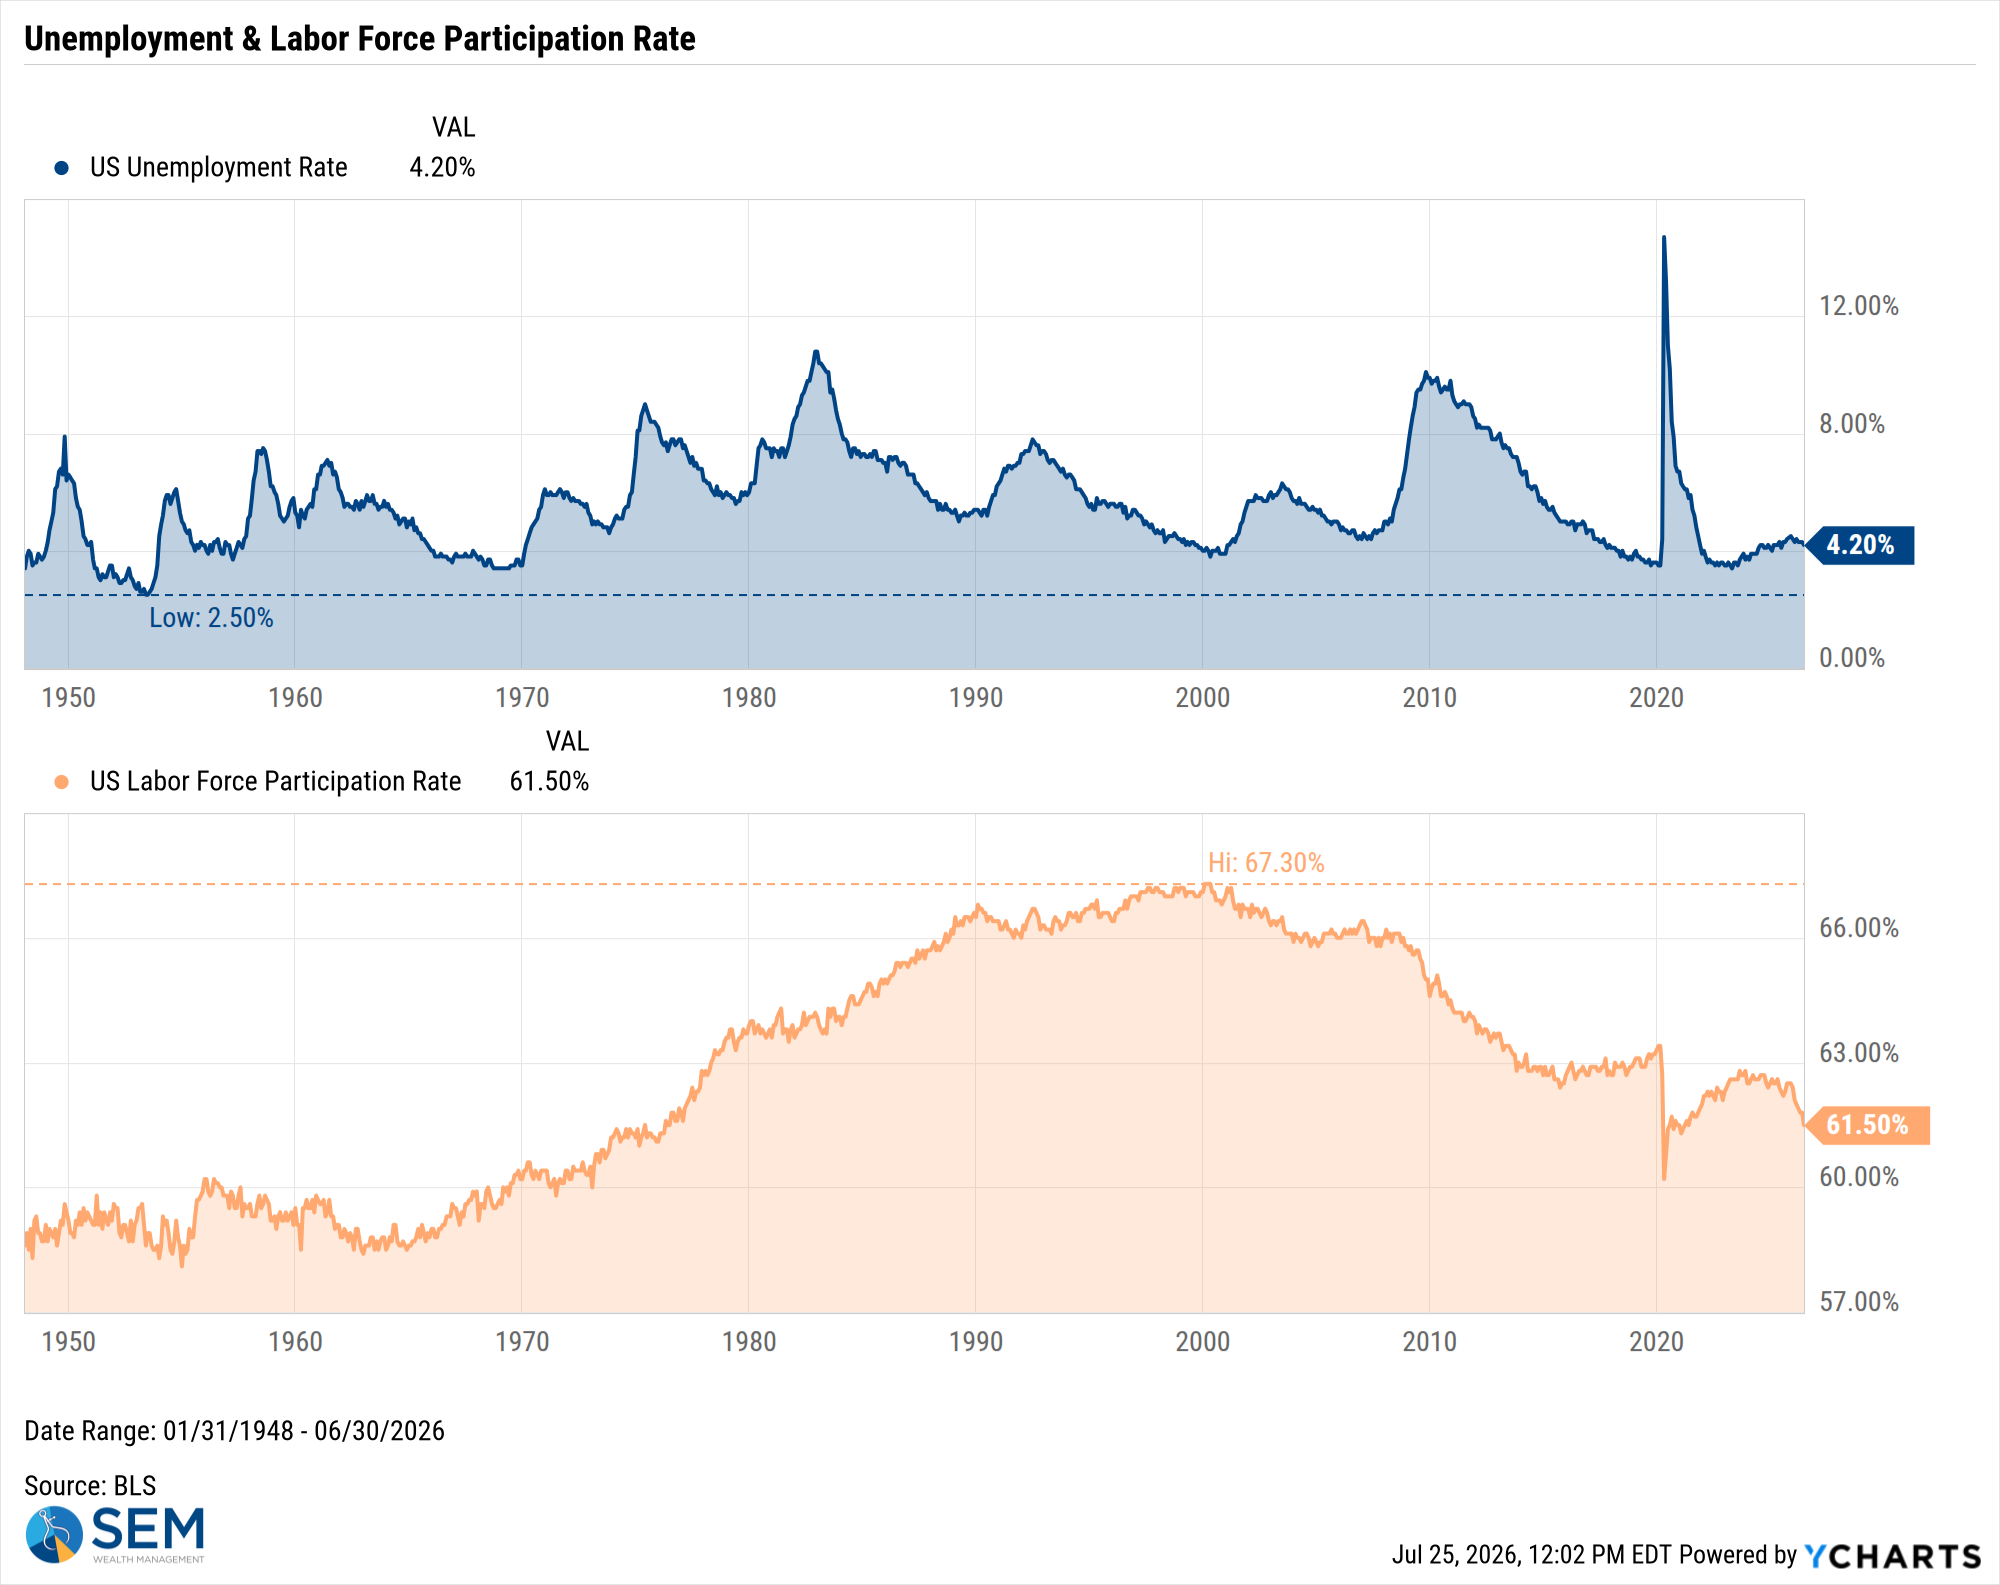
US Unemployment Rate data by YCharts
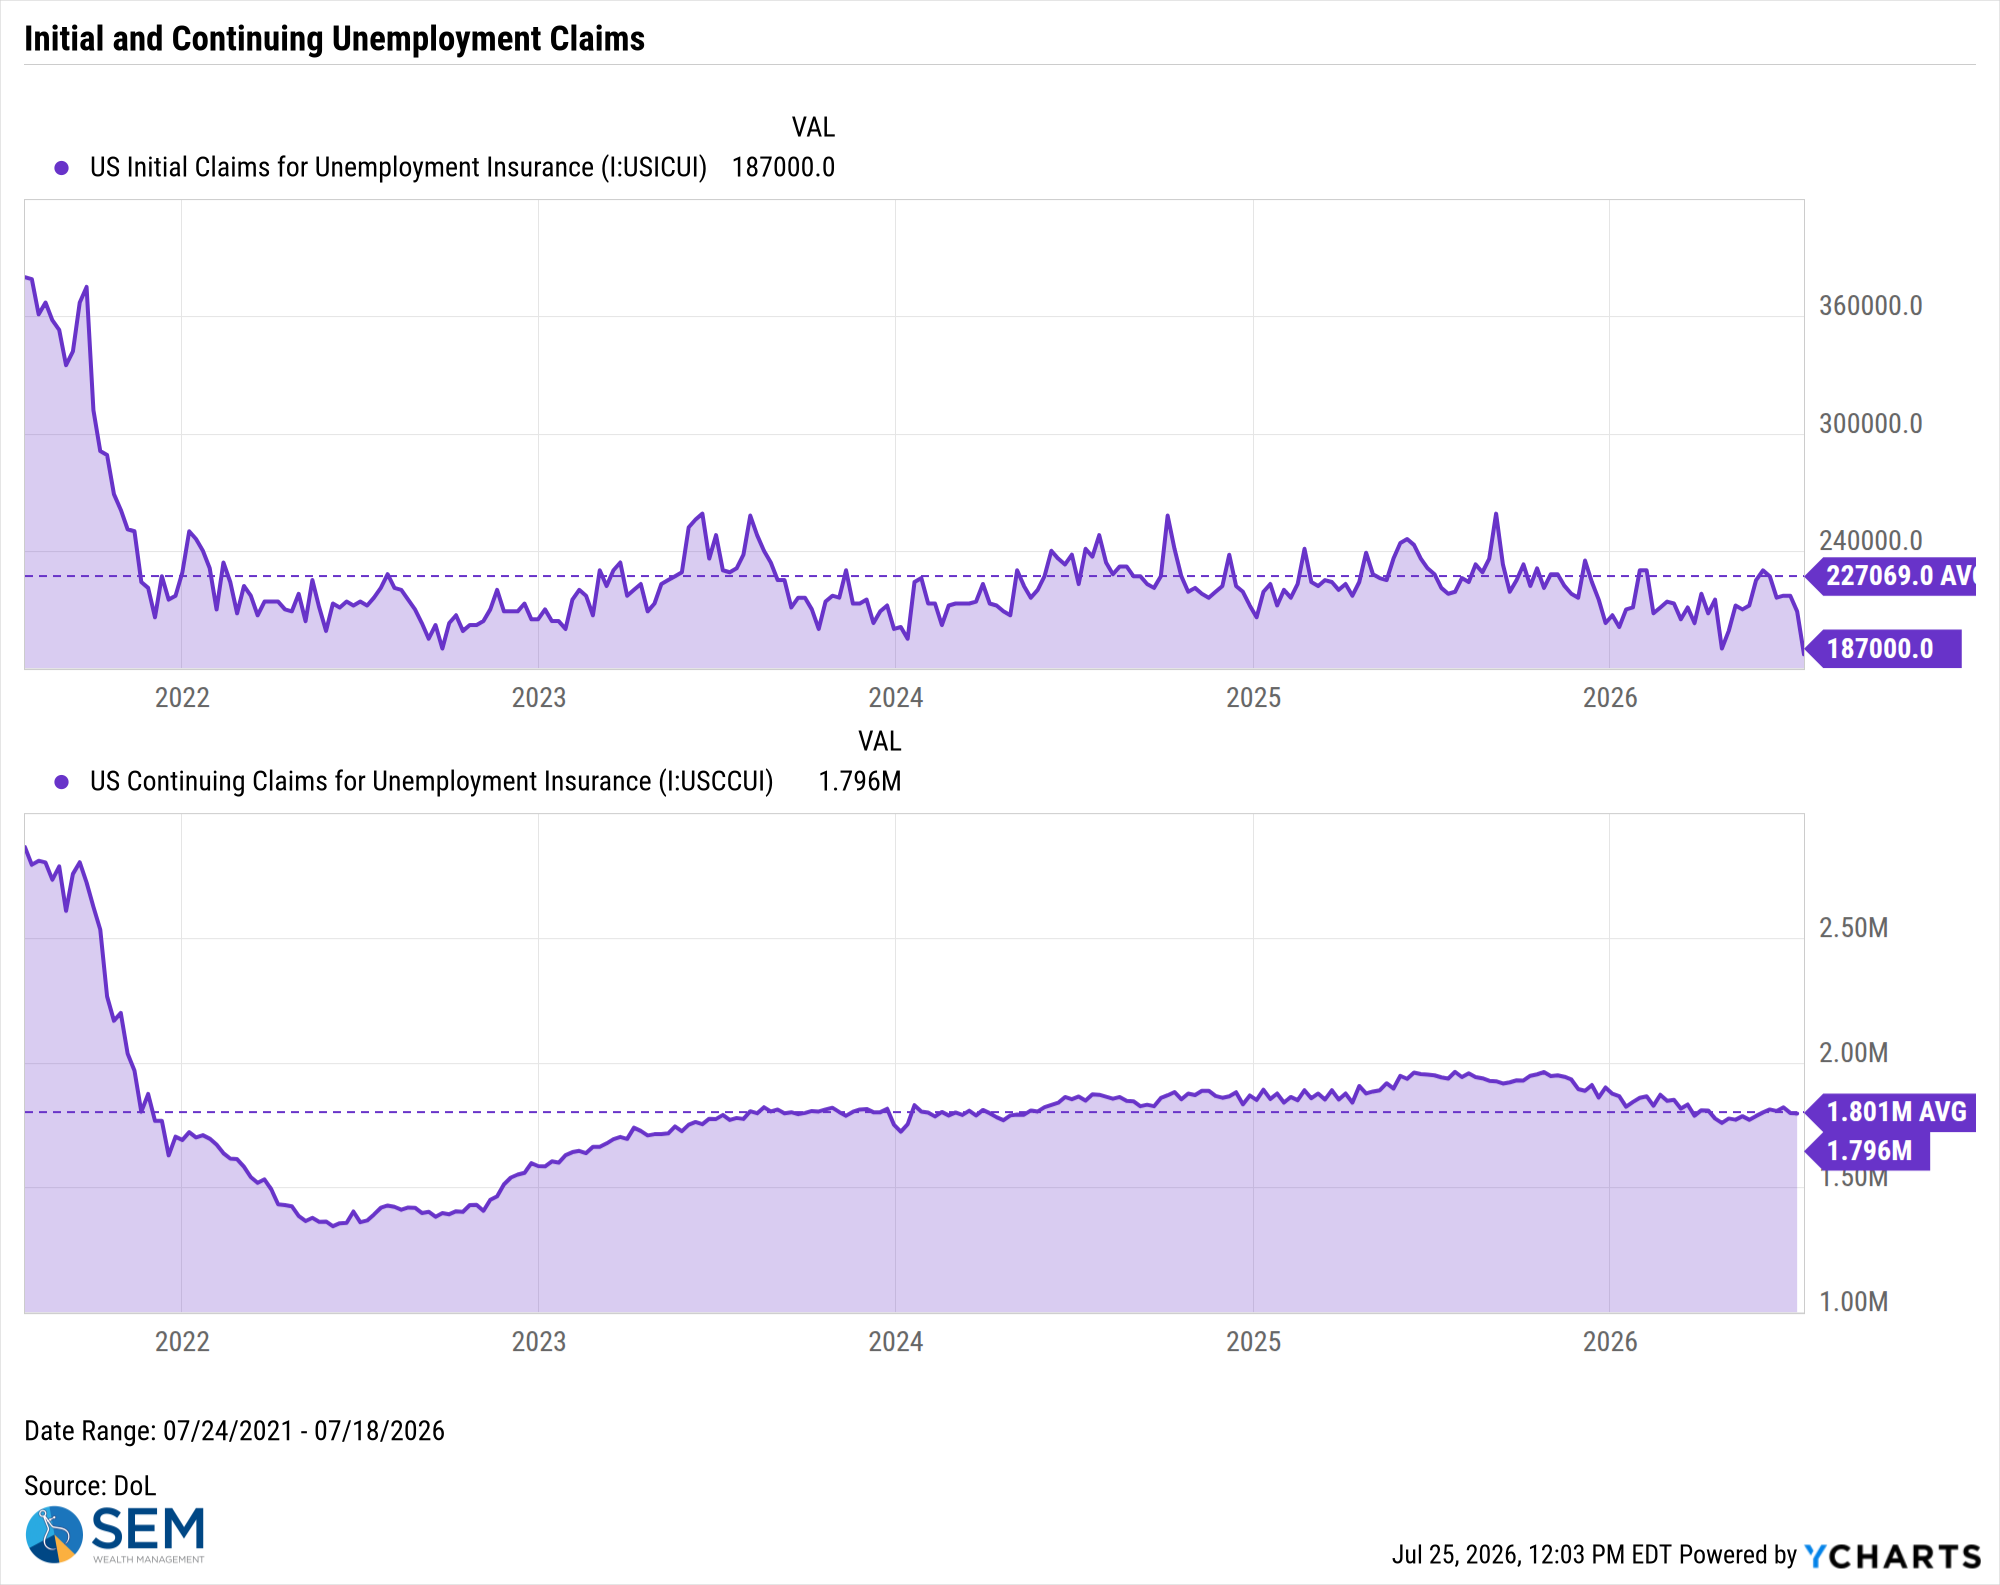
US Initial Claims for Unemployment Insurance data by YCharts
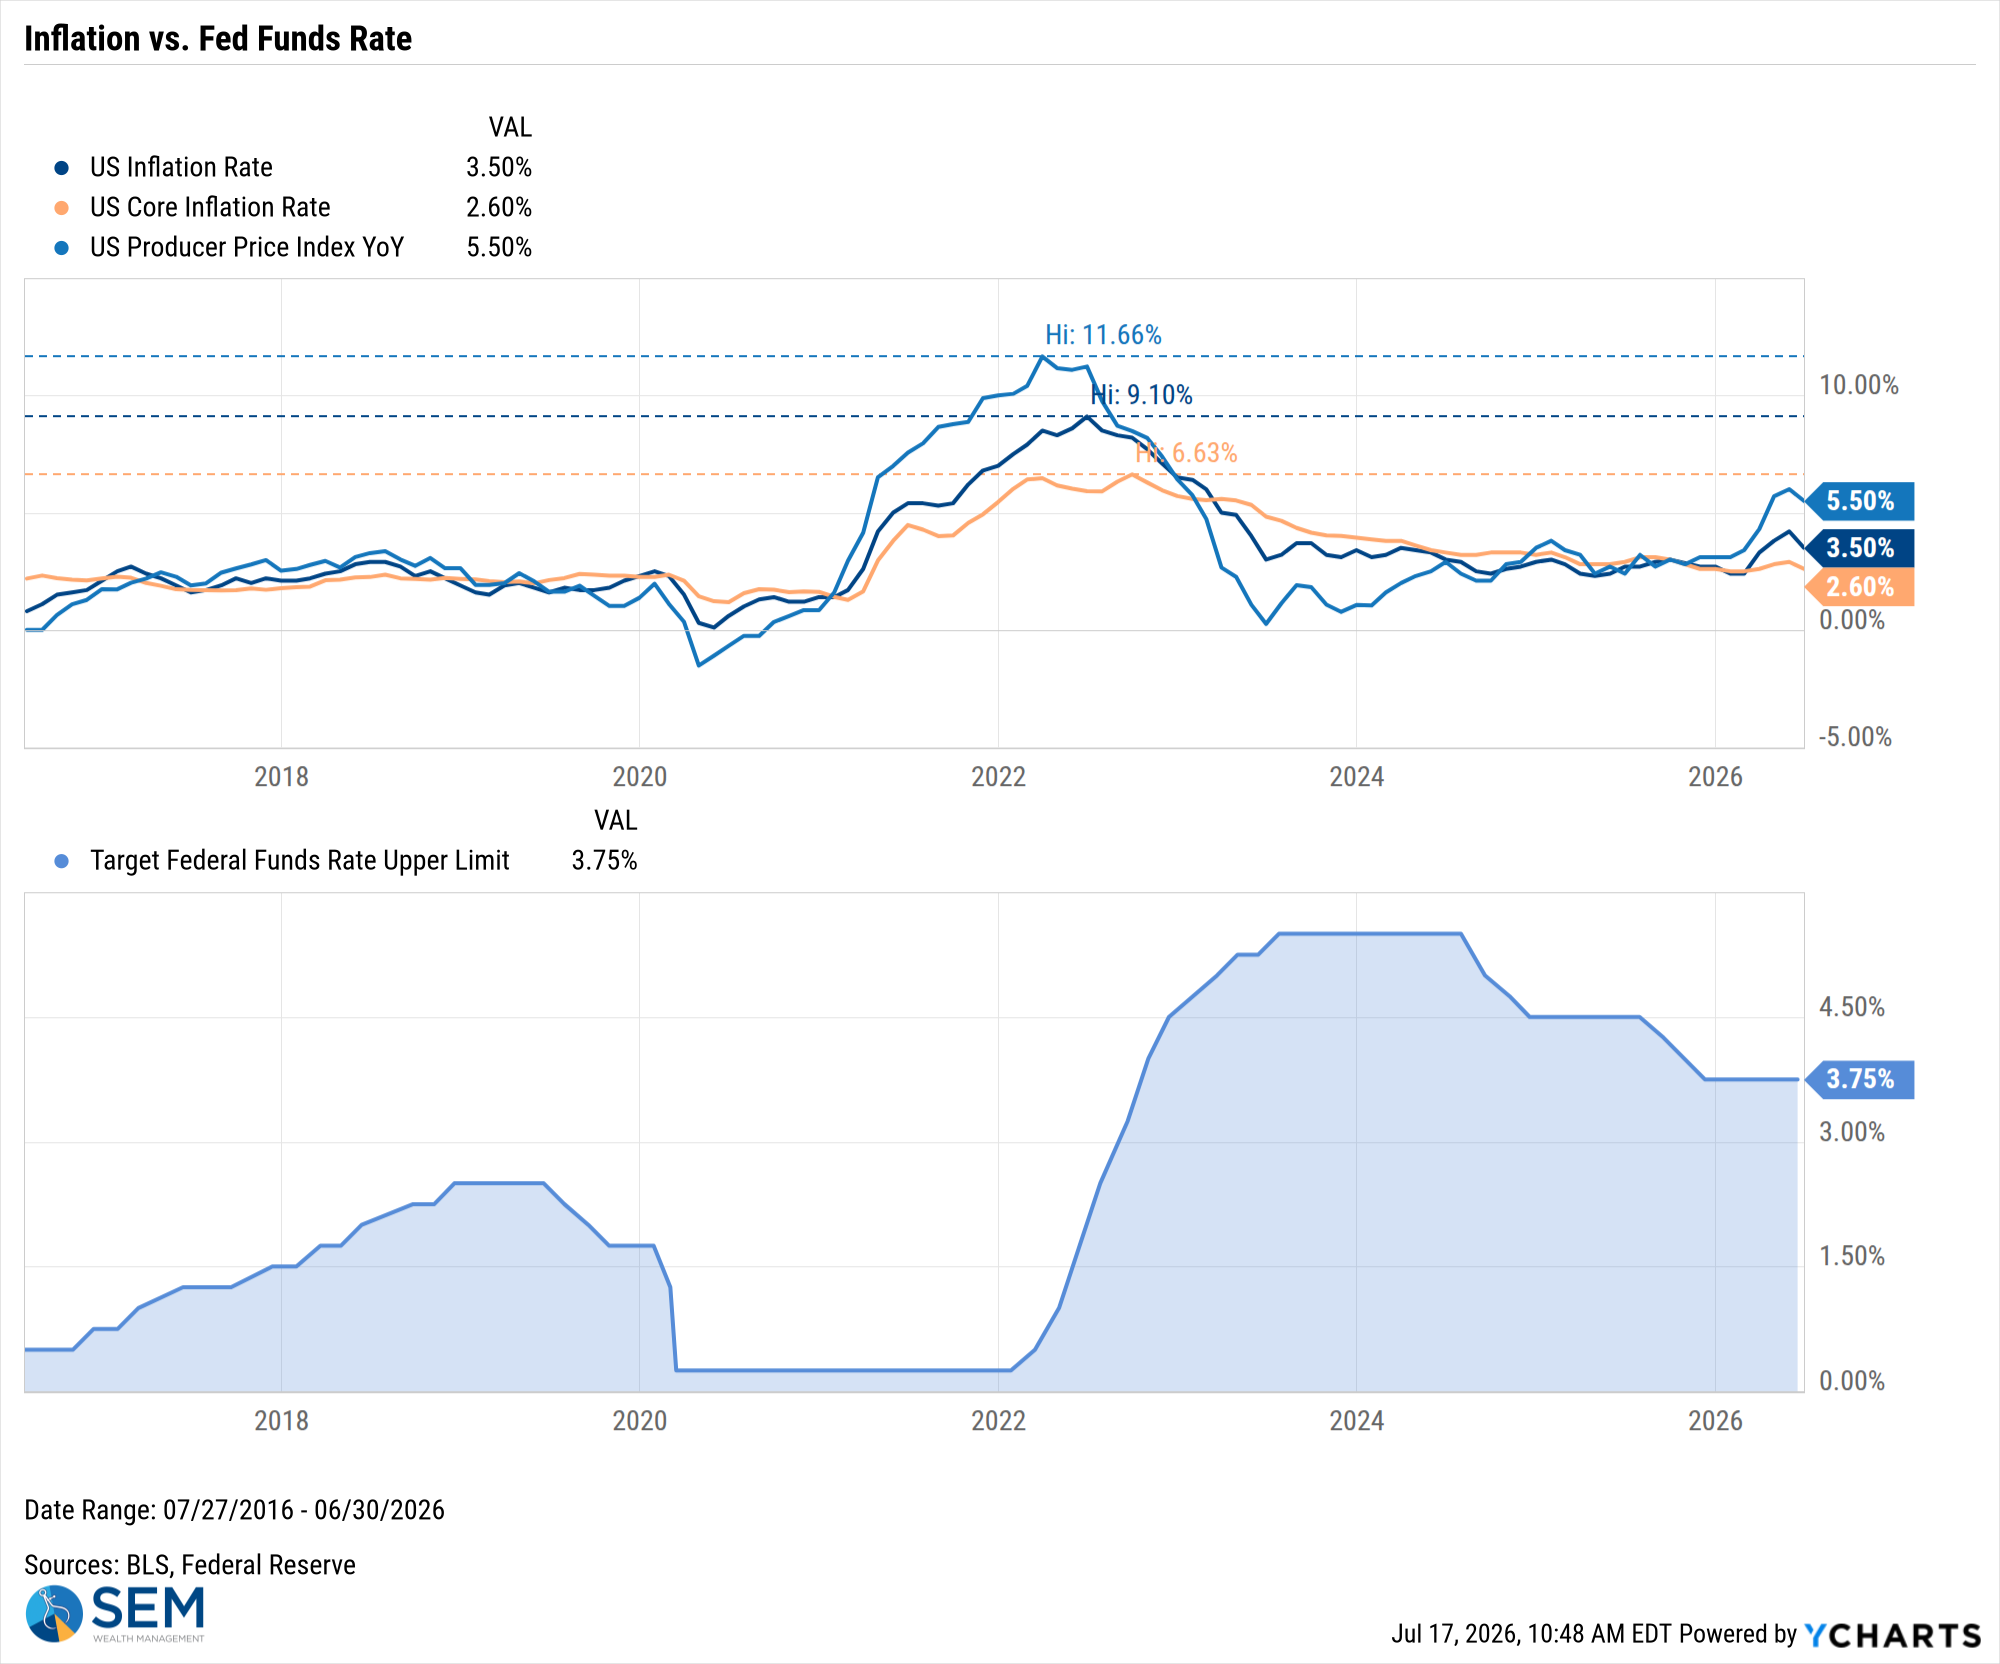
US Inflation Rate data by YCharts
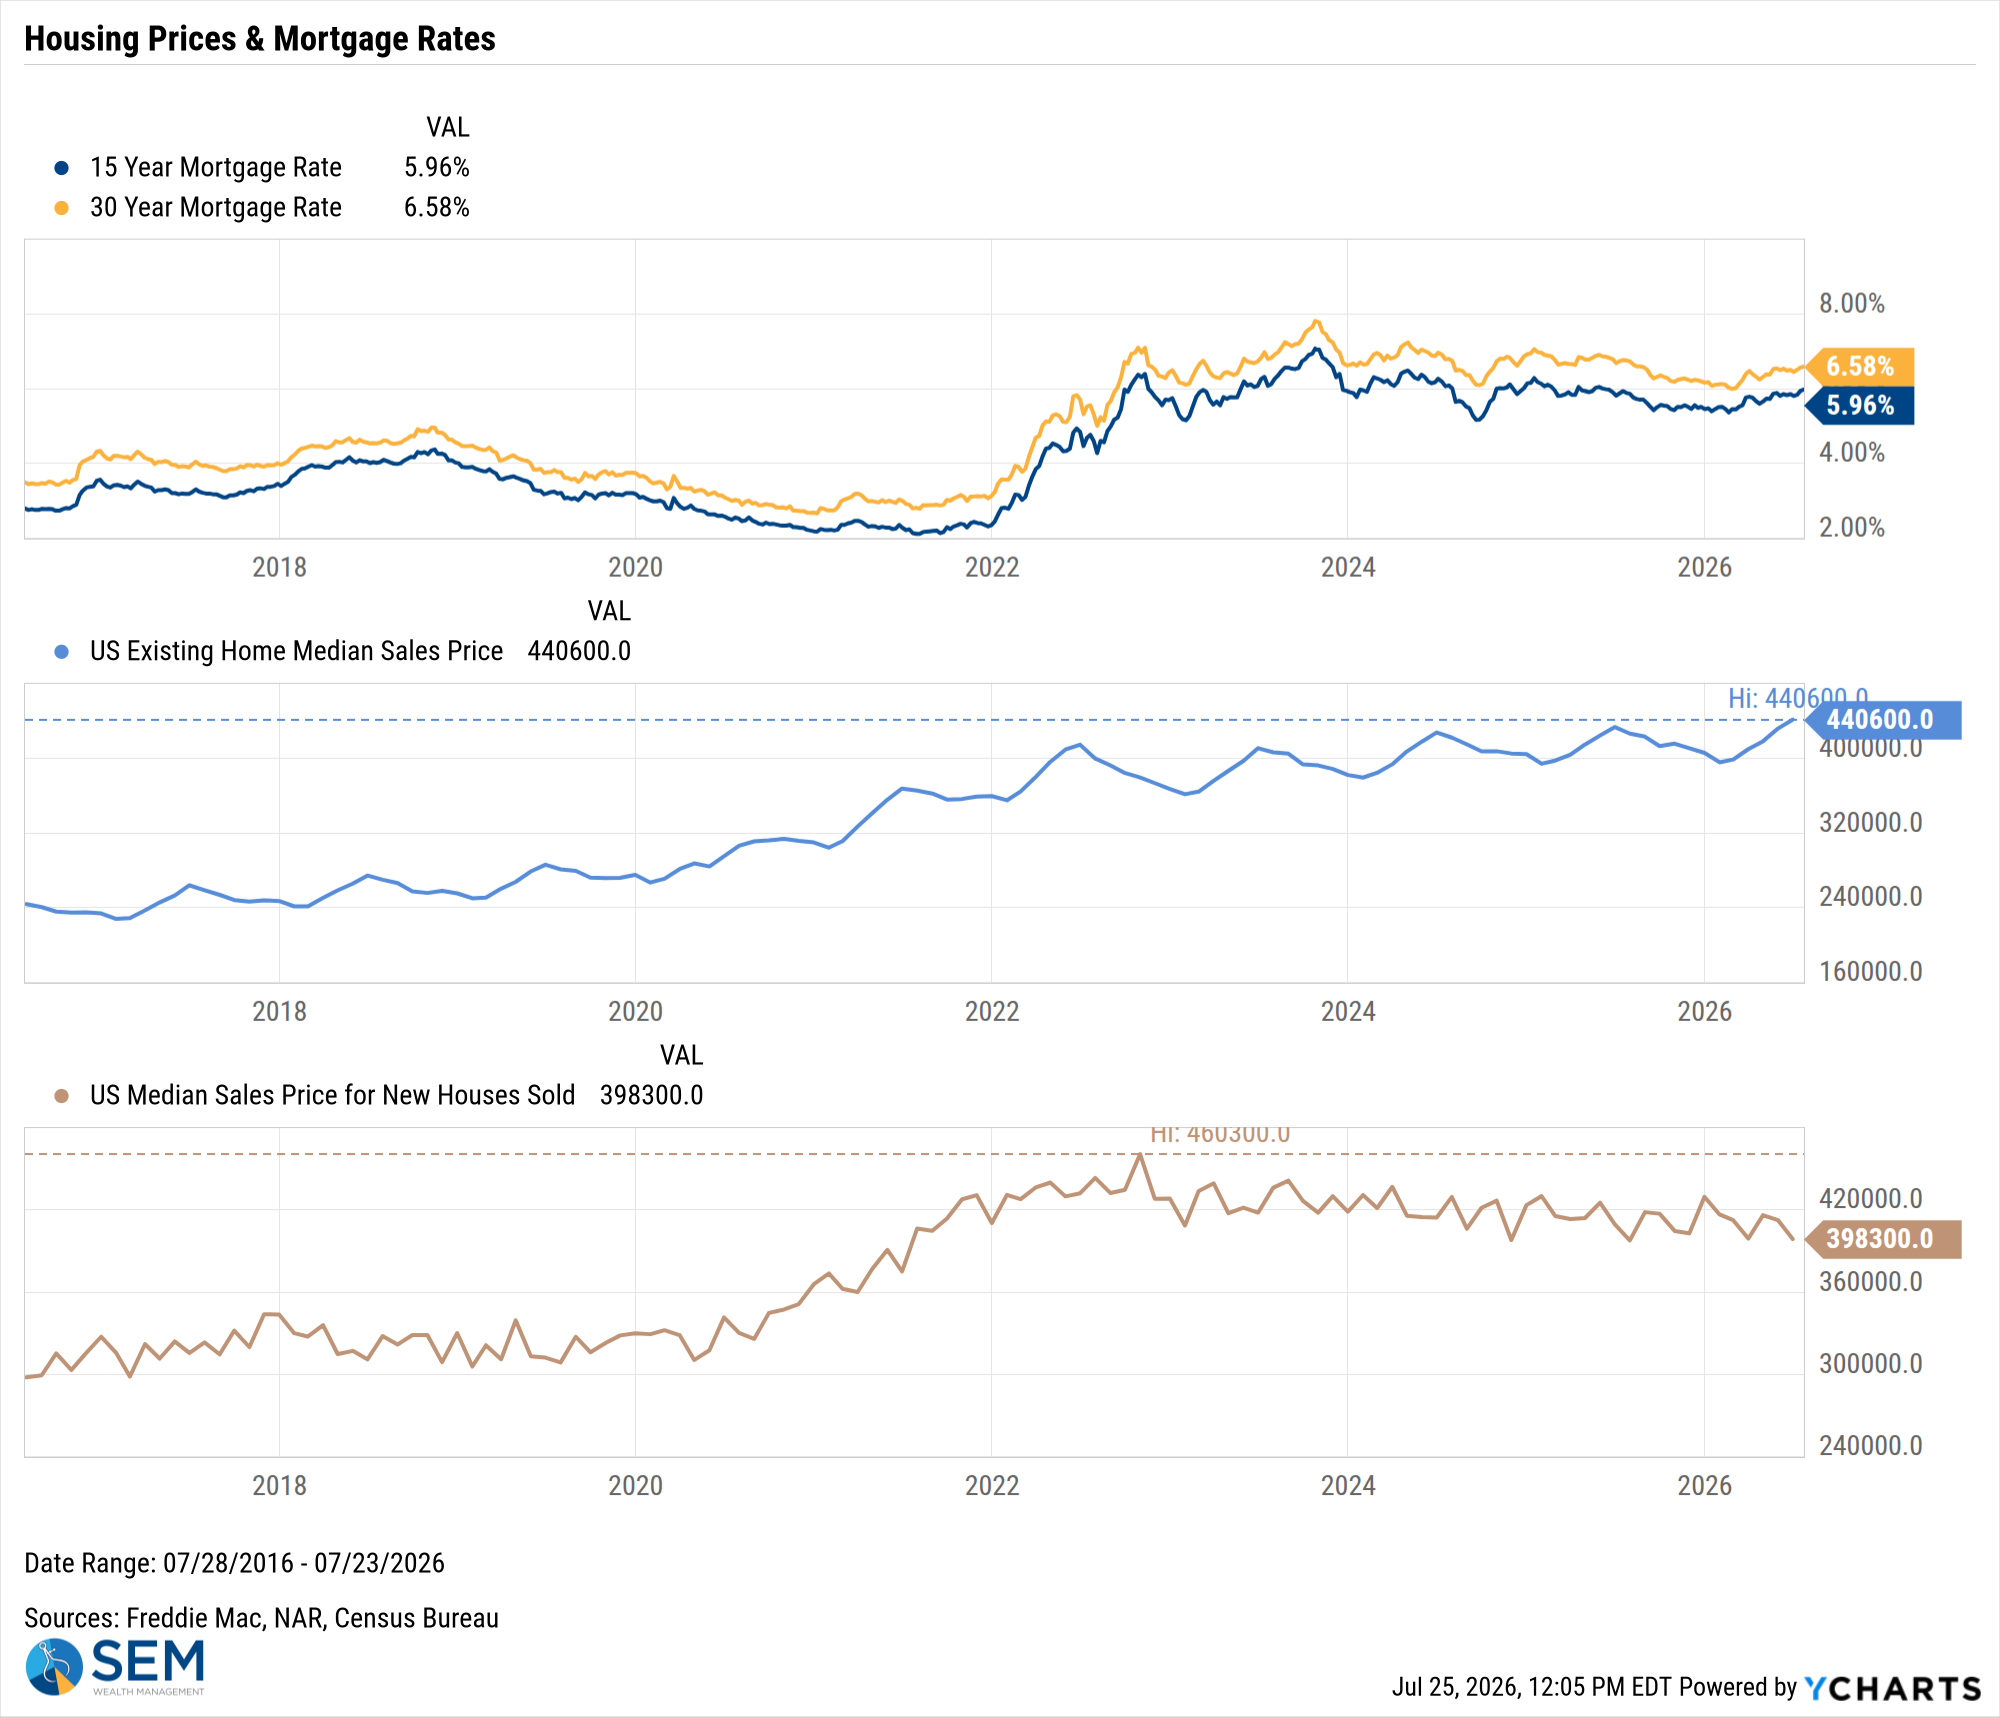
US Existing Home Median Sales Price data by YCharts
SEM Market Positioning
SEM deploys 3 distinct approaches – Tactical, Dynamic, and Strategic. These systems have been described as 'daily, monthly, quarterly' given how often they may make adjustments. Here is where they each stand.
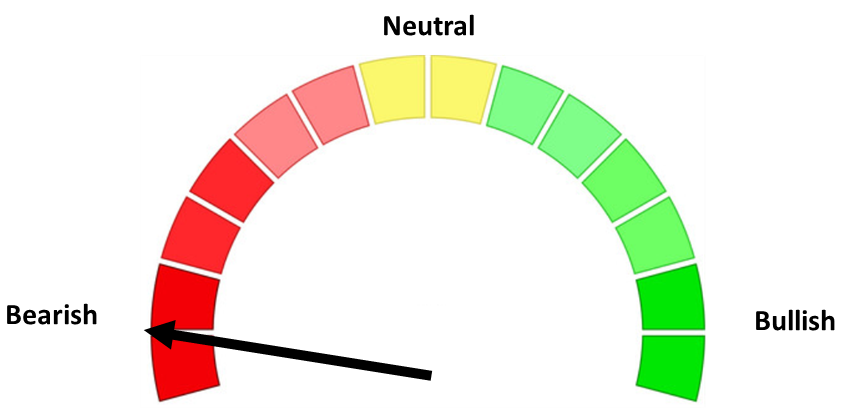
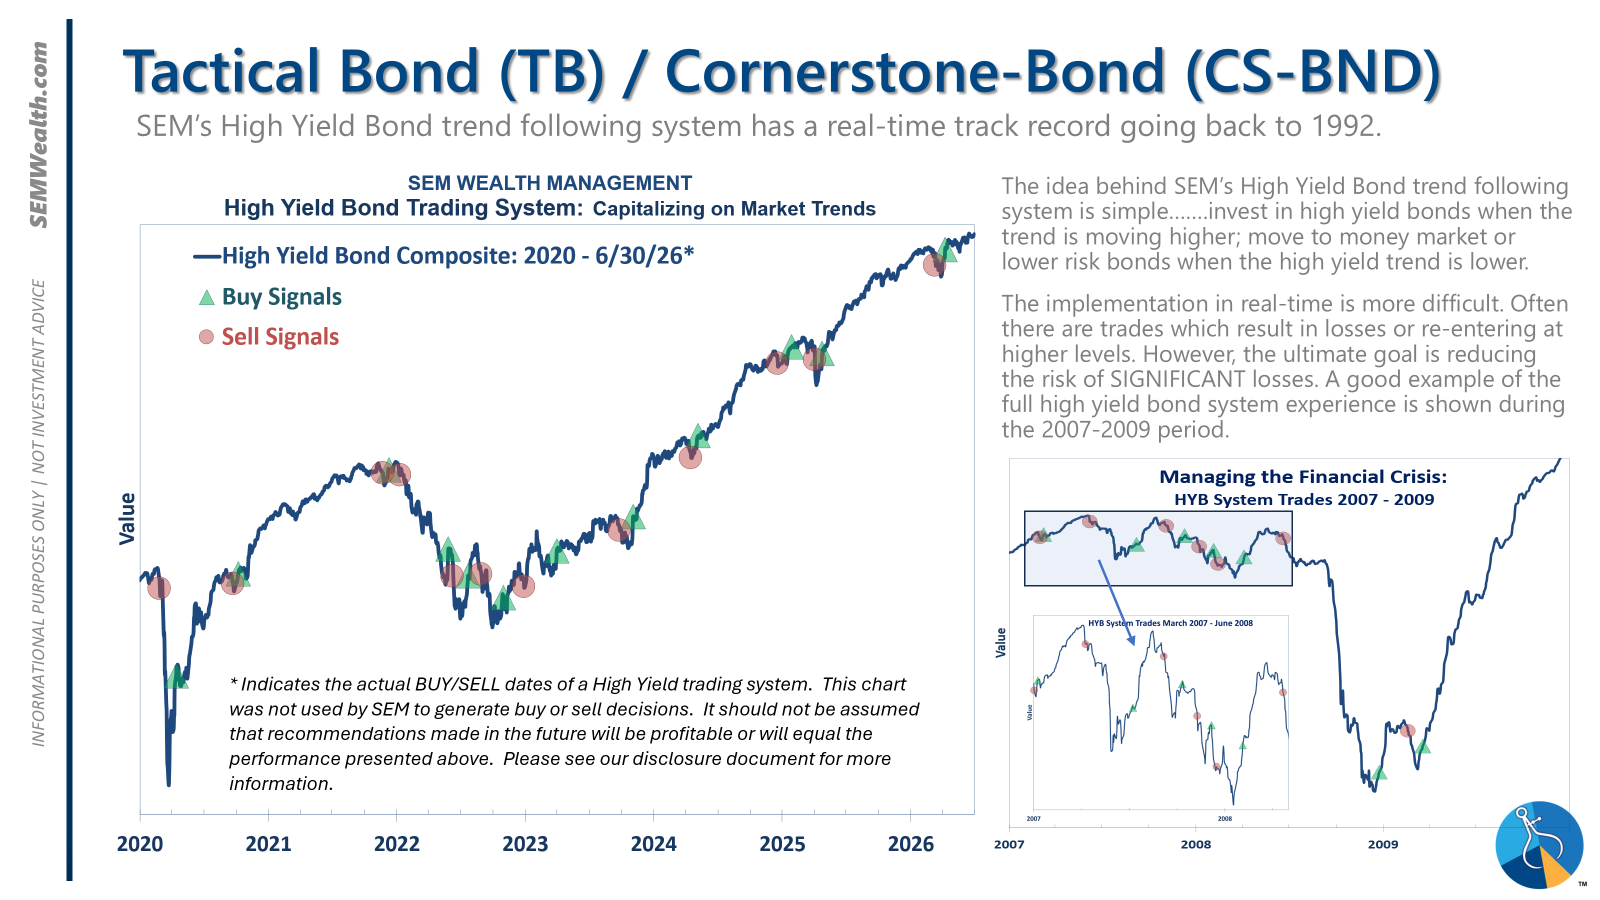
- Tactical = BULLISH | 100% High Yield Bond (4/8/2026) | High-yield spreads remain narrow but trend is slightly higher
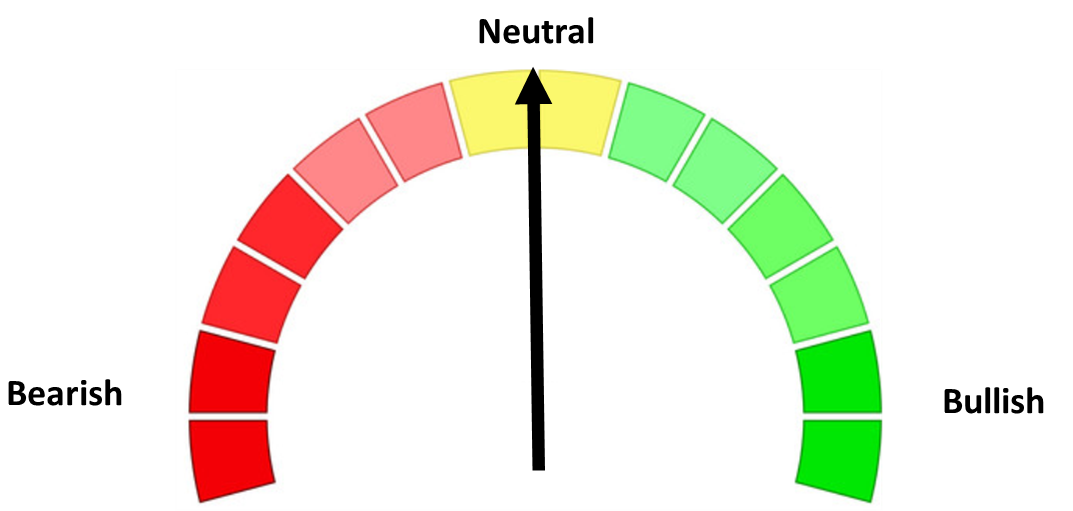
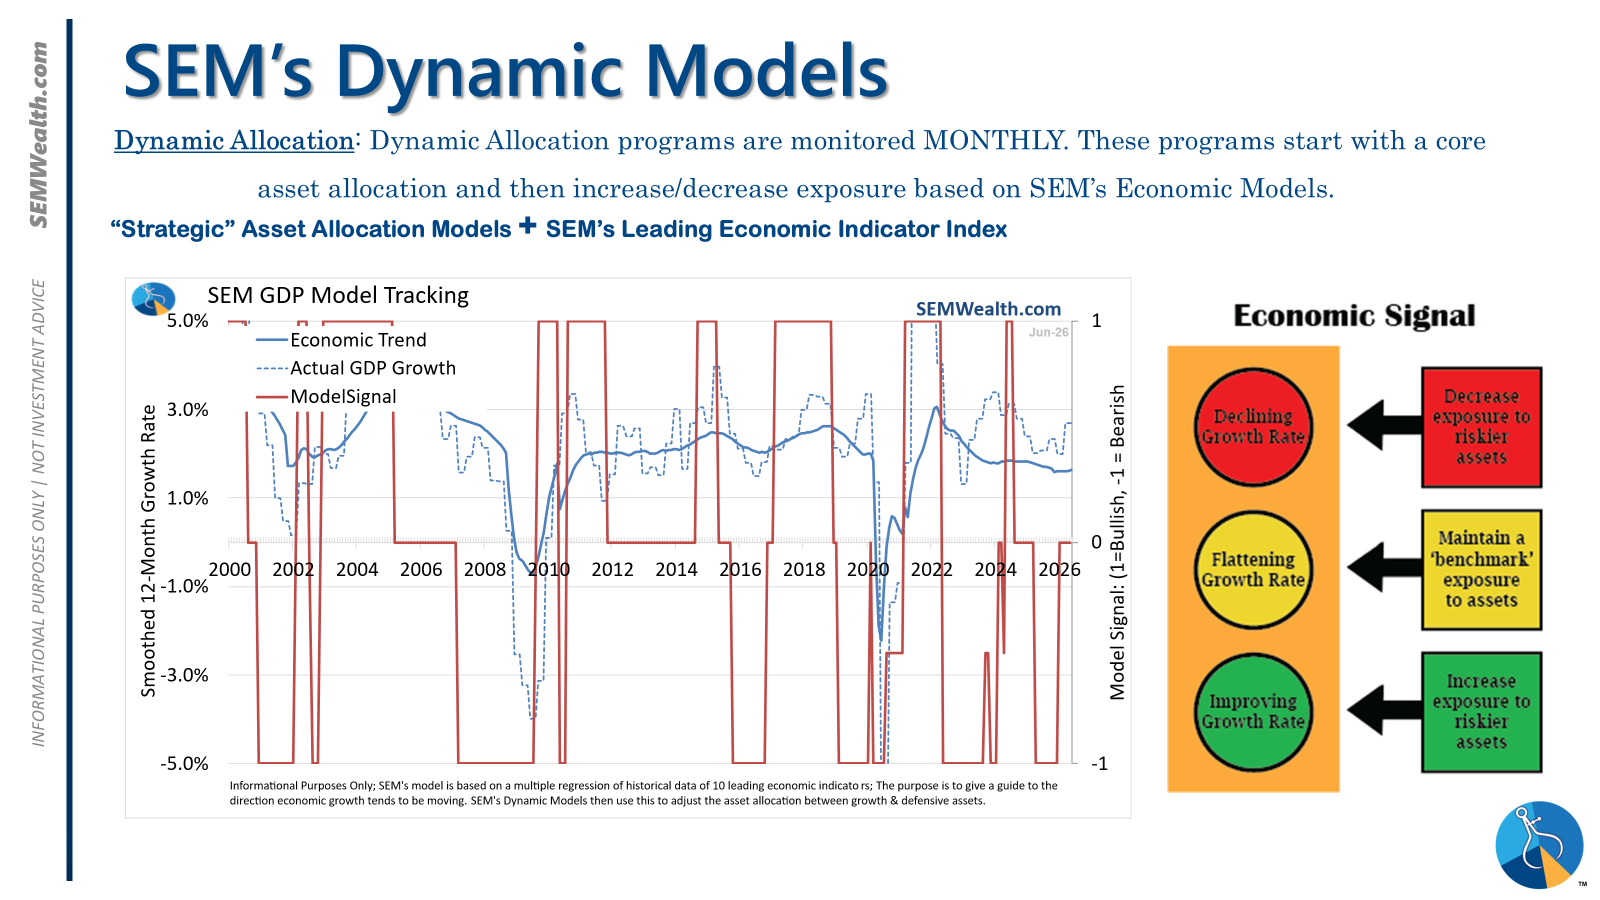
- Dynamic = NEUTRAL (2/15/2026) | "Benchmark" Allocation | Economic model inconclusive
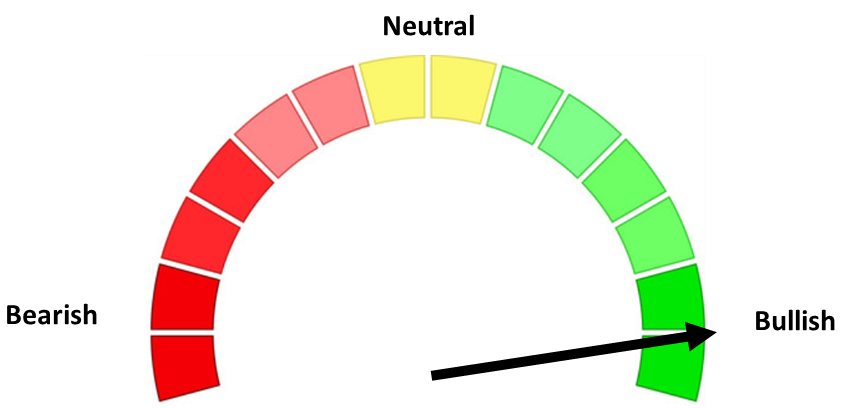
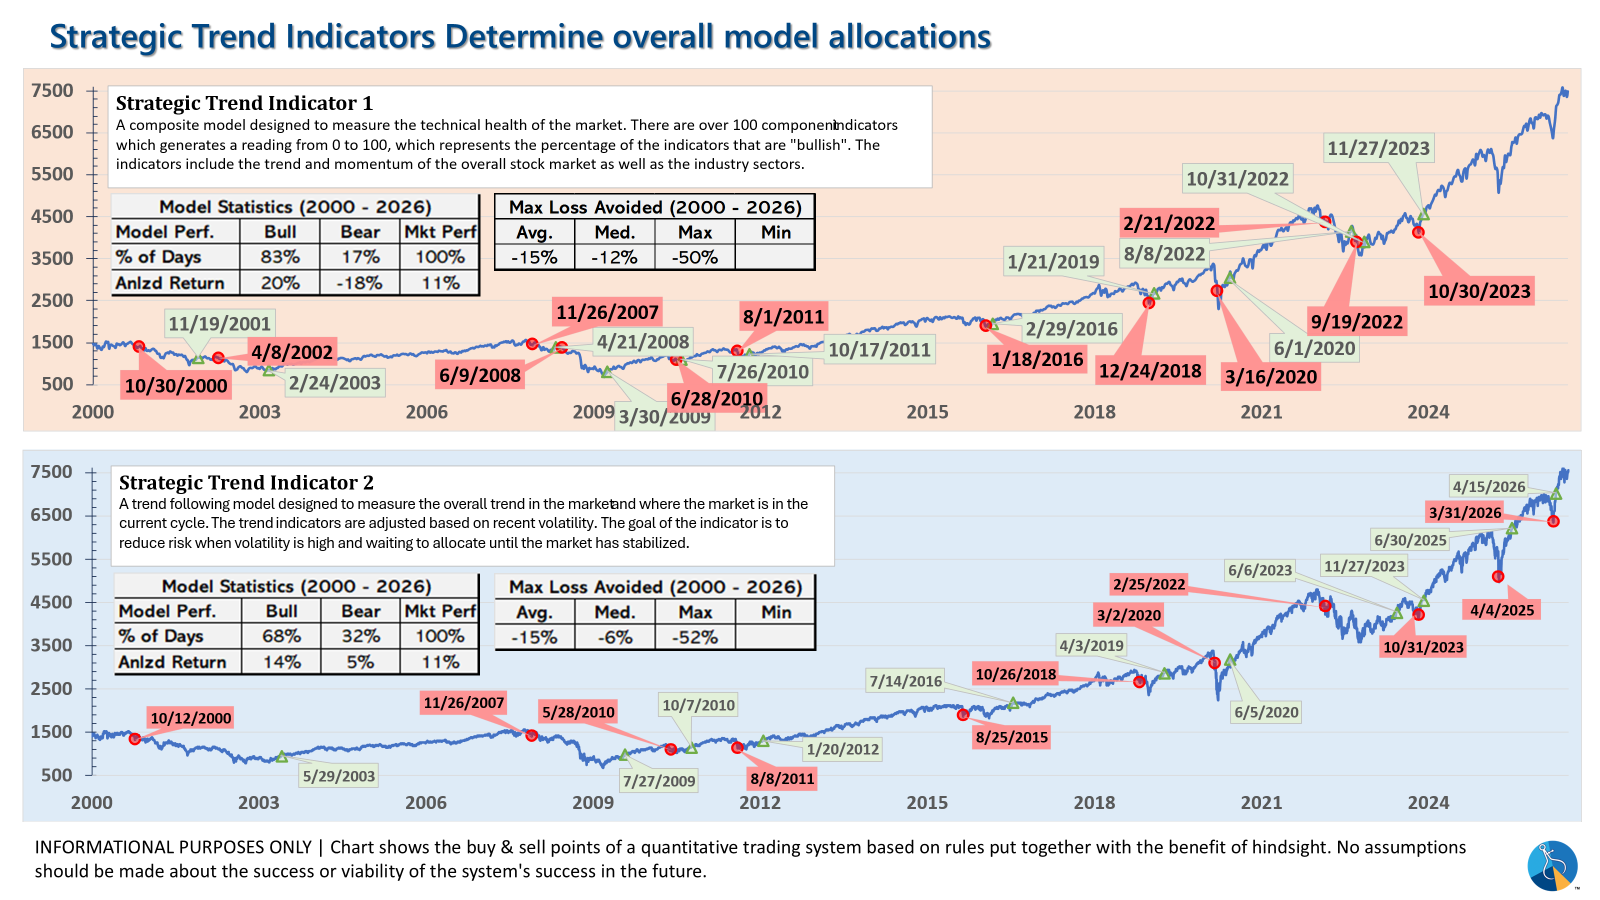
- Strategic = BULLISH (4/15/2026) | V-Bottom projecting "end" of Iran War
Tactical (daily):
- Monitored DAILY
- Models: Tactical Bond, Cornerstone Bond, Income Allocator, Tax Advantaged Bond
- Designed to follow the trends for use in our lower risk models
- BUY Signal issued April 8, 2026 (exiting the sell from March 13)
Dynamic (monthly):
- Monitored MONTHLY
- Models: All "Dynamic" Models (Income, Balanced, Growth, and Asset Allocator)
- Uses SEM's Quantitative Economic Model
- Designed to overweight riskier assets if economic trend is higher & underweight those assets if economic trend is lower.
- NEUTRAL signal issued February 15, 2026 (following BEARISH signal from July 2025)
Strategic (quarterly)*:
- Monitored QUARTERLY
- Models: AmeriGuard (Balanced, Moderate, & Growth) and Cornerstone (Balanced & Growth)
- Core Component: Quantitative Filter using 4 different time horizons across universe of asset classes
- Trend Indicator: Two different Quantitative Systems monitoring the intermediate-term trend, health of the market, and volatility
- CORE has been overweight small cap and international since October 2025 – overweight increased slightly in January
- Both TREND INDICATORS are BULLISH following 10% drop and "V-Bottom" reversal in early April
- AmeriGuard & Cornerstone Max DO NOT use the Trend indicator and are always 100% invested in stocks using our CORE rotation model.
The core rotation is adjusted quarterly. This quarter we saw half of our international positions reduced (we sold developed markets and kept our emerging markets exposure). We also saw the remaining share of mid-cap reduced in favor of more small cap exposure. We remain with a "barbell" core portfolio – about half in large cap and half in small cap as the models expect the market to "broaden".
The * in quarterly is for the trend models. These models are watched daily but they trade infrequently based on readings of where each believe we are in the cycle. The trend systems can be susceptible to "whipsaws" as we saw with the recent sell and buy signals at the end of October and November. The goal of the systems is to miss major downturns in the market. Risks are high when the market has been stampeding higher as it has for most of 2023. This means sometimes selling too soon. As we saw with the recent trade, the systems can quickly reverse if they are wrong.
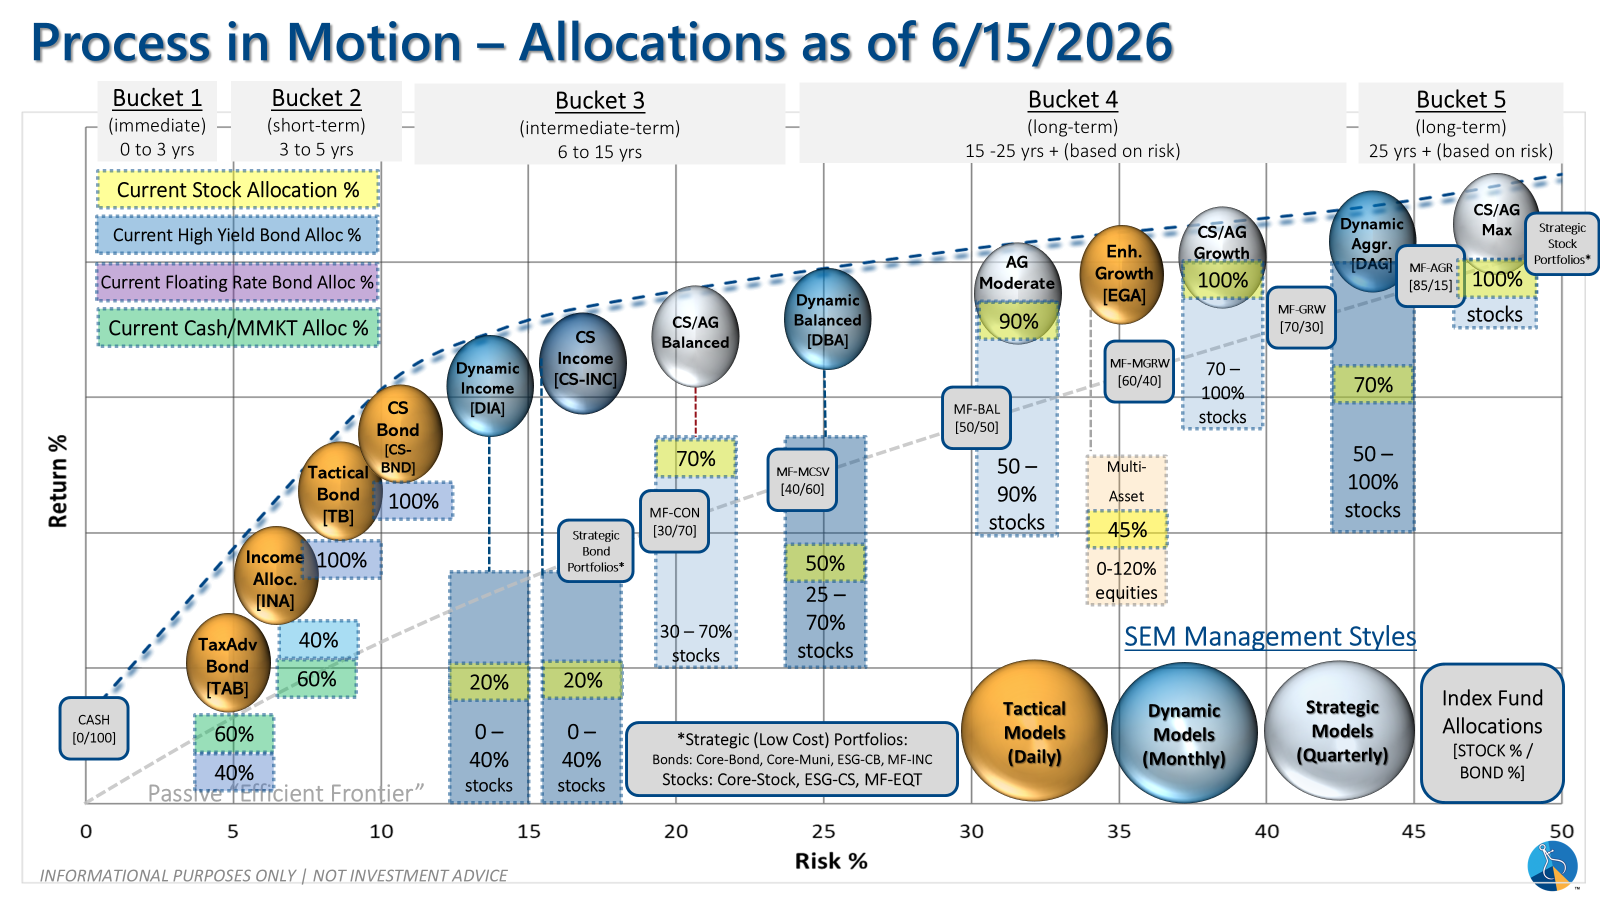
Overall, this is how our various models stack up based on the last allocation change:
Curious if your current investment allocation aligns with your overall objectives and risk tolerance?